
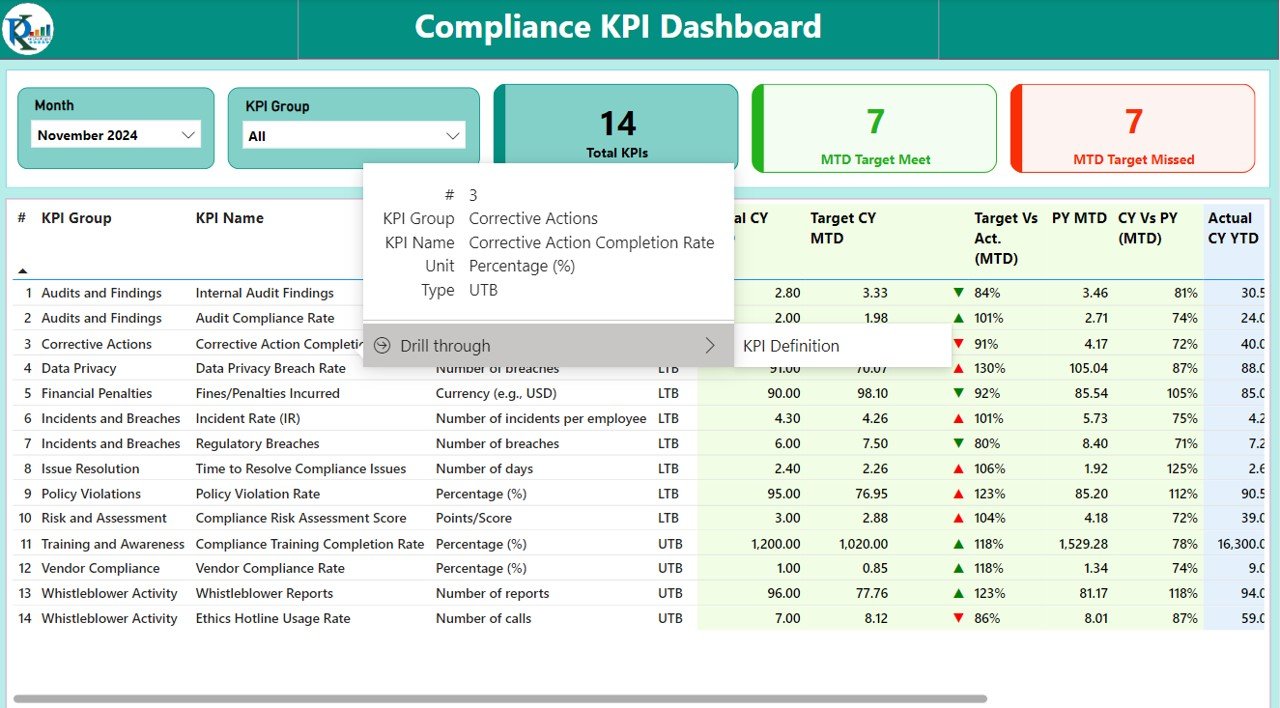

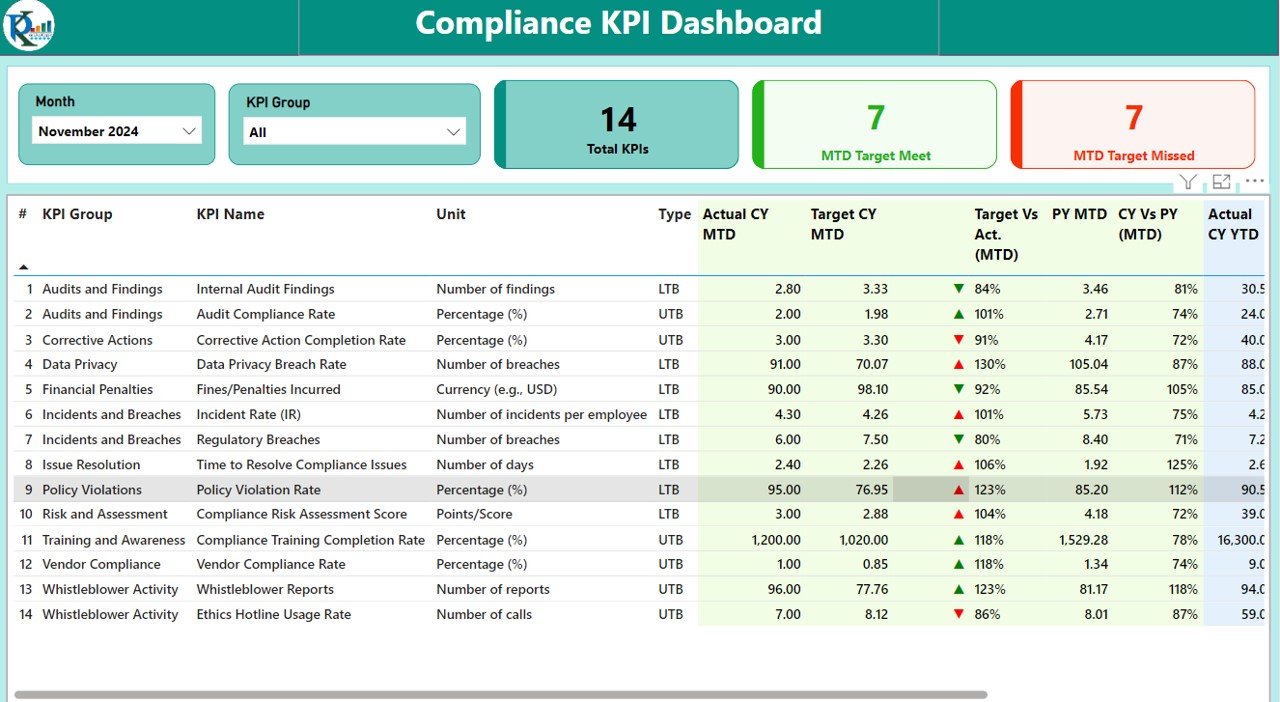
The Compliance KPI Dashboard in Power BI is a comprehensive tool designed to help businesses, compliance officers, and regulatory teams track and monitor their compliance performance in real-time. This interactive dashboard offers a centralized view of key compliance metrics, such as audit results, risk assessments, regulatory deadlines, and adherence to industry standards, ensuring that your organization remains compliant with all relevant laws and regulations.
With its visually appealing charts and real-time data updates, this Power BI dashboard allows you to monitor compliance across various departments, identify areas of non-compliance, and take proactive steps to mitigate risks and ensure compliance. Whether you’re tracking internal audits, regulatory filings, or policy adherence, this customizable dashboard provides the insights you need to stay on top of your compliance efforts.
Key Features of the Compliance KPI Dashboard in Power BI
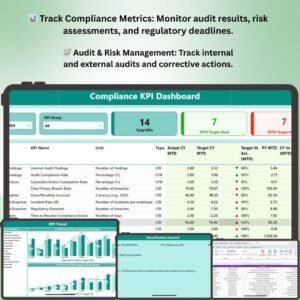
📊 Track Compliance Metrics
Monitor key compliance metrics such as audit results, risk assessments, legal requirements, and regulatory deadlines. Track adherence to laws, policies, and industry standards to ensure that your business remains compliant.
📈 Real-Time Data Monitoring
Get up-to-date insights into your organization’s compliance performance. The dashboard automatically updates with the latest data, allowing you to monitor progress and stay ahead of compliance deadlines.
📝 Audit & Risk Assessment Tracking
Track the status of internal and external audits, risk assessments, and investigations. Keep tabs on findings, action plans, and completion status to ensure compliance gaps are identified and addressed quickly.
⏳ Regulatory Deadline Monitoring
Monitor key regulatory deadlines, submission dates, and compliance milestones. Ensure timely reporting, submissions, and filings to avoid penalties or legal complications.
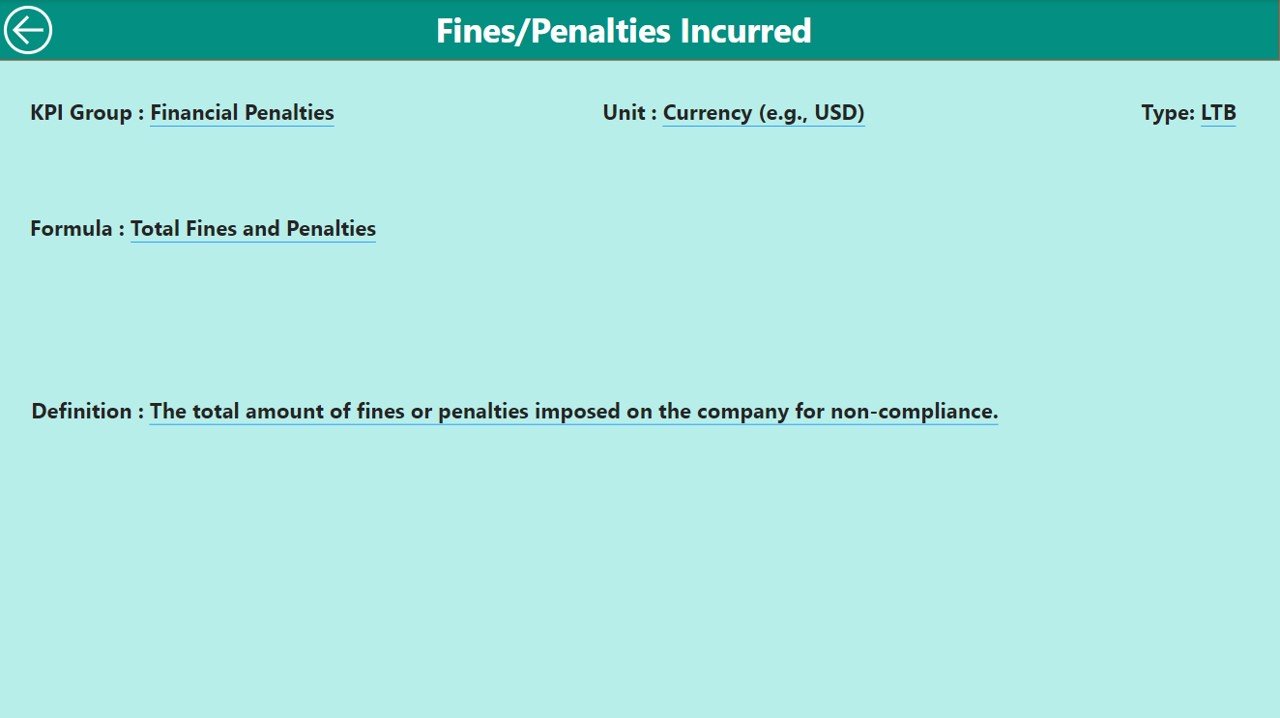
⚖️ Policy Adherence & Enforcement Tracking
Track compliance with company policies and procedures. Measure adherence to internal policies, codes of conduct, and industry-specific regulations to maintain a strong compliance culture.
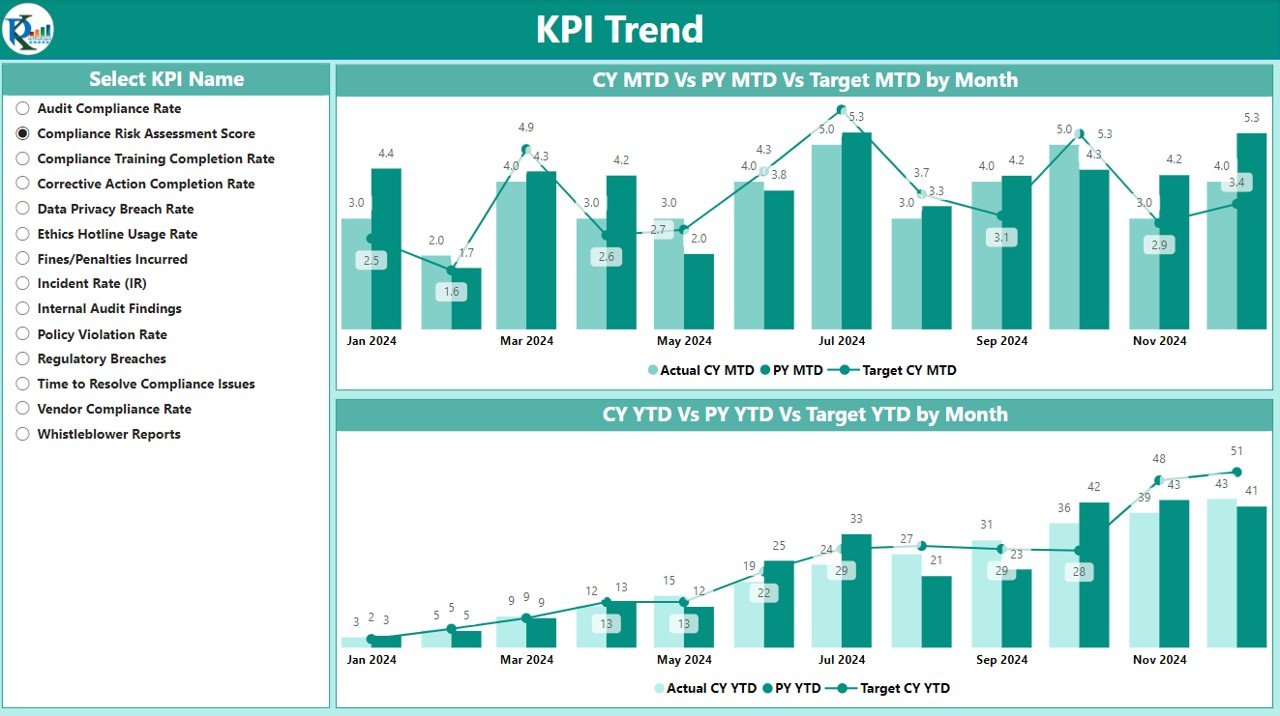
🖥️ Customizable & Interactive Visualizations
The dashboard offers interactive charts and customizable filters, allowing you to drill down into specific compliance areas, such as department-wise compliance or specific regulatory areas. Gain deeper insights into areas of concern and focus your efforts on critical compliance needs.
Why You’ll Love the Compliance KPI Dashboard in Power BI
✅ Centralized Compliance Monitoring
Track all your compliance activities in one place. Monitor audit results, regulatory deadlines, risk assessments, and policy adherence in real time to ensure your organization stays compliant across departments.
✅ Stay Ahead of Regulatory Deadlines
Never miss a regulatory deadline again. Monitor key submission dates, compliance milestones, and legal requirements to ensure timely compliance and avoid penalties.
✅ Optimize Risk Management
Track audit findings, risk assessments, and action plans. Identify risks early and take corrective action to mitigate compliance issues and ensure business continuity.
✅ Improve Policy Adherence
Monitor adherence to internal policies and procedures, ensuring that your team complies with industry standards and regulations at all times.
✅ Fully Customizable for Your Business Needs
The dashboard is fully customizable, allowing you to filter data by department, compliance area, or time period for deeper insights. Adjust KPIs, data points, and visualizations to align with your organization’s compliance goals.
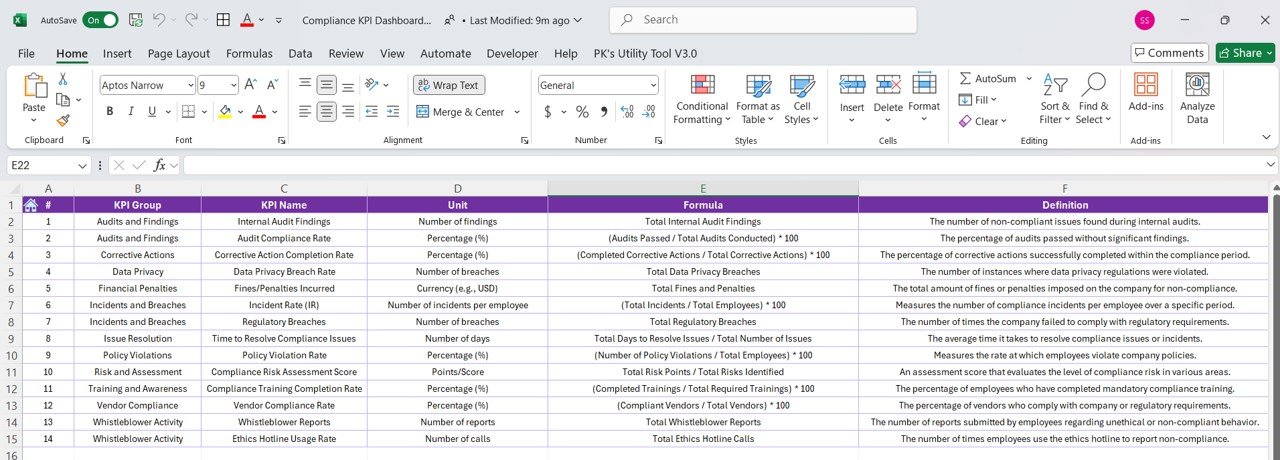
What’s Inside the Compliance KPI Dashboard Template in Power BI?
- Compliance Metrics Tracking: Track audit results, risk assessments, and regulatory compliance.
- Real-Time Data Updates: Get up-to-date compliance data and monitor progress in real time.
- Audit & Risk Assessment Monitoring: Track internal and external audit findings, risk assessments, and corrective actions.
- Regulatory Deadline Monitoring: Ensure timely completion of regulatory submissions and filings.
- Policy Adherence Tracking: Monitor adherence to internal policies and industry regulations.
- Customizable Filters & Visualizations: Drill down into data by department, date, or compliance area.
How to Use the Compliance KPI Dashboard in Power BI
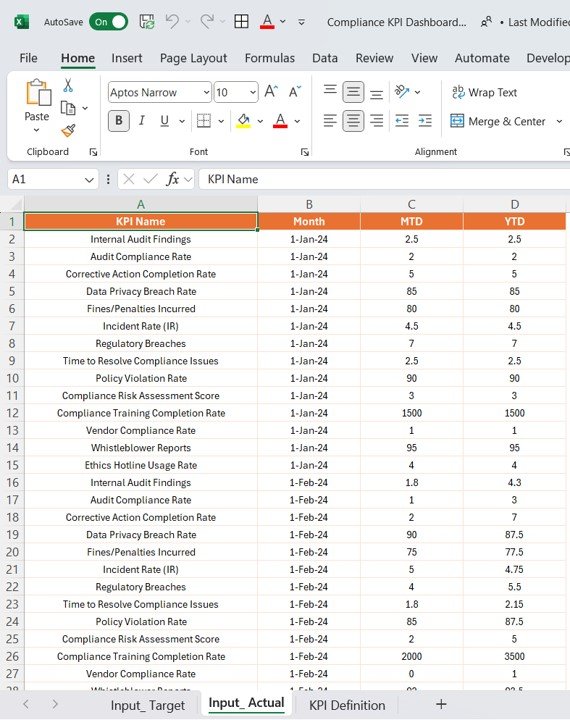
1️⃣ Download the Template: Get immediate access to the Compliance KPI Dashboard in Power BI.
2️⃣ Input Compliance Data: Enter audit results, regulatory deadlines, risk assessments, and policy data into the dashboard.
3️⃣ Track & Monitor KPIs: Use the dashboard to monitor compliance metrics, audit results, and policy adherence.
4️⃣ Analyze & Optimize Compliance Performance: Use the data to identify non-compliance areas and take corrective action.
5️⃣ Generate Custom Reports & Insights: Create customized reports to share with compliance teams, executives, or regulatory bodies.
Who Can Benefit from the Compliance KPI Dashboard in Power BI?
🔹 Compliance Officers & Managers
🔹 Risk Management & Audit Teams
🔹 Legal & Regulatory Affairs Teams
🔹 Business Owners & Executives
🔹 Internal Auditors & Consultants
🔹 Organizations in Highly Regulated Industries
Ensure your organization stays compliant and meets all regulatory requirements with the Compliance KPI Dashboard in Power BI. Monitor performance, track audits, and manage risks to ensure continuous adherence to industry standards and regulations.
Click here to read the Detailed blog post
Visit our YouTube channel to learn step-by-step video tutorials
Youtube.com/@PKAnExcelExpert


Reviews
There are no reviews yet.