In today’s fast-moving business world, compliance isn’t optional — it’s essential. From corporate governance to data protection, every organization must ensure that its processes, teams, and locations follow the right standards. But when audits and reviews pile up, managing compliance manually can quickly turn into chaos.
That’s where the Compliance Dashboard in Power BI changes the game.
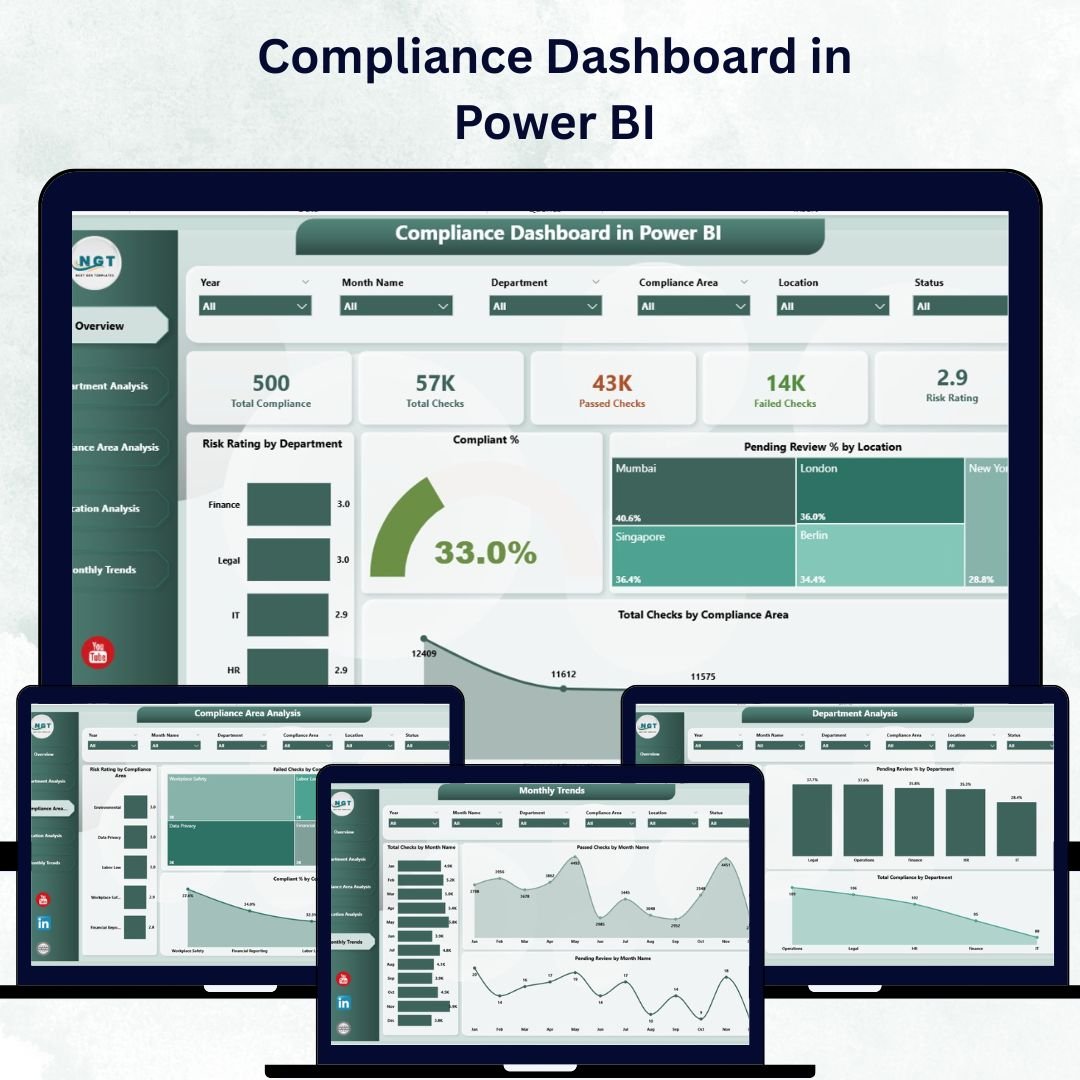
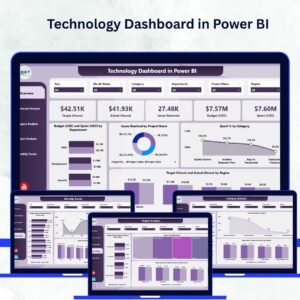
This ready-to-use, interactive dashboard transforms complex compliance data into clear visuals, actionable insights, and instant accountability. It helps you track progress, monitor risks, and evaluate performance — all in one centralized platform. Whether you’re overseeing multiple departments, locations, or compliance areas, this Power BI tool gives you the clarity and confidence to make smarter decisions.
📊 Key Features of Compliance Dashboard in Power BI
✅ 🧭 Five Interactive Pages – Includes Overview, Department Analysis, Compliance Area Analysis, Location Analysis, and Monthly Trends — covering every angle of compliance performance.
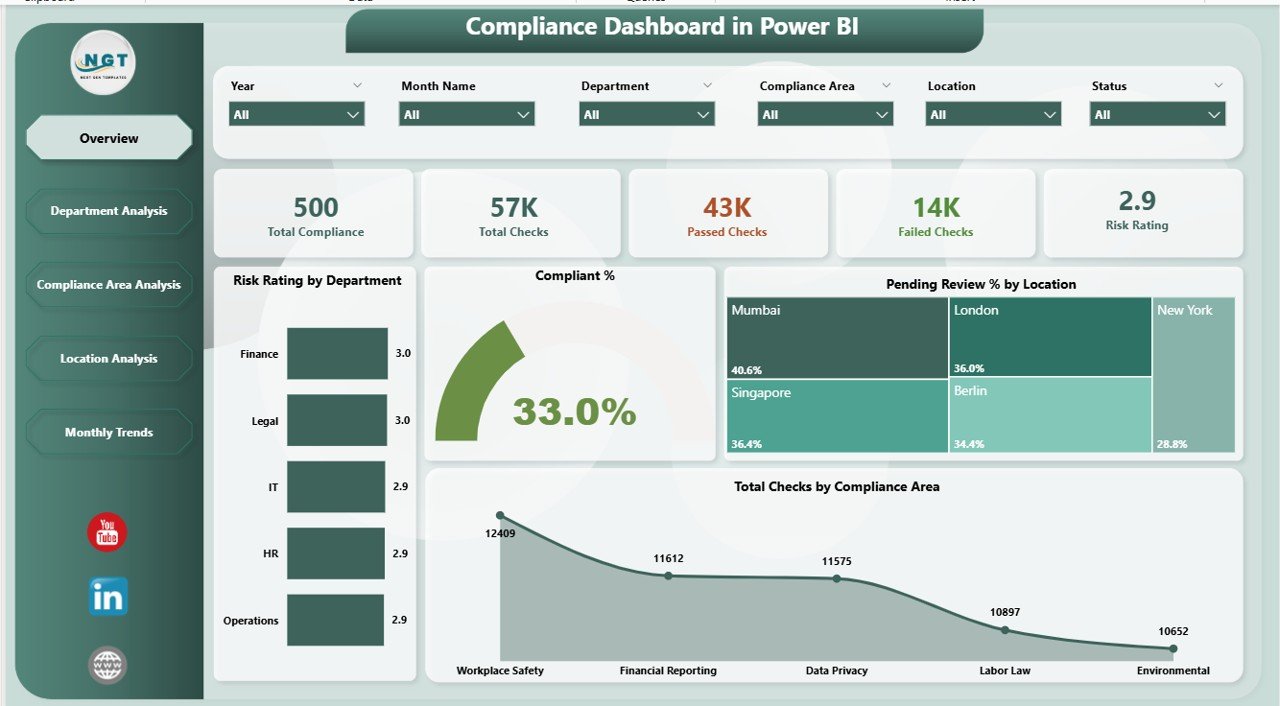
✅ 📋 Overview Page – View 5 KPI cards showing Total Checks, Completed %, Pending Reviews, Risk Rating, and Compliant Areas.
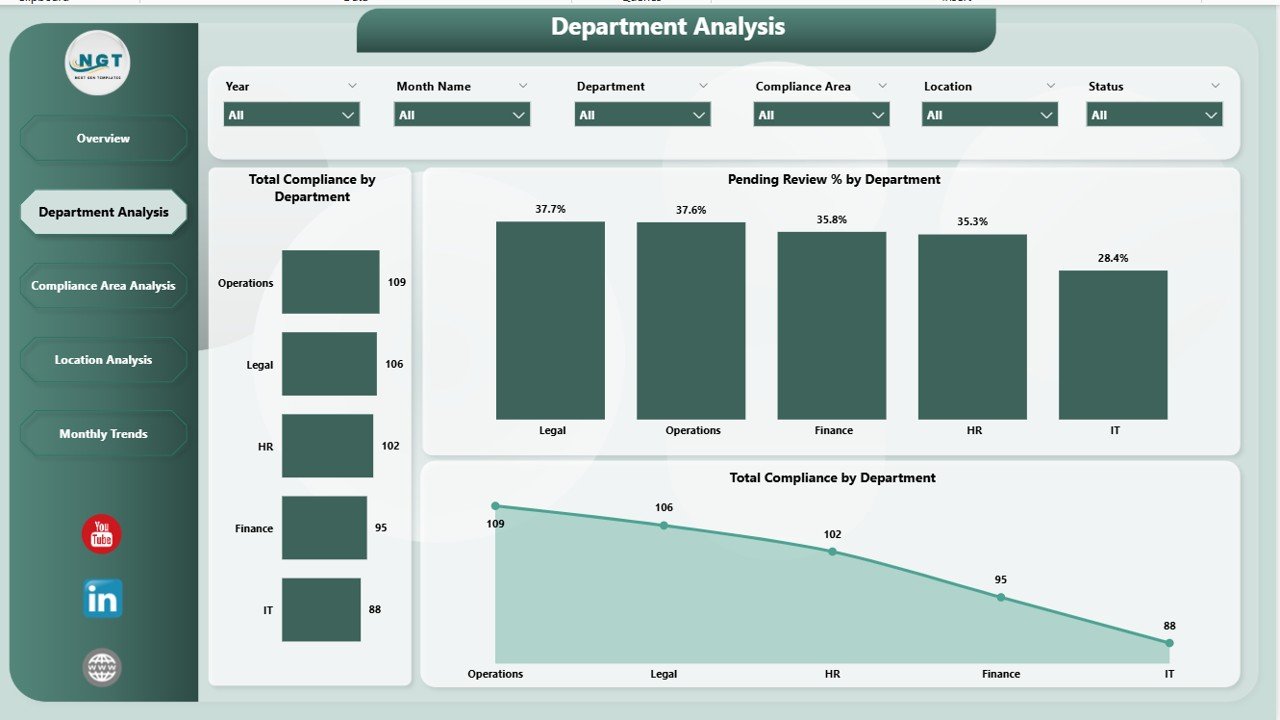
✅ 🏢 Department Analysis – Compare Total Compliance, Pending Reviews, and Departmental Risk Ratings to identify problem zones quickly.
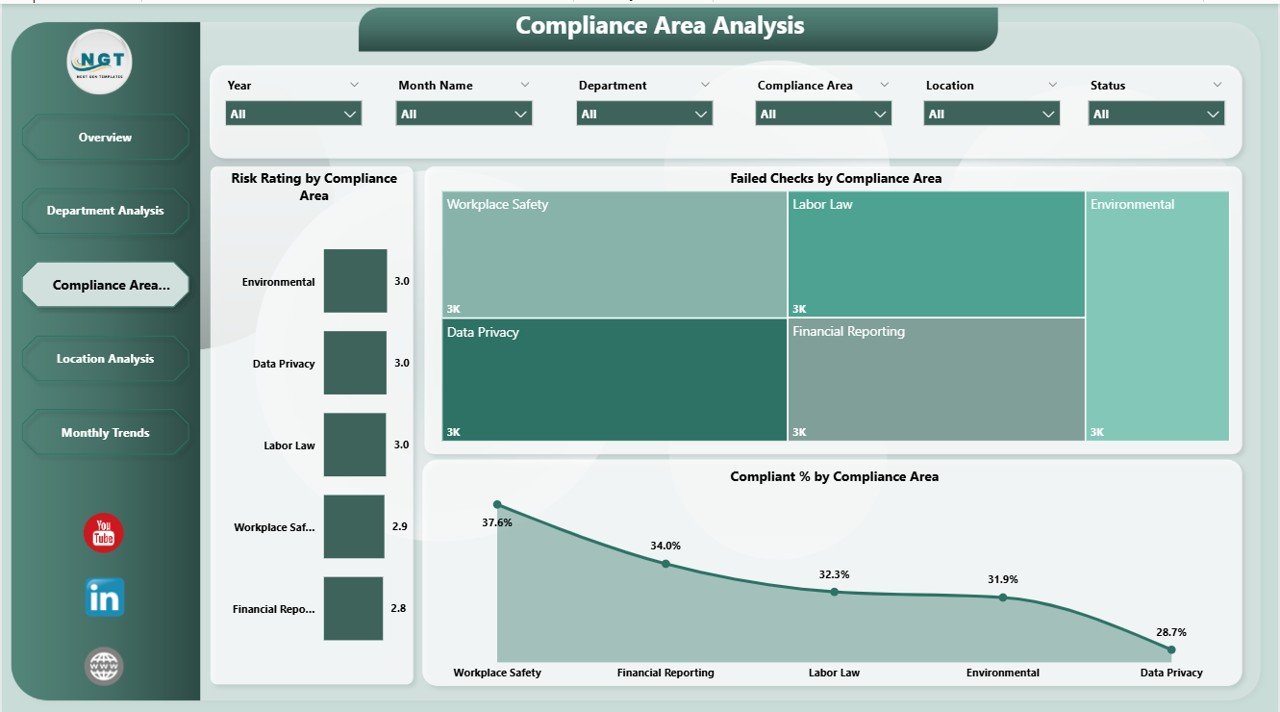
✅ 🔐 Compliance Area Analysis – Monitor Failed Checks, Risk Ratings, and Compliant % across specific audit or control areas like security, finance, or safety.
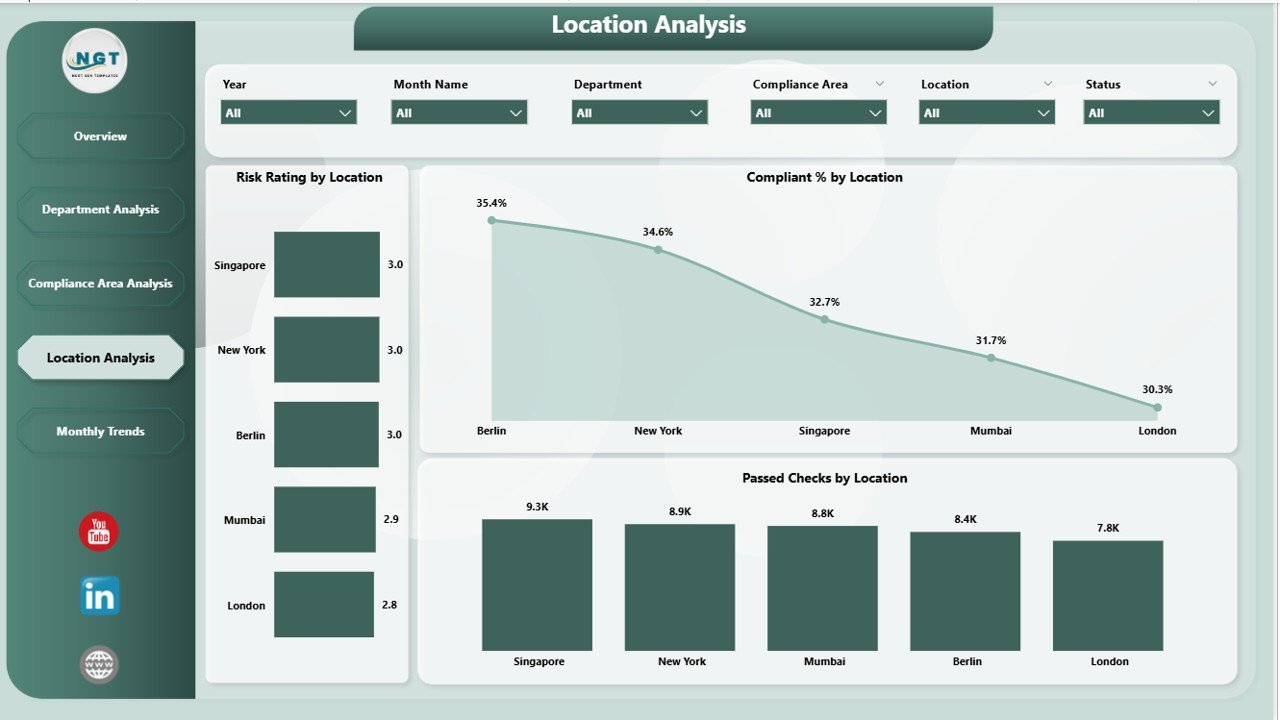
✅ 🌍 Location Analysis – Benchmark branches with Compliant %, Risk Rating, and Passed Checks by Region to pinpoint strong and weak locations.
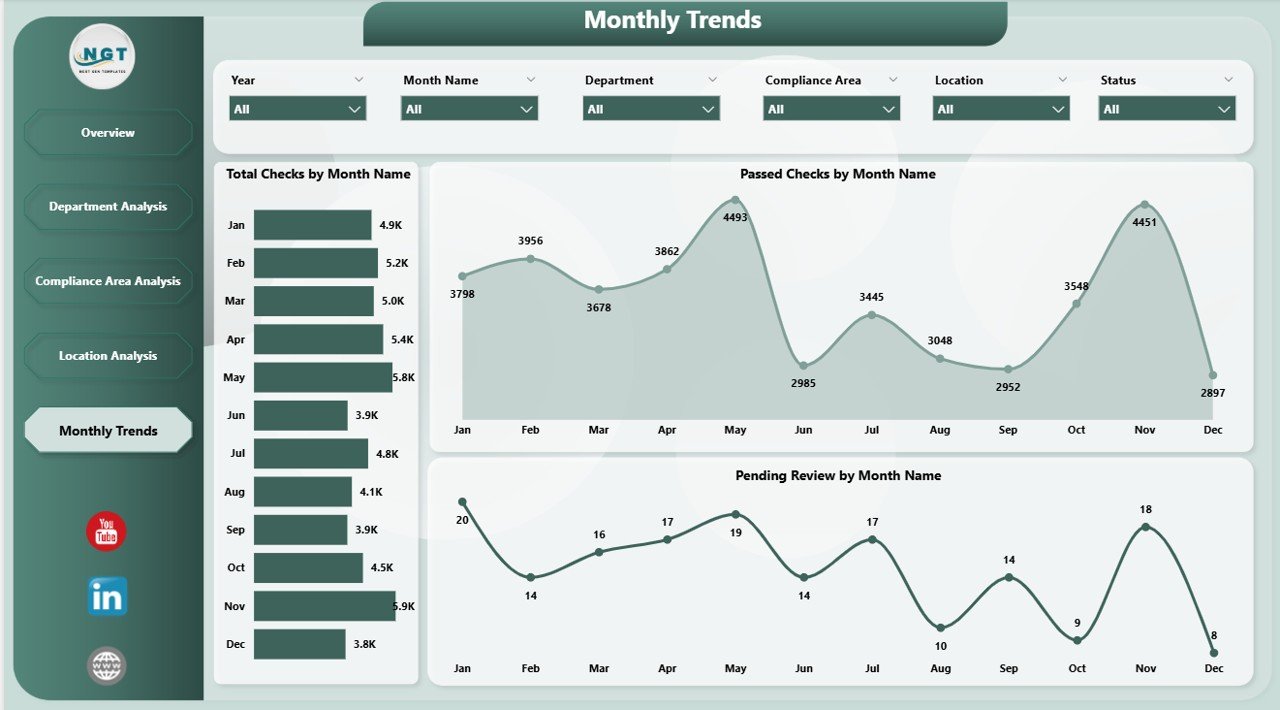
✅ 📈 Monthly Trends Page – Visualize Total Checks by Month to identify recurring compliance gaps and improvement over time.
✅ 📑 Excel-Connected Source – Powered by an Excel dataset, so data refreshes automatically when new audit entries are added.
✅ ⚙️ Customizable & Scalable – Add your own KPIs, departments, or filters with ease. Perfect for organizations of any size.
✅ 🔔 Risk Alerts & Conditional Formatting – Instantly highlight departments or areas that need urgent attention.
✅ 🧩 Real-Time Interactivity – Use slicers and filters to drill down by department, location, or compliance category for deeper insights.
💼 What’s Inside the Compliance Dashboard in Power BI
Here’s everything included in this professional dashboard package:
📁 Overview Page – Your main control panel showing key compliance metrics, charts, and KPI cards.
📁 Department Analysis Page – Compare performance across different business units.
📁 Compliance Area Analysis Page – Dive deep into functional areas like finance, data security, or environmental standards.
📁 Location Analysis Page – Review branch-wise results and benchmark compliance performance.
📁 Monthly Trends Page – Track monthly compliance activity and risk variation.
All visuals are fully dynamic and interactive, updating automatically whenever your Excel data source changes — meaning no more manual report preparation.
🧠 How to Use the Compliance Dashboard in Power BI
1️⃣ Prepare Your Data: Collect audit results, review statuses, and risk ratings in Excel.
2️⃣ Load into Power BI: Import your dataset using Power Query.
3️⃣ Refresh & Review: Watch the dashboard auto-update with current data.
4️⃣ Use Slicers: Filter by month, department, or compliance area.
5️⃣ Drill-Through: Click on visuals to analyze detailed insights.
6️⃣ Share Reports: Publish via Power BI Service for web and mobile viewing.
No coding required — just plug in your Excel file and start analyzing!
👩💼 Who Can Benefit from This Compliance Dashboard
🏦 Compliance Officers: Get real-time visibility into compliance status and risks.
🏢 Department Heads: Monitor team-level compliance and pending reviews.
📊 Internal Auditors: Identify failed checks and audit trends instantly.
💡 Executives & Directors: Gain clarity on enterprise-wide risk exposure.
🏭 Regulated Industries: Perfect for banking, healthcare, manufacturing, education, and more.
If you’re serious about building a culture of transparency and accountability, this dashboard is your go-to solution.
🔗 Click here to read the Detailed blog post
📺 Visit our YouTube channel to learn step-by-step video tutorials
👉 YouTube.com/@PKAnExcelExpert


Reviews
There are no reviews yet.