

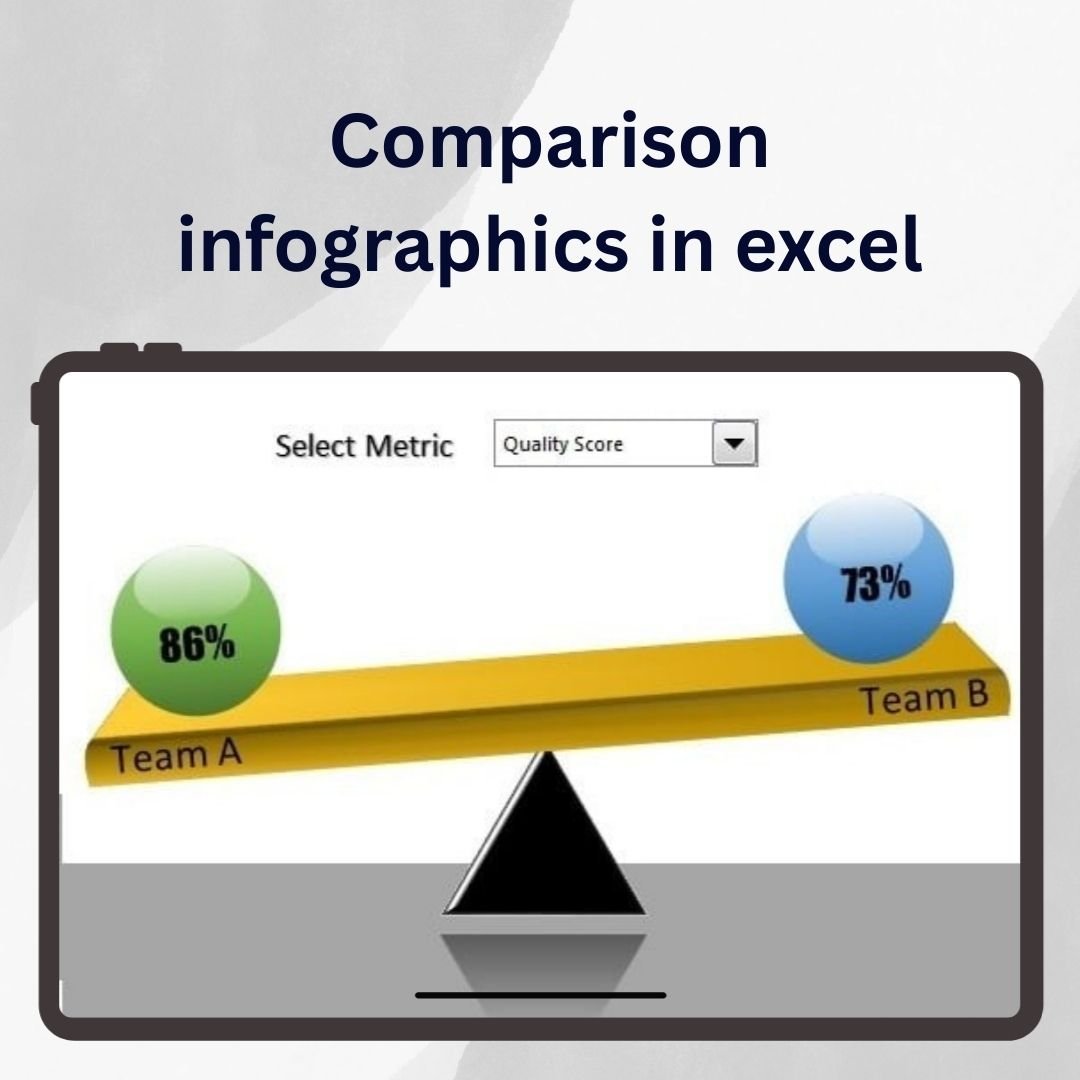

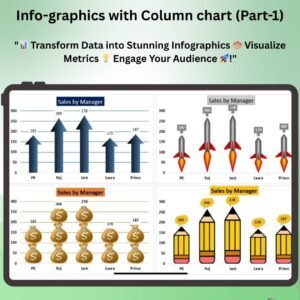
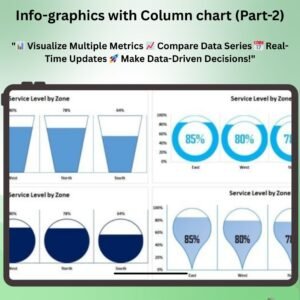
The Comparison Infographics in Excel is an innovative and dynamic tool designed to help you visualize and compare data using visually appealing infographics. This Excel template enables you to create stunning visual comparisons of multiple data sets, making it easier to communicate trends, differences, and key insights at a glance. Whether you’re comparing product features, sales performance, market trends, or other business metrics, this template transforms raw data into compelling visual infographics that grab attention and drive understanding.
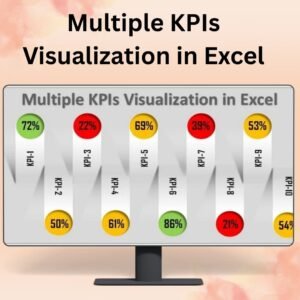
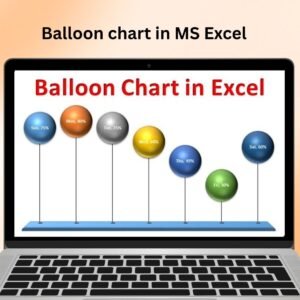
With the Comparison Infographics in Excel, you can present your data in a variety of engaging and interactive formats, including bar charts, pie charts, progress indicators, and other infographic-style visuals. The easy-to-use template is fully customizable, allowing you to adjust the design, colors, and data fields to suit your specific needs, making it an ideal solution for business presentations, reports, marketing materials, and more.
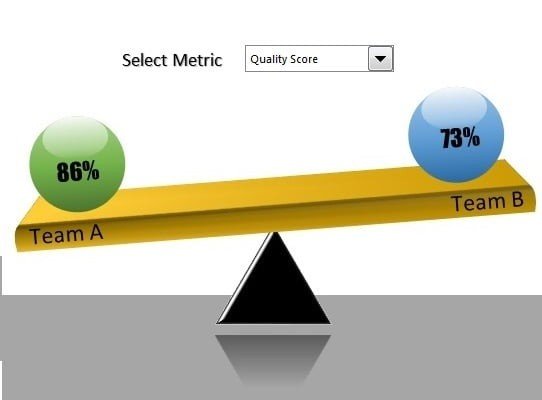
Key Features of the Comparison Infographics in Excel
📊 Dynamic Data Visualization
Transform complex data into easy-to-understand infographics. Visualize comparisons, trends, and data relationships with a range of customizable charts and graphs.
🎨 Fully Customizable Design
Adjust colors, fonts, and chart types to match your branding or preferences. The flexible design options ensure that the infographics fit seamlessly into your reports or presentations.
📈 Easy-to-Use Template
No advanced Excel skills are required. With simple drag-and-drop functionality, you can input your data and have it instantly displayed in infographic-style visuals.
📊 Multiple Comparison Formats
Choose from a variety of chart types, such as bar charts, line graphs, pie charts, and progress indicators, to present your data in the most effective and visually appealing way.
🔄 Real-Time Data Updates
The infographics automatically update as you input new data, ensuring that your visuals are always current and reflective of the latest trends or performance metrics.
🖥️ Interactive & Engaging Layout
The dashboard includes interactive elements, allowing you to explore your data, filter information, and drill down into specific comparisons for deeper analysis.
Why You’ll Love the Comparison Infographics in Excel
✅ Easily Compare Multiple Data Sets
Visually compare different products, sales figures, customer data, and more. Make better-informed decisions based on clear, concise visual representations of your data.
✅ Improve Data Presentation
Present your data in an engaging way that’s easy to understand. Instead of plain numbers and text, use dynamic infographics that make your data visually compelling and easier to digest.
✅ Fully Customizable and Flexible
Adapt the template to your needs. Whether you’re working on a business presentation, marketing report, or financial analysis, you can easily adjust the design and data fields to meet your goals.
✅ Save Time & Improve Productivity
Instead of creating infographics from scratch, use this ready-made template to save time. Simply input your data, and the template will automatically generate professional-quality visuals.
✅ Enhance Decision-Making
Data-driven decisions are crucial for success. Use these infographics to quickly compare different data points, spot trends, and make more informed business decisions.
What’s Inside the Comparison Infographics in Excel Template?
- Dynamic Infographics Templates: A variety of customizable infographic-style templates for presenting data comparisons.
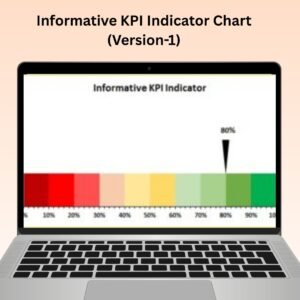
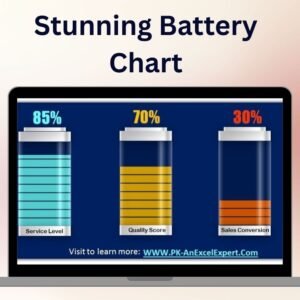
- Multiple Chart Types: Bar charts, pie charts, line graphs, progress bars, and other visual elements to display your comparisons.
- Real-Time Data Integration: Automatically updated visuals based on new data input.
- Easy-to-Use Dashboard: Drag-and-drop functionality and simple data entry ensure a smooth user experience.
- Fully Customizable Design: Adjust the color scheme, fonts, and layout to match your branding or preferences.
How to Use the Comparison Infographics in Excel
1️⃣ Download the Template: Get instant access to the Comparison Infographics in Excel template.
2️⃣ Input Your Data: Enter your data into the template’s fields to populate the infographics automatically.
3️⃣ Customize the Design: Adjust the layout, colors, and chart types to suit your presentation or report needs.
4️⃣ Present & Share: Use the dynamic and visually appealing infographics to communicate data comparisons in your presentations, reports, or marketing materials.
Who Can Benefit from the Comparison Infographics in Excel?
🔹 Business Owners & Entrepreneurs
🔹 Marketing & Sales Teams
🔹 Data Analysts & Financial Analysts
🔹 Project Managers & Team Leaders
🔹 Content Creators & Presenters
🔹 Anyone Looking to Present Data Visually & Improve Communication
Enhance your business presentations and reports with the Comparison Infographics in Excel. Turn raw data into visually striking comparisons that are easy to interpret and engage your audience.
Click here to read the Detailed blog post
Visit our YouTube channel to learn step-by-step video tutorials
Youtube.com/@PKAnExcelExpert
Watch the step-by-step video tutorial:
Compatibility and Requirements
- Works in Microsoft Excel desktop (Excel 2016 or later, or Microsoft 365).
- The charts are standard Excel charts. Microsoft’s guide to creating a chart explains how to edit them.
Frequently Asked Questions
Which chart types are in the Comparison Infographics template?
Bar charts, pie charts, line graphs, progress bars and other infographic-style visuals for comparing data sets.
Do the infographics update when I change the data?
Yes. Enter new values in the data fields and the visuals update automatically.
Can I change the colors, fonts and layout?
Yes. You can adjust the color scheme, fonts, chart types and layout to match your branding.
Do I need advanced Excel skills?
No. You type your data into the template fields and the infographics fill in on their own.
Where can I use these comparison infographics?
In business presentations, reports and marketing materials, for example to compare products, sales figures or customer data.
Related Chart Templates
- Dynamic Comparison Analysis Chart in Excel: another way to compare values in one chart.
- Dynamic Comparison in Butterfly Chart: compare two data sets side by side.
- Sales funnel infographic chart in Excel: an infographic for funnel stages.
- Info-graphics: Stunning Thermometer Chart in Excel: show progress toward a target.
- Data Analyst’s Chart & Visualization Pack: 10 chart templates for Excel and Google Sheets in one bundle.
Browse all Excel chart and visualization templates or the Excel dashboards.









Reviews
There are no reviews yet.