


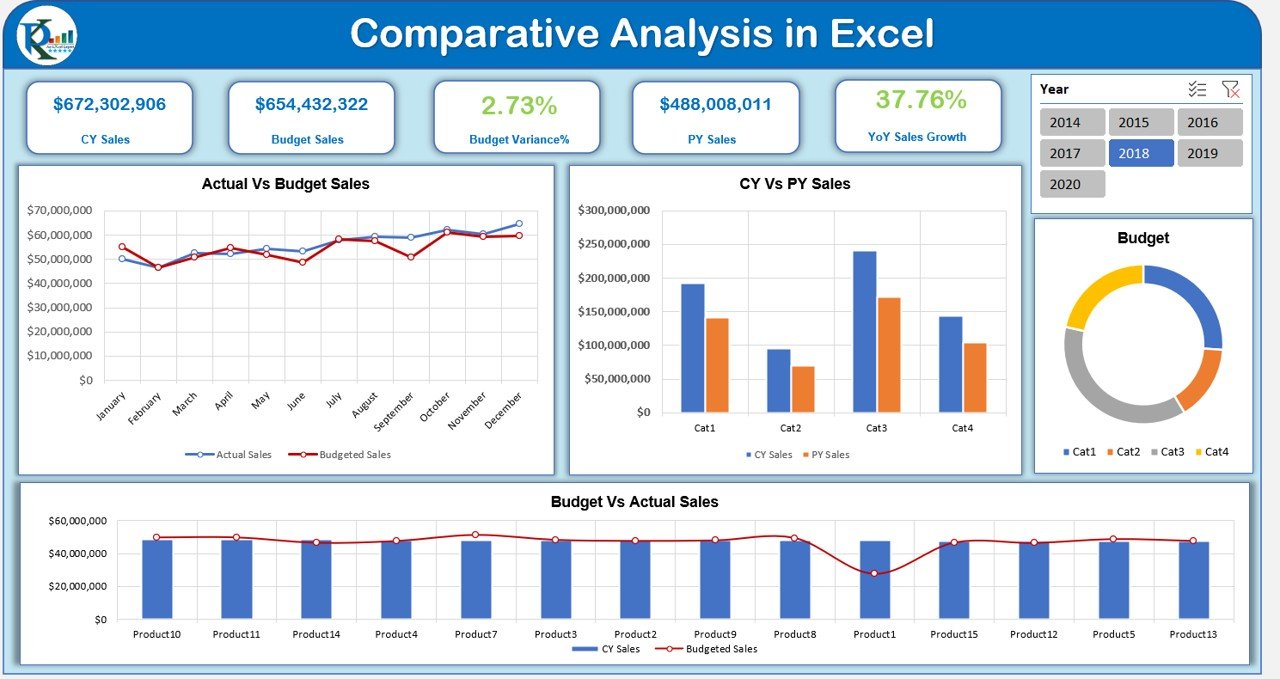
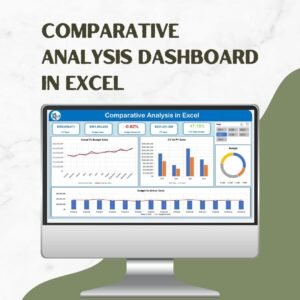
In today’s data-driven world, businesses need a reliable tool to compare sales performance, track budget variances, and analyze key financial metrics effectively. The Comparative Analysis Dashboard in Excel provides an advanced, interactive solution that enables decision-makers to assess their sales and budget performance in real time. This powerful dashboard leverages dynamic data models, variance tracking, and DAX-powered calculations, allowing businesses to gain valuable insights into their financial health.
Key Features & Benefits
1. Dynamic Data Model Integration
This dashboard is built on a robust data model that integrates information from three key Excel tables:
- Budget Table – Stores planned revenue figures for each product and period.
- Product Master Table – Maintains product details, including categories and pricing.
- Sales Table – Captures actual sales figures, allowing for an accurate performance comparison.
With these interconnected datasets, users can seamlessly analyze trends, ensuring a holistic view of business performance.
2. Sales and Budget Variance Tracking
One of the most critical aspects of financial management is understanding variance—the difference between actual performance and planned targets. This dashboard provides clear visualizations and KPI indicators to highlight:
- Positive variances (when sales exceed the budget).
- Negative variances (when sales fall short of the target).
- Percentage deviation from planned figures.
This feature allows managers to proactively address revenue gaps and optimize sales strategies accordingly.
3. Advanced DAX Measures for Insightful Analysis
The dashboard incorporates calculated measures using DAX (Data Analysis Expressions) to drive advanced analytics, including:
- Year-over-Year (YoY) Growth Rates – Compare performance across different time periods.
- Sales Performance by Category/Product – Identify top-performing and underperforming products.
- Budget Adherence Ratio – Measure how closely actual sales align with the budget.
With these metrics, users can assess profitability, identify trends, and make data-driven decisions.
4. Interactive Visuals & Filters
The Comparative Analysis Dashboard features an interactive user interface with:
- Slicers and dropdown filters to drill down by region, product category, and time period.
- Dynamic charts displaying budget vs. actual sales performance.
- Conditional formatting to highlight areas needing attention.
These interactive elements enhance usability and make insights easily accessible.
5. Automated Reporting & Business Intelligence
This Excel dashboard minimizes manual reporting tasks by:
- Automatically updating data with refreshed inputs.
- Generating real-time reports based on the latest sales and budget data.
- Providing executive-level insights in an easy-to-read format.
The automated workflow ensures accuracy while significantly reducing time spent on data analysis.
Who Can Benefit from This Dashboard?
The Comparative Analysis Dashboard in Excel is ideal for: ✅ Business Owners & Managers – To track sales and budget compliance effectively.
✅ Finance & Accounting Teams – To monitor revenue trends and plan financial strategies.
✅ Sales Teams & Analysts – To evaluate product performance and optimize selling strategies.
Why Choose This Dashboard?
- No complex formulas required – Uses DAX-powered automation for precision.
- Customizable – Adapt it to your organization’s specific reporting needs.
- Visually intuitive – Graphical variance tracking and trend analysis in one place.
Conclusion
The Comparative Analysis Dashboard in Excel provides a data-driven approach to financial and sales performance analysis. Whether you’re tracking budget adherence, sales trends, or category-wise performance, this dashboard delivers actionable insights in a user-friendly format. With dynamic data models, advanced variance tracking, and interactive visuals, businesses can enhance financial decision-making, improve sales performance, and drive sustainable growth.
Click here to read the detailed blog post
Watch the step-by-step video tutorial:
Also check our Inventory Management Form in Excel


Reviews
There are no reviews yet.