Managing a thriving online or offline community requires more than just interaction—it demands insight. With the Community Management KPI Dashboard in Power BI, you can track engagement, monitor satisfaction, and optimize response times like a pro—all in real-time and in one place.
This plug-and-play dashboard integrates seamlessly with Excel to provide actionable, visual insights that empower you to improve performance, make smarter decisions, and showcase impact to stakeholders.
💡 Key Features of Community Management KPI Dashboard in Power BI
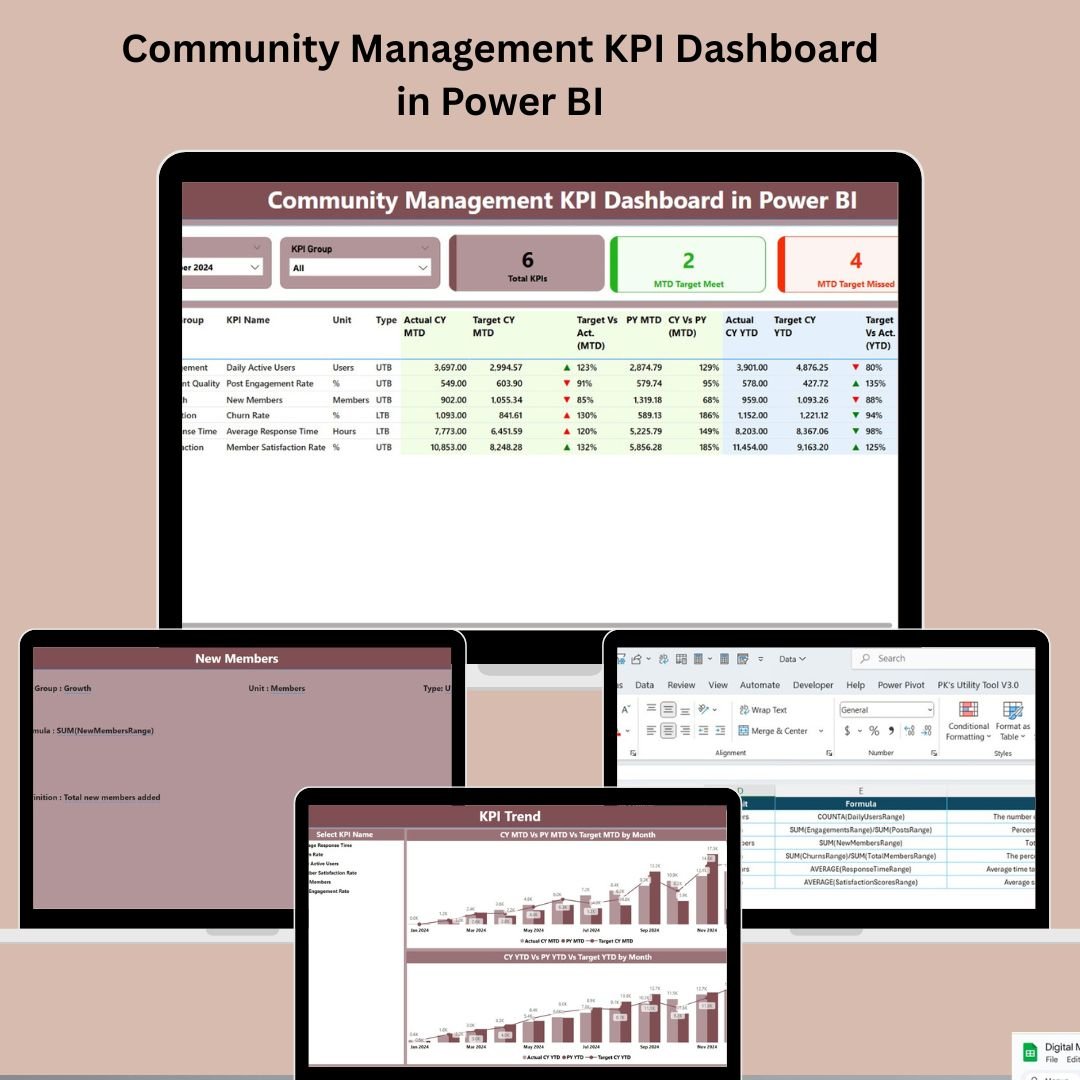
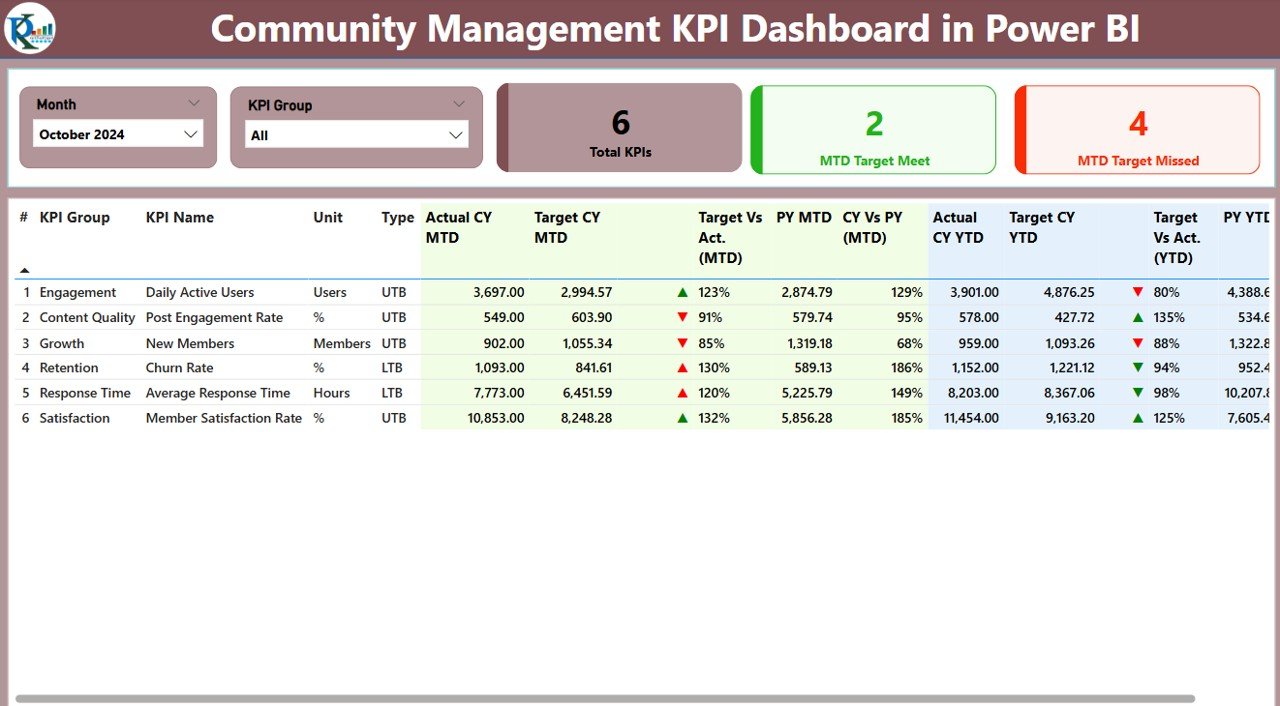
📊 Summary Page – Instant Performance Snapshot
-
Month & KPI Group Slicers – Filter your view with a single click
-
Summary Cards – Get totals for:
-
✅ Total KPIs
-
🎯 MTD Targets Met
-
❌ MTD Targets Missed
-
-
Interactive KPI Table showing:
-
KPI Group & Name
-
Unit, Type (LTB/UTB)
-
MTD & YTD Actuals, Targets, Previous Year Comparisons
-
🔴/🟢 Icons for performance status
-
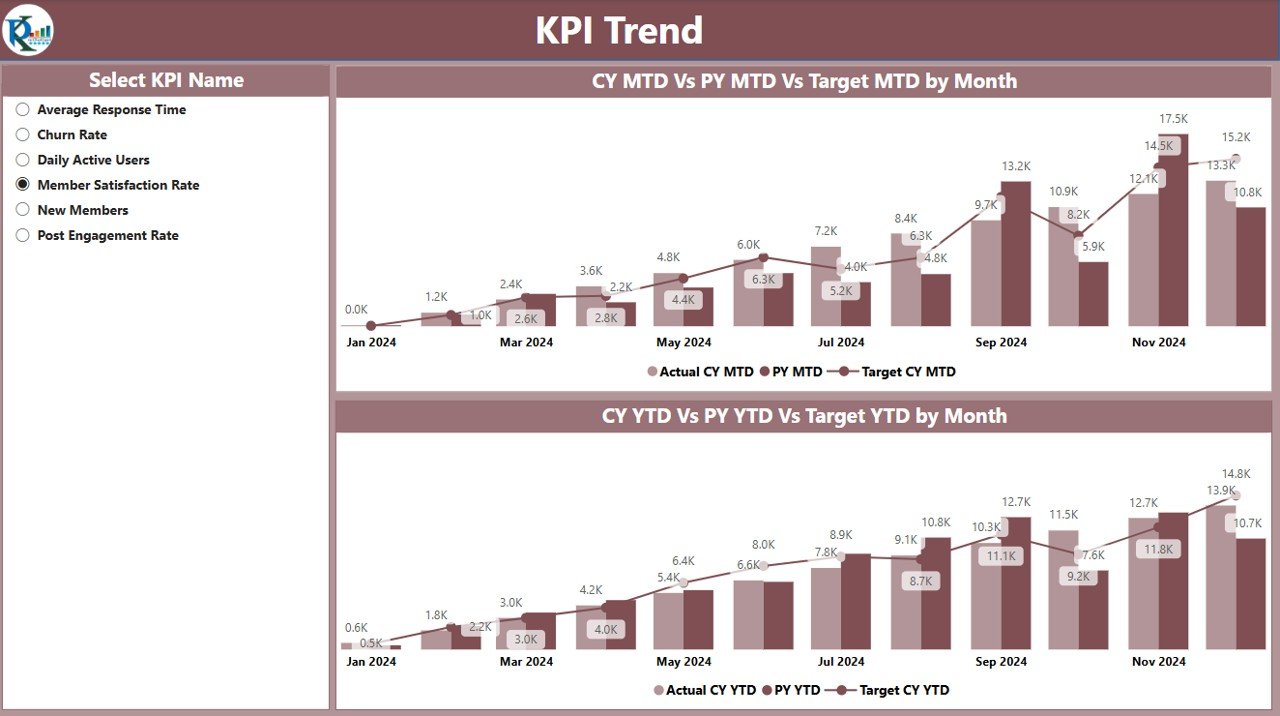
📈 KPI Trend Page – Visualize Performance Over Time
-
Two powerful combo charts:
-
📅 MTD Trend – Monthly performance with target comparisons
-
📆 YTD Trend – Yearly progress with PY insights
-
-
KPI Selector – Focus on any specific KPI for deep dive analysis
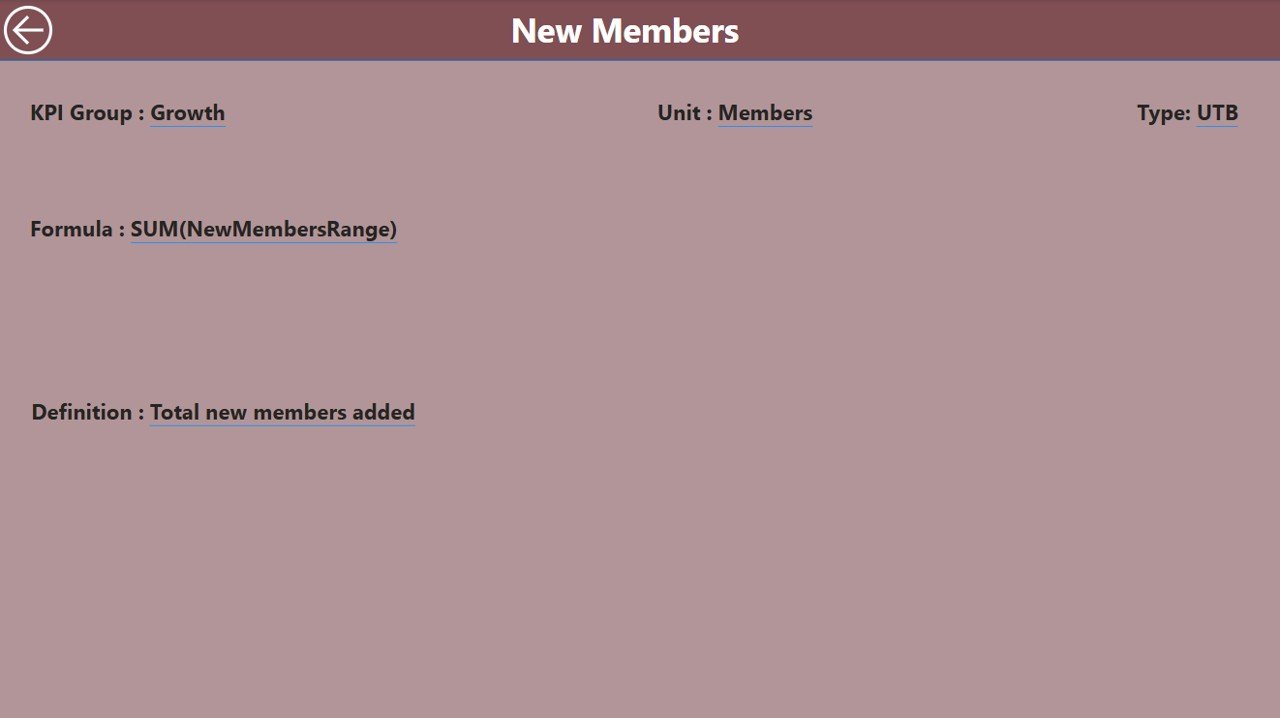
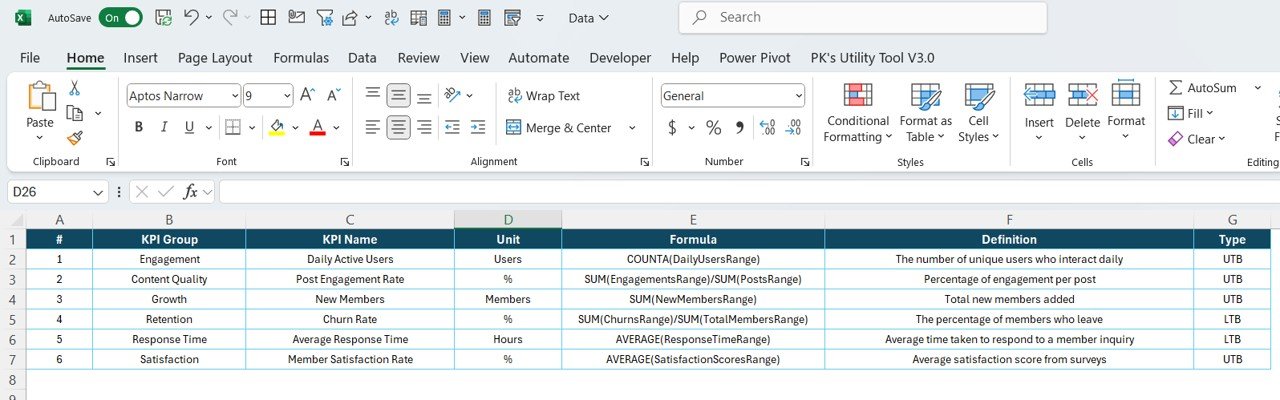
📄 KPI Definition Page – Understand Every Metric
-
Drill-through to view:
-
Formula
-
Description
-
Type (LTB or UTB)
-
-
Ensures clarity across teams with metric transparency
📦 What’s Inside the Dashboard Package?
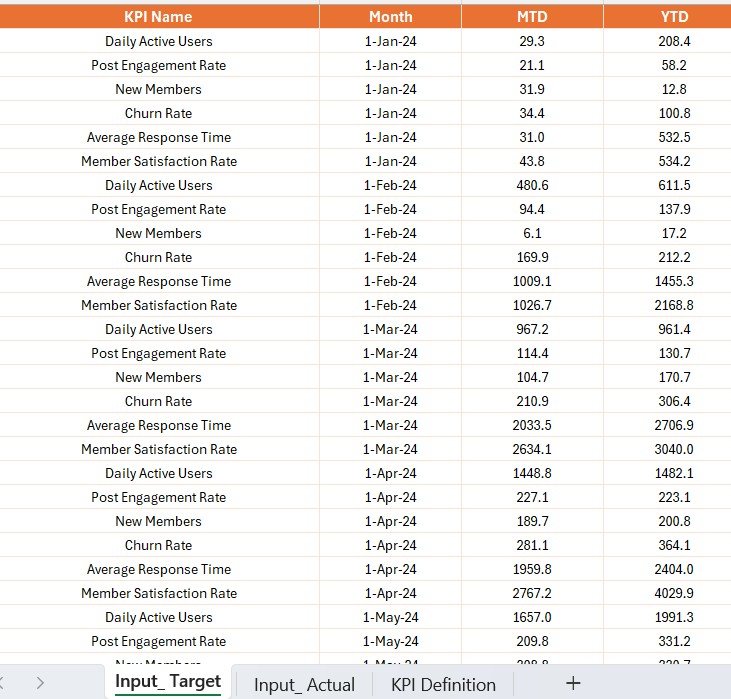
This Power BI dashboard works directly with your Excel dataset structured into:
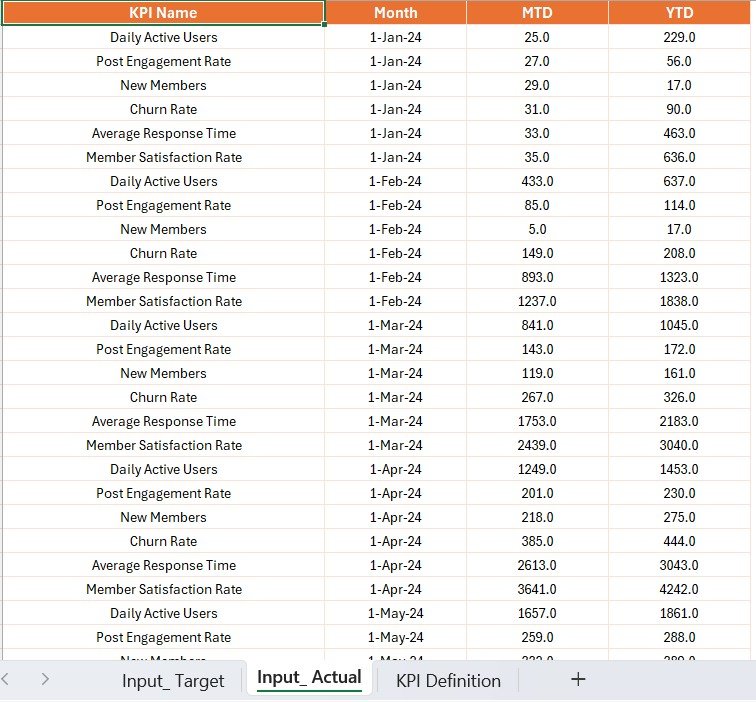
✅ Input_Actual Sheet – Real MTD/YTD values
✅ Input_Target Sheet – Monthly & yearly KPI goals
✅ KPI Definition Sheet – Formulas, units, and KPI types
With these, the dashboard becomes a live performance engine tailored to your community’s needs!
🛠️ How to Use the Product
-
📥 Download the Power BI file and the linked Excel template
-
📊 Populate the Input_Actual and Input_Target sheets
-
🧾 Define your KPIs in the KPI Definition sheet
-
🚀 Load the Excel file into Power BI
-
🧠 Use filters and slicers to analyze performance instantly
-
📈 Track KPI trends, review summaries, and share insights!
No complex setup. Just clean data, smart visuals, and impactful results.
👥 Who Can Benefit from This Product?
💬 Community Managers – Monitor engagement, support metrics & satisfaction
🧑💻 Forum & Group Admins – Improve moderation, resolve issues faster
📈 Social Media Teams – Track community sentiment & interaction
📢 Customer Success Teams – Support feedback loops within product communities
🏢 Nonprofits & Associations – Ensure membership engagement
🧩 HR/Internal Communities – Foster better employee connection & responsiveness
🧪 Product Teams – Analyze feedback-driven communities for roadmap planning
This dashboard is for anyone managing a community and craving clarity from the chaos of scattered metrics.
🔗 Click here to read the Detailed blog post
🎥 Visit our YouTube channel to learn step-by-step video tutorials
👉 YouTube.com/@PKAnExcelExpert


Reviews
There are no reviews yet.