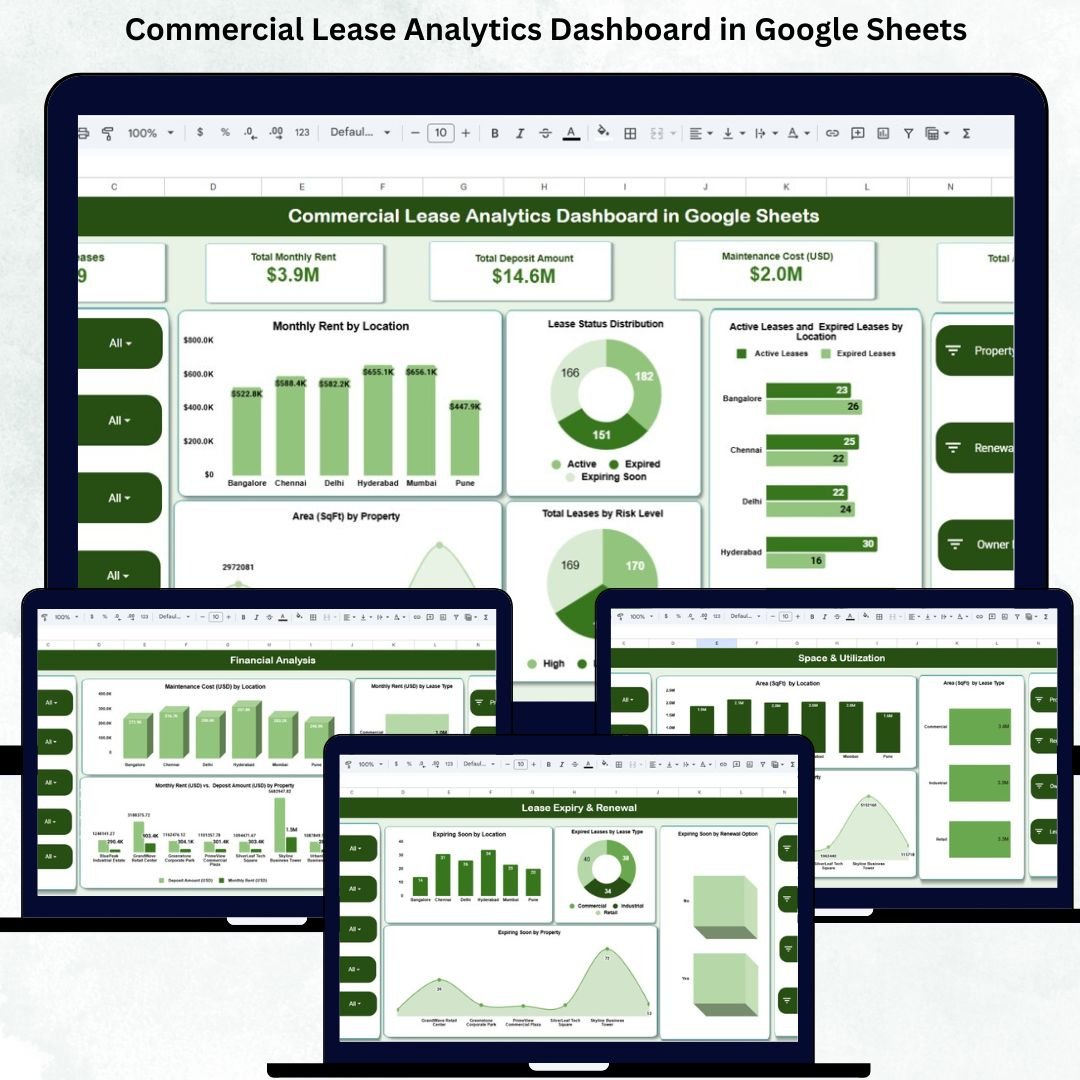
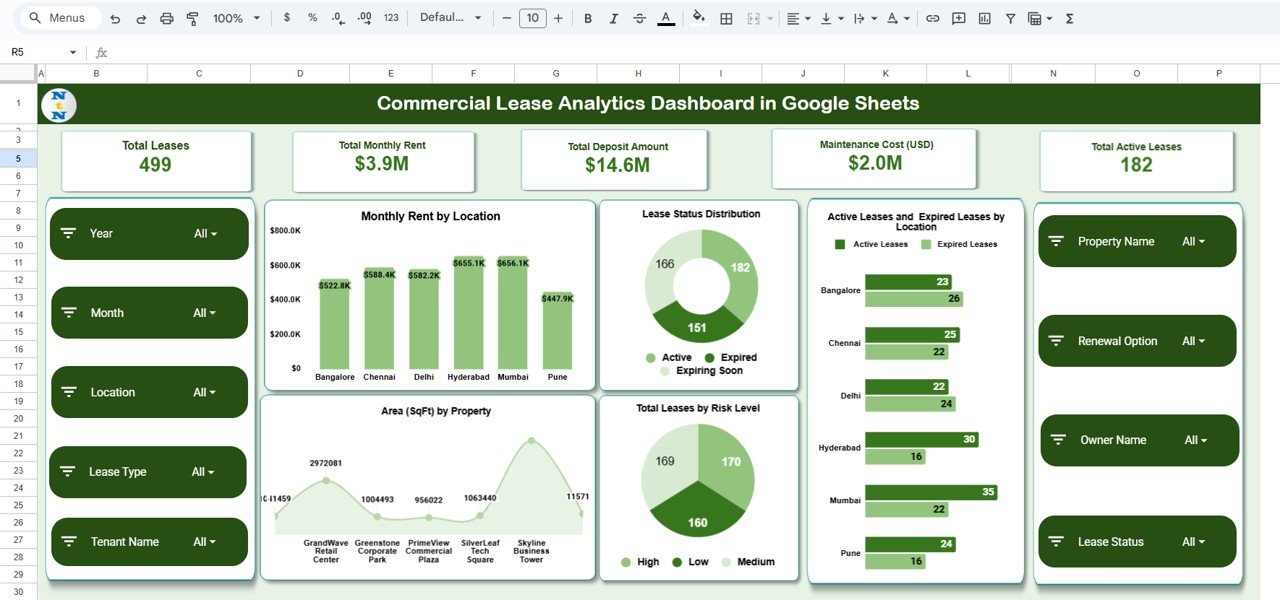
Managing commercial leases becomes increasingly difficult when organizations handle multiple properties, varying lease types, different rent amounts, and renewal timelines. Tracking expiry dates, rent escalations, risk levels, maintenance costs, and space utilization manually can lead to errors and missed deadlines. The Commercial Lease Analytics Dashboard in Google Sheets solves these challenges by offering a centralized, automated, and professional way to manage commercial leases across all locations.Commercial Lease Analytics Dashboard in Google Sheets
This ready-to-use Google Sheets dashboard turns complex lease data into clear insights. Whether you’re managing office spaces, retail stores, warehouses, or commercial properties, this dashboard gives you complete visibility into financial performance, lease status, risk levels, and upcoming renewals. With real-time charts, KPI cards, and structured analytics, it empowers facility teams, finance departments, and real estate managers with the data they need to make smarter property decisions.
✨ Key Features of the Commercial Lease Analytics Dashboard in Google Sheets
📊 1. Complete Lease Visibility
View all key metrics at a glance, including total leases, monthly rent, deposit amount, active leases, expired leases, and maintenance costs. This helps teams understand the health of their lease portfolio instantly.Commercial Lease Analytics Dashboard in Google Sheets
📈 2. Automated Financial Insights
Track monthly rent distribution, deposit levels, maintenance cost patterns, and rent-to-deposit ratios. Financial teams gain valuable insights for budgeting, forecasting, and cost optimization.Commercial Lease Analytics Dashboard in Google Sheets
🏢 3. Location, Property & Lease Type Comparisons
Analyze leases across multiple locations, lease types (office, warehouse, retail), and property sizes. Identify which areas demand higher rent, incur more maintenance, or require strategic review.
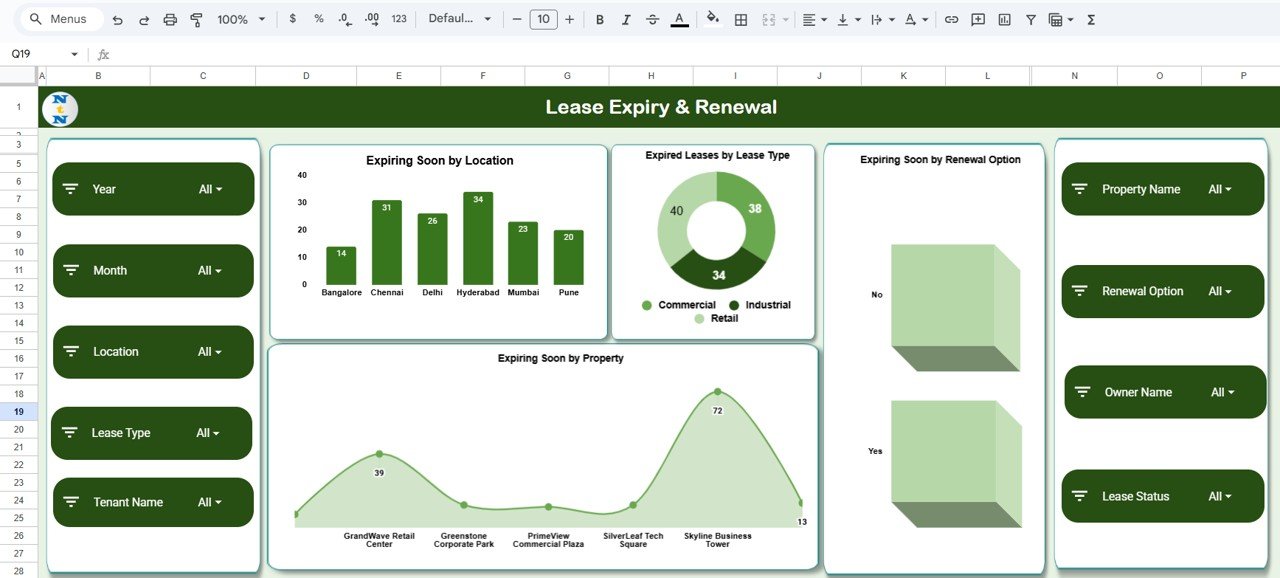
⏳ 4. Renewal & Expiry Monitoring
Stay ahead of expiring leases with automated charts showing:
-
Upcoming renewals
-
Expiring soon leases
-
Expired leases by lease type
-
Expiring leases by renewal option
This prevents penalties, downtime, and sudden relocations.
📦 What’s Inside the Commercial Lease Analytics Dashboard in Google Sheets
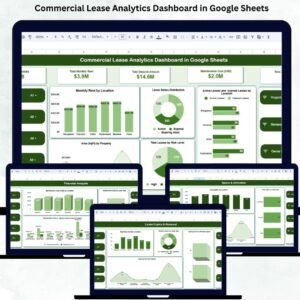
📍 1. Overview Sheet – Central Dashboard
This section includes all high-level KPIs such as:
-
Total Leases
-
Total Monthly Rent
-
Total Deposit Amount
-
Maintenance Cost (USD)
-
Total Active Leases
Charts include:
-
Monthly Rent by Location
-
Lease Status Distribution
-
Active vs Expired by Location
-
Total Leases by Risk Level
-
Area (SqFt) by Property
The Overview Sheet provides a complete snapshot of portfolio performance.
⏰ 2. Lease Expiry & Renewal Analysis
This section focuses on time-sensitive insights. Charts include:
-
Expiring Soon by Location
-
Expired Leases by Lease Type
-
Expiring Soon by Renewal Option
-
Expiring Soon by Property
This helps property managers focus on urgent renewals, negotiation opportunities, and expiring leases needing immediate attention.
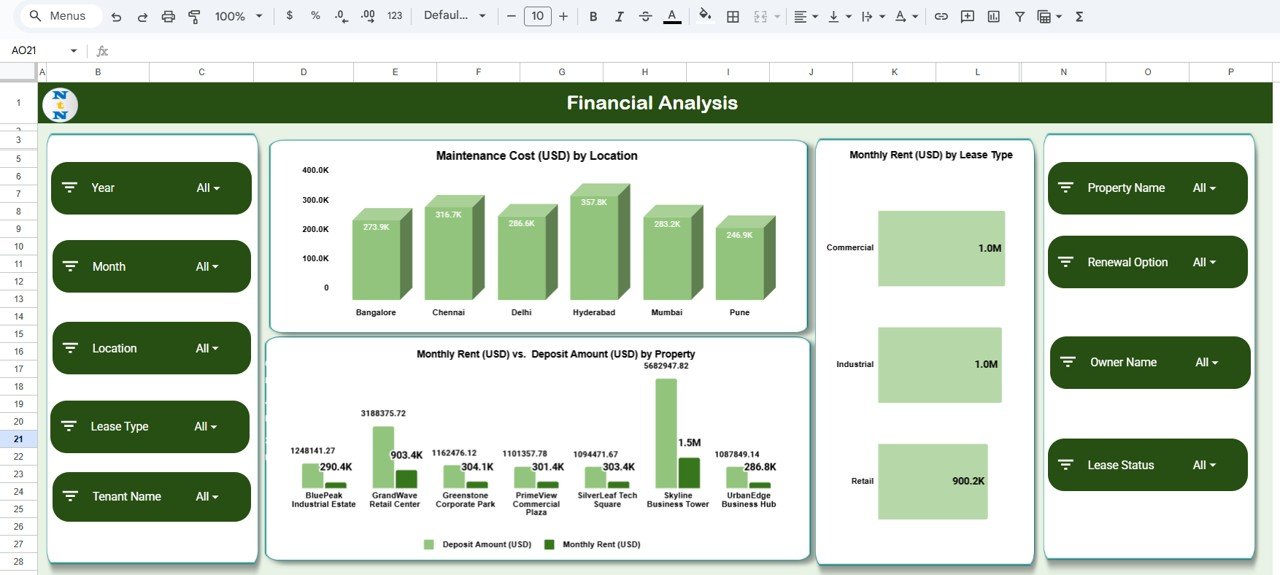
💰 3. Financial Analysis Sheet
Get deep visibility into financial KPIs such as:
-
Maintenance Cost by Location
-
Monthly Rent by Lease Type
-
Monthly Rent vs Deposit Amount by Property
These insights support finance teams in optimizing lease budgets and identifying high-cost properties.
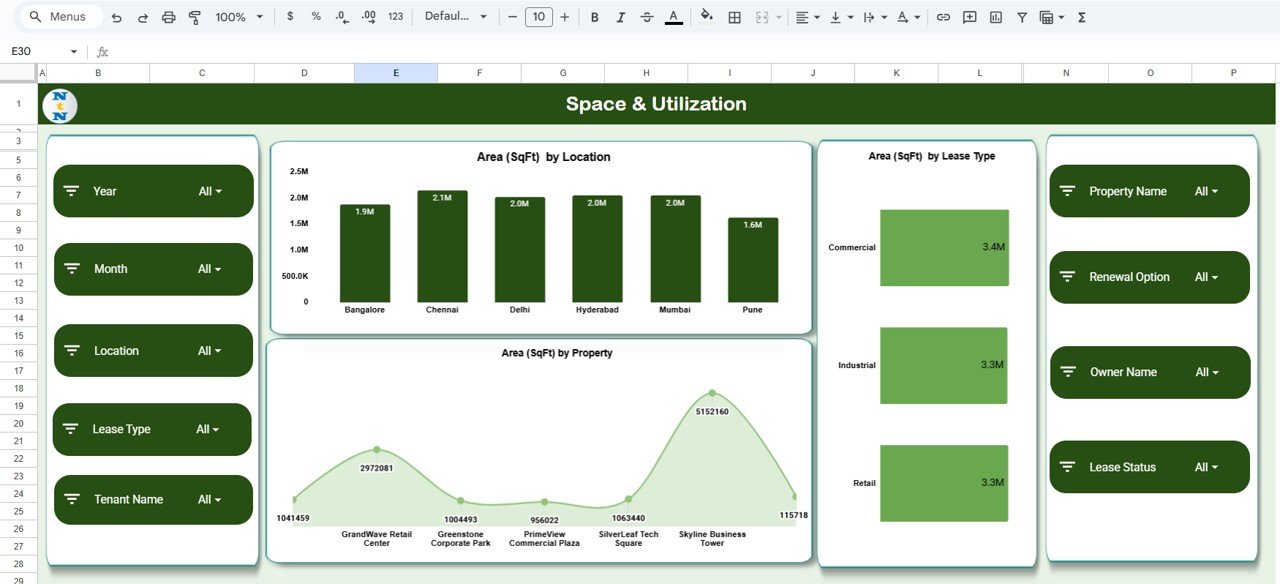
📐 4. Space & Utilization Analysis
Understand total leased space using charts like:
-
Area (SqFt) by Location
-
Area (SqFt) by Lease Type
-
Area (SqFt) by Property
This helps teams compare space utilization, avoid underutilized properties, and plan future space needs.
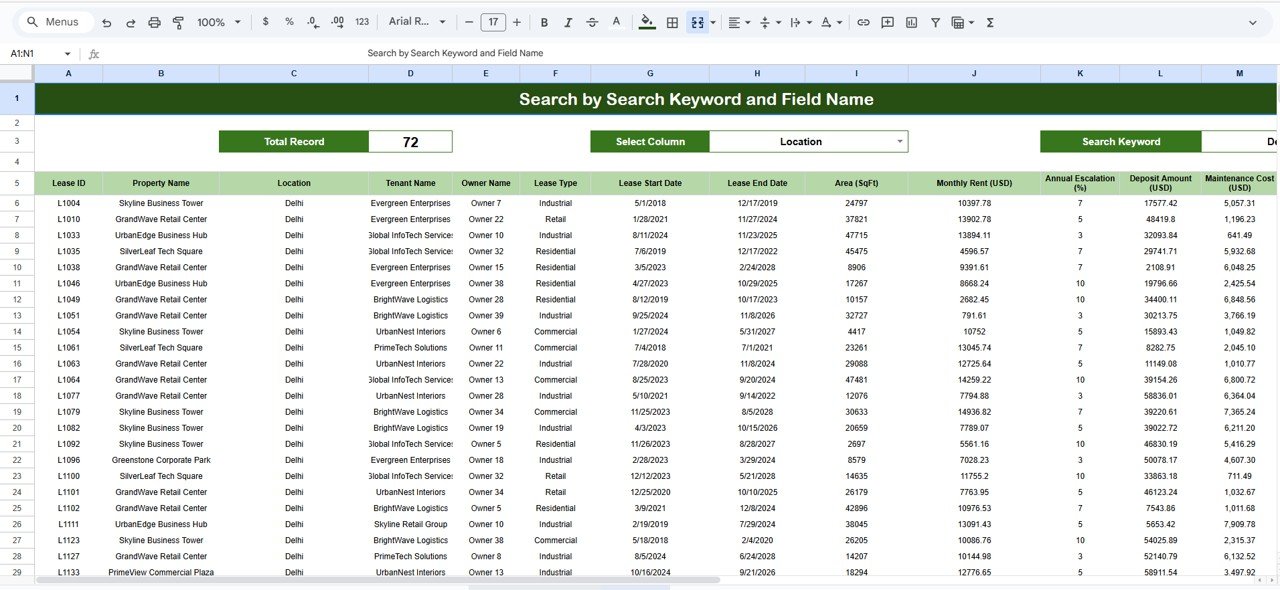
🔍 5. Search Sheet – Instant Record Finder
Simply search by keyword or choose from fields like:
-
Property Name
-
Lease Type
-
Location
-
Date
-
Status
-
Risk Level
This makes pulling up any lease record fast and effortless—ideal for audits and reviews.
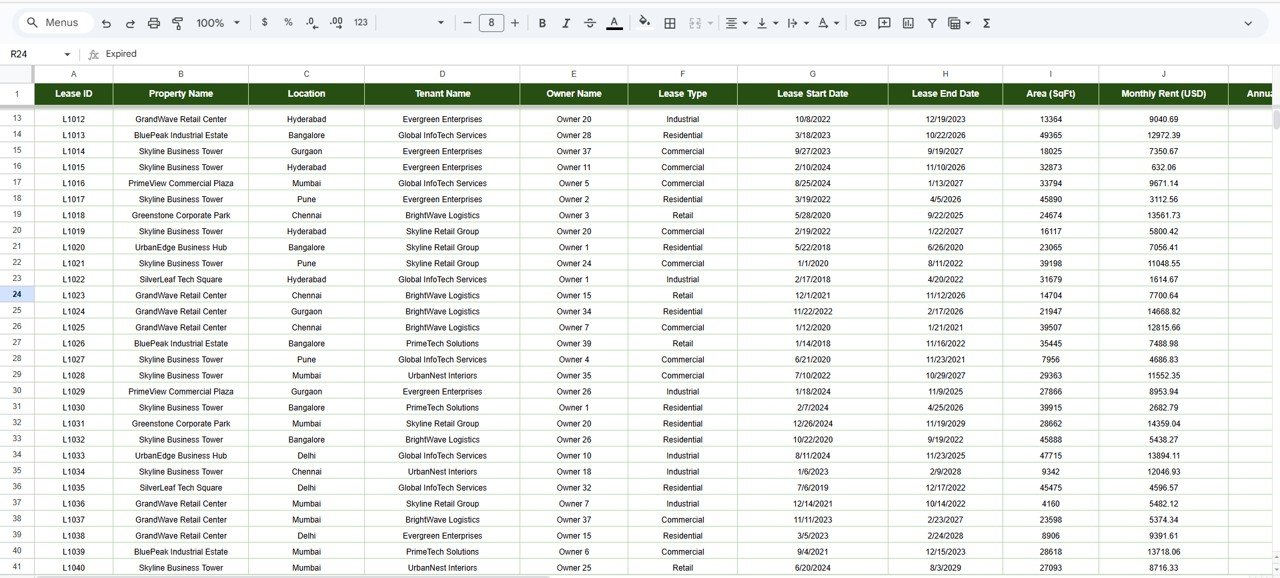
📄 6. Data Sheet – Core Lease Database
Includes all essential fields:
-
Lease ID
-
Property Name
-
Location
-
Lease Start & End Dates
-
Monthly Rent
-
Deposit Amount
-
Maintenance Cost
-
Lease Type
-
Area (SqFt)
-
Renewal Option
-
Risk Level
-
Status
-
Owner / Manager
All dashboard visuals update automatically based on this sheet.
🎯 Who Can Benefit from the Commercial Lease Analytics Dashboard in Google Sheets
🏢 Real Estate Teams
Monitor lease performance across multiple locations and lease types.
💼 Finance Departments
Analyze rent costs, deposits, and maintenance expenses.
👥 Facility & Admin Teams
Track property utilization, upcoming renewals, and risky leases.
📈 Senior Management
Make data-driven decisions about lease renewals, relocations, or expansions.
🌍 Multi-Location Organizations
Get unified lease visibility across branches.


Reviews
There are no reviews yet.