
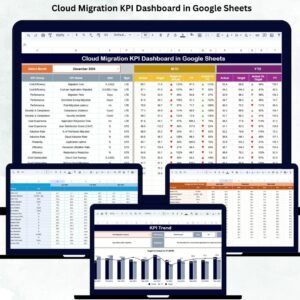
Cloud migration is no longer just an IT initiative—it is a business-critical transformation. Organizations migrate applications, databases, and infrastructure to the cloud to reduce costs, improve scalability, enhance security, and accelerate innovation. However, many cloud migration programs fail or exceed budgets because teams lack clear visibility into progress, performance, cost, risks, and outcomes. The Cloud Migration KPI Dashboard in Google Sheets is designed to solve exactly this challenge.
This ready-to-use dashboard gives organizations a centralized, structured, and real-time view of cloud migration performance. Instead of juggling multiple reports, spreadsheets, and tools, leaders and project teams can monitor migration status, timelines, costs, performance metrics, and risk indicators—all in one interactive dashboard. Because it is built in Google Sheets, it remains easy to use, fully collaborative, and accessible without complex cloud tools or coding.
🚀 Key Features of the Cloud Migration KPI Dashboard in Google Sheets
📊 Real-Time Migration Performance Tracking
Track how well your cloud migration is progressing using structured KPIs that measure schedule adherence, cost control, workload movement, security, and performance improvements.
📅 MTD & YTD KPI Comparison
Monitor both Month-to-Date (MTD) and Year-to-Date (YTD) performance with:
-
Actual values
-
Target values
-
Previous year benchmarks
-
Target vs Actual comparison
-
Previous Year vs Actual comparison
This ensures leadership always sees progress clearly.
✅ Visual Performance Indicators
Conditional formatting arrows help decision-makers instantly understand performance:
-
🟢 Green arrow → improvement
-
🔴 Red arrow → decline
No lengthy explanations required.
📈 KPI Trend Analysis
Analyze month-wise trends for each KPI to identify:
-
Migration delays
-
Cost overruns
-
Performance bottlenecks
-
Optimization opportunities
📦 What’s Inside the Cloud Migration KPI Dashboard in Google Sheets
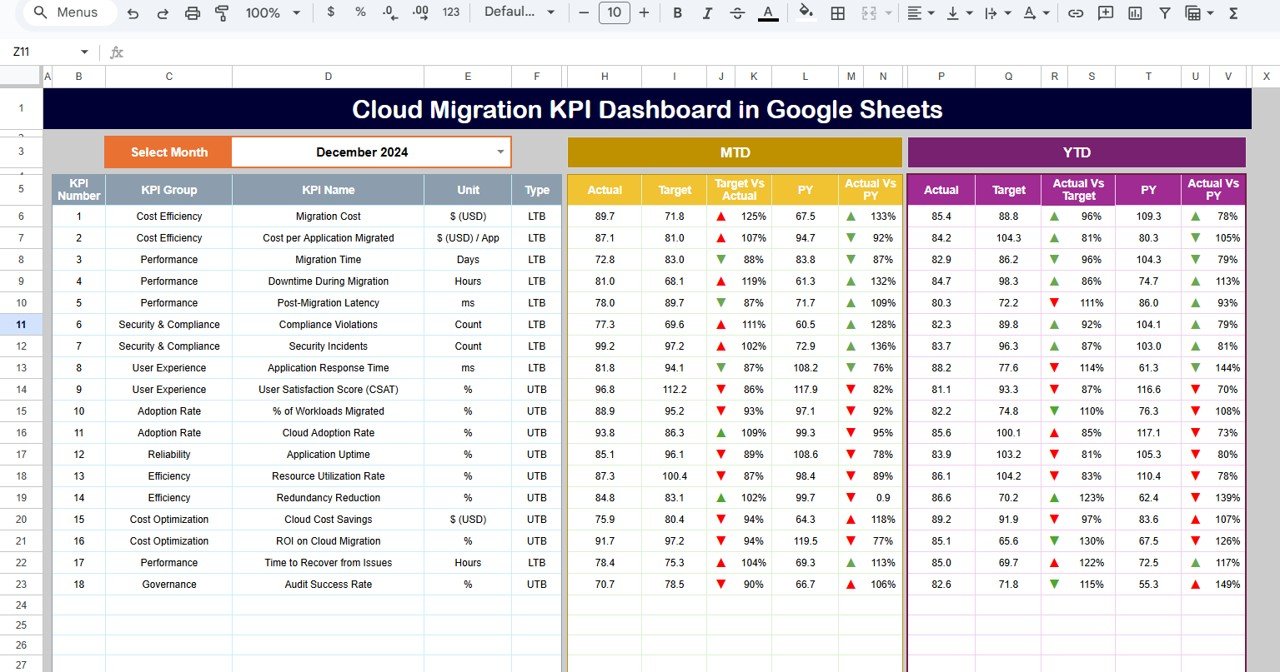
🖥️ Dashboard Sheet (Main Page)
This is the executive summary view.
When you select a month from cell D3, all KPIs update automatically.
It displays:
-
MTD Actual, Target, PY, and variances
-
YTD Actual, Target, PY, and variances
-
Clear visual indicators for leadership reviews
Perfect for steering committee meetings and project reviews.
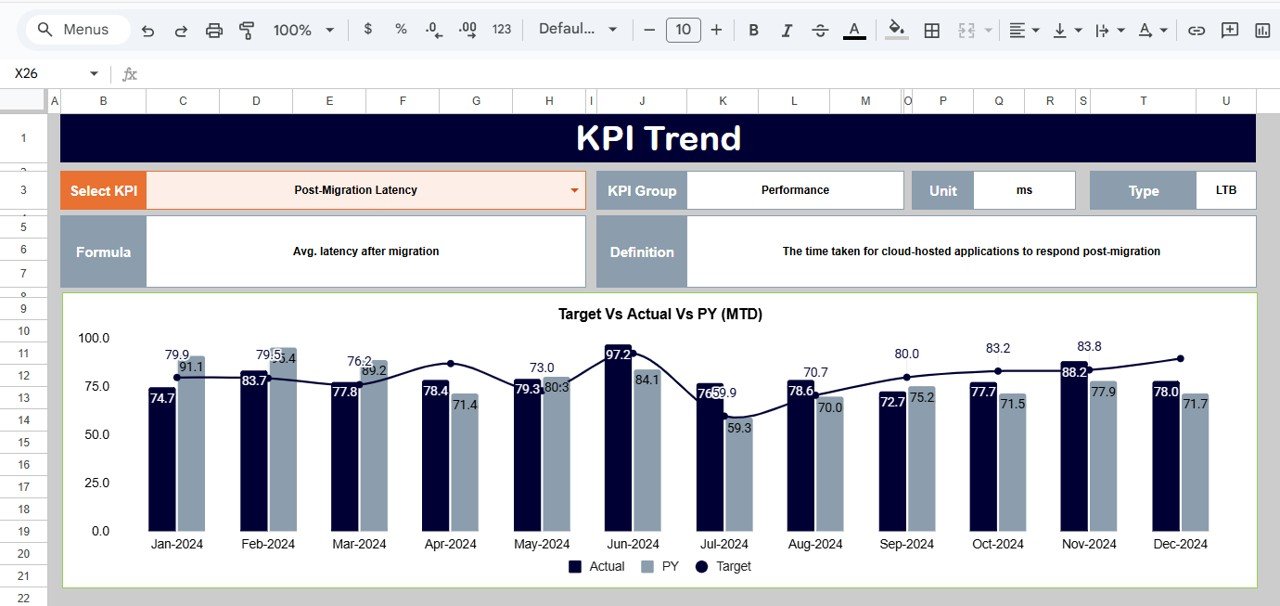
📊 KPI Trend Sheet
Select any KPI from the dropdown in cell C3 to view:
-
KPI Group
-
Unit of measurement
-
KPI type (Upper / Lower the Better)
-
Formula
-
Definition
-
12-month trend chart
This sheet supports root-cause analysis and proactive decision-making.
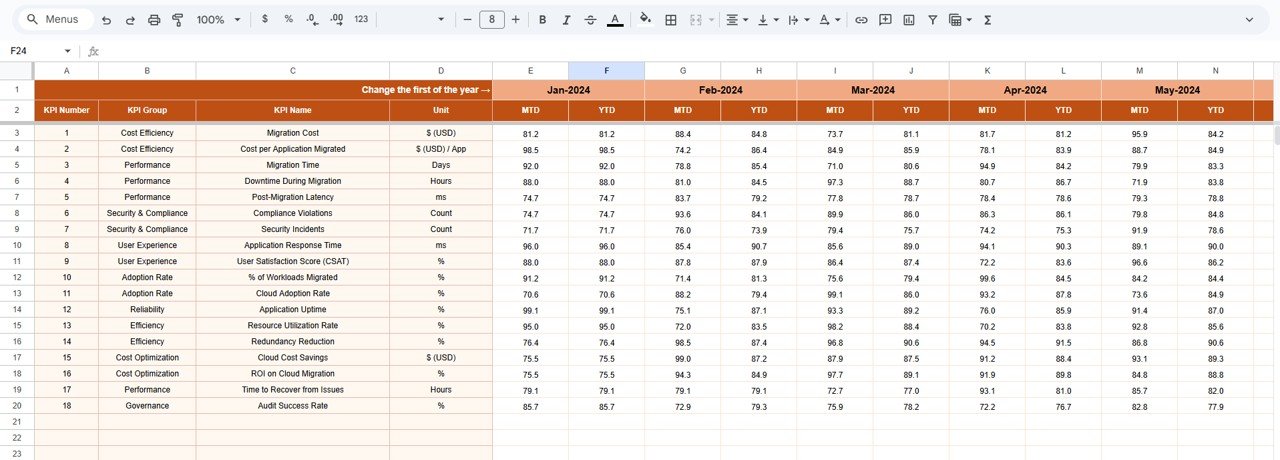
📝 Actual Number Sheet
Enter real migration data here:
-
MTD Actual values
-
YTD Actual values
Select the first month of the year in cell E1, and the structure aligns automatically.
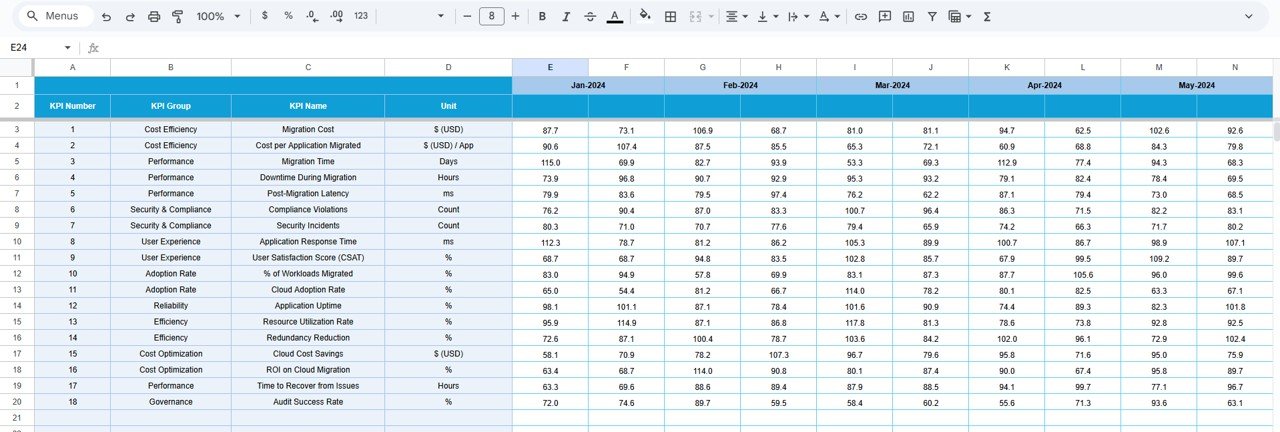
🎯 Target Sheet
Define planned cloud migration targets:
-
Monthly (MTD) targets
-
Annual (YTD) targets
This ensures accountability and progress tracking.
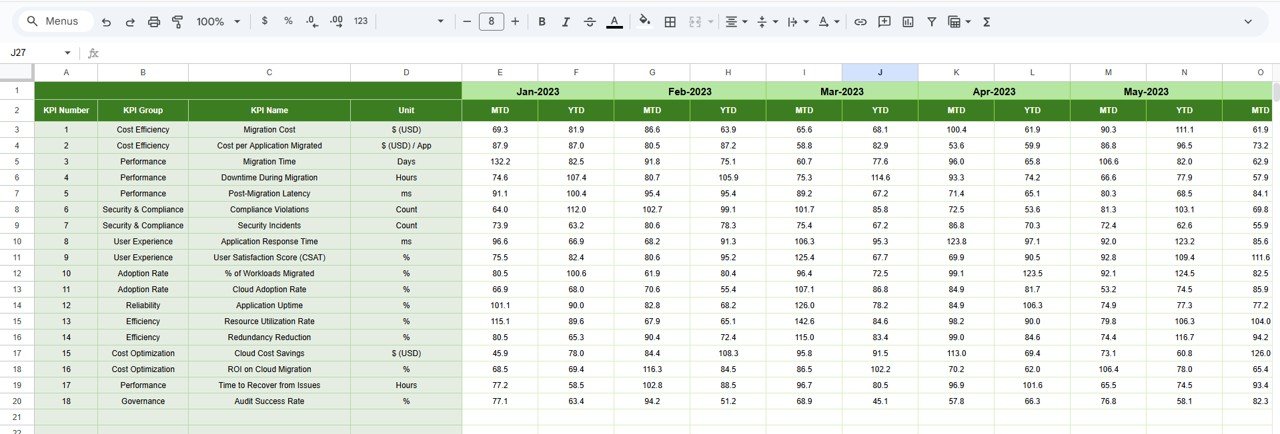
📆 Previous Year Number Sheet
Store past-year migration data to:
-
Compare YoY improvement
-
Measure maturity growth
-
Track migration effectiveness over time
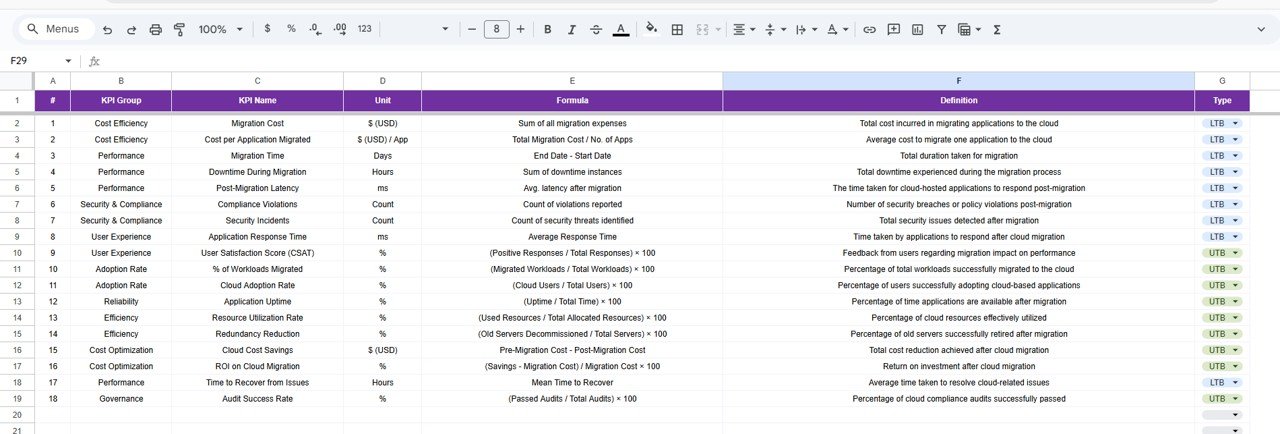
📘 KPI Definition Sheet
This sheet ensures governance and clarity by maintaining:
-
KPI Name
-
KPI Group
-
Unit
-
Formula
-
Definition
-
KPI Type (UTB / LTB)
It aligns cloud, IT, finance, and leadership teams on the same metrics.
🛠️ How to Use the Cloud Migration KPI Dashboard
1️⃣ Update actual migration data monthly
2️⃣ Maintain realistic targets in the Target sheet
3️⃣ Review trends in the KPI Trend sheet
4️⃣ Compare against previous year performance
5️⃣ Use dashboard insights for leadership decisions
No coding. No special tools. Just structured visibility.
👥 Who Can Benefit from This Cloud Migration KPI Dashboard
☁️ Cloud Architects & Engineers
Monitor workload movement, optimization, and performance.
📋 Project & Program Managers
Track timelines, targets, and delivery risks.
💰 Finance Teams
Track cloud cost efficiency and budget adherence.
🧑💼 IT Leadership & CIOs
Get instant migration health visibility.
🏢 Business Stakeholders
Understand ROI and migration impact clearly.
Click here to read the Detailed blog post
Watch the step-by-step video tutorial:


Reviews
There are no reviews yet.