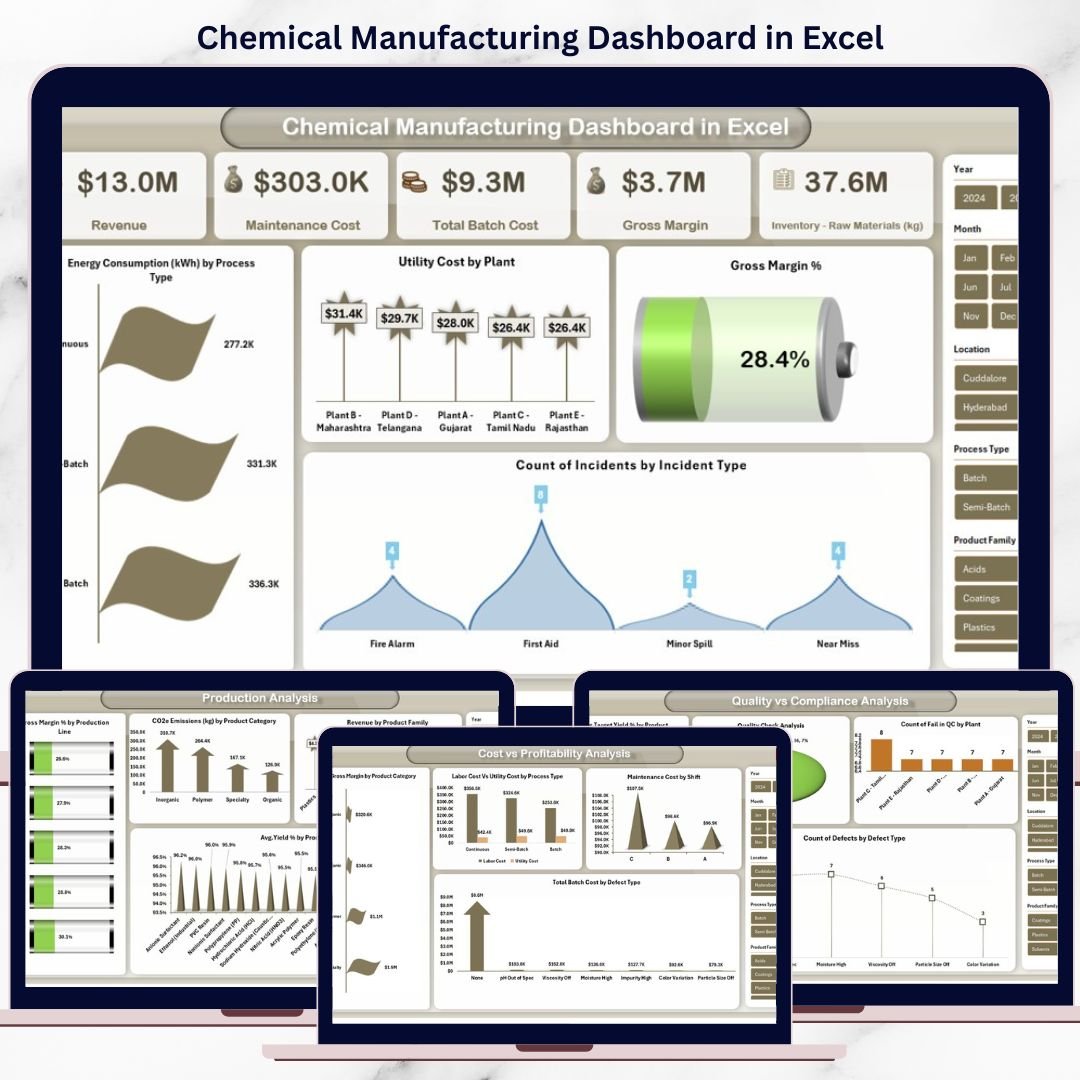
The chemical manufacturing industry operates under constant pressure—tight margins, strict environmental regulations, complex production processes, and high safety standards. Managing all this data through raw Excel sheets or disconnected reports often leads to delays, errors, and missed opportunities. That is why the Chemical Manufacturing Dashboard in Excel becomes a smart, practical, and high-impact solution for modern chemical manufacturers.
This ready-to-use Excel dashboard converts complex operational, financial, quality, and compliance data into clear KPIs, powerful visuals, and actionable insights. Instead of spending hours compiling reports, decision-makers can instantly understand plant performance, cost drivers, production efficiency, and environmental impact—all from one centralized Excel file.
Designed with simplicity and flexibility in mind, this dashboard works entirely in Microsoft Excel, making it accessible to production managers, finance teams, quality controllers, and compliance officers without requiring advanced technical skills.
## 🚀 Key Features of Chemical Manufacturing Dashboard in Excel
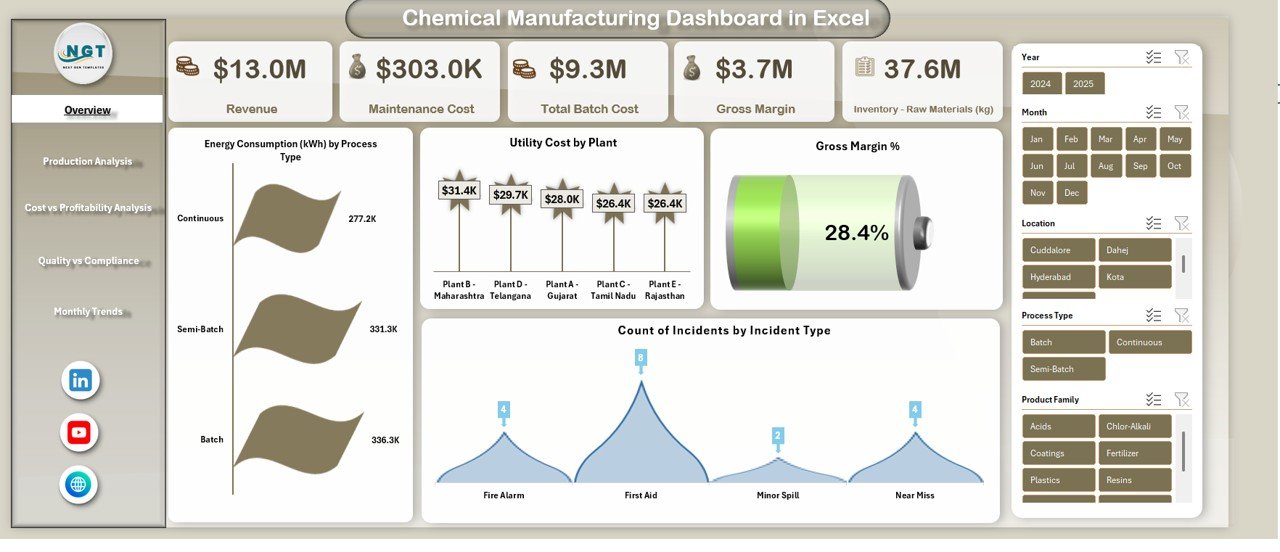
📊 Executive-level Overview showing revenue, maintenance cost, total batch cost, gross margin, and safety incidents
⚙️ Production performance tracking with yield %, emissions, and product profitability
💰 Cost vs profitability analysis to identify margin leaks and high-cost processes
🧪 Quality and compliance monitoring with defect analysis and environmental KPIs
🌱 Sustainability insights including CO₂e emissions, energy, and water consumption
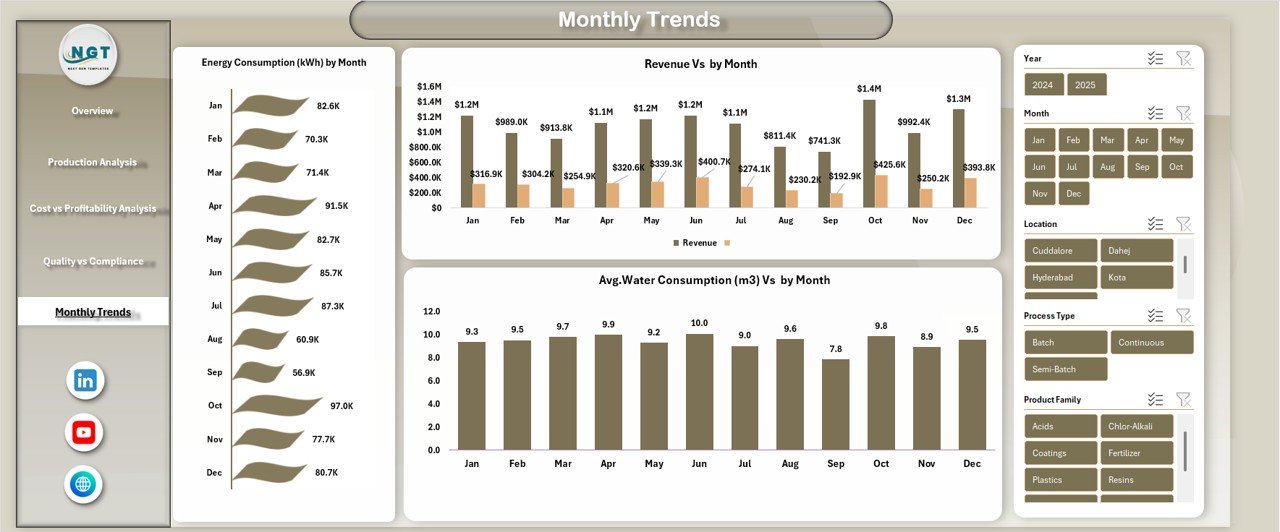
📈 Monthly trend analysis to detect seasonal patterns and long-term behavior
🧭 Easy navigation with structured sheets and intuitive layouts
💻 100% Excel-based—no Power BI, no complex setup, no extra cost
## 📂 What’s Inside the Chemical Manufacturing Dashboard in Excel
This dashboard includes multiple structured analysis sheets, each designed to answer critical business questions:
🔹 Overview Sheet
Get an instant snapshot of overall plant performance—revenue, margins, batch costs, maintenance spending, and safety incidents.
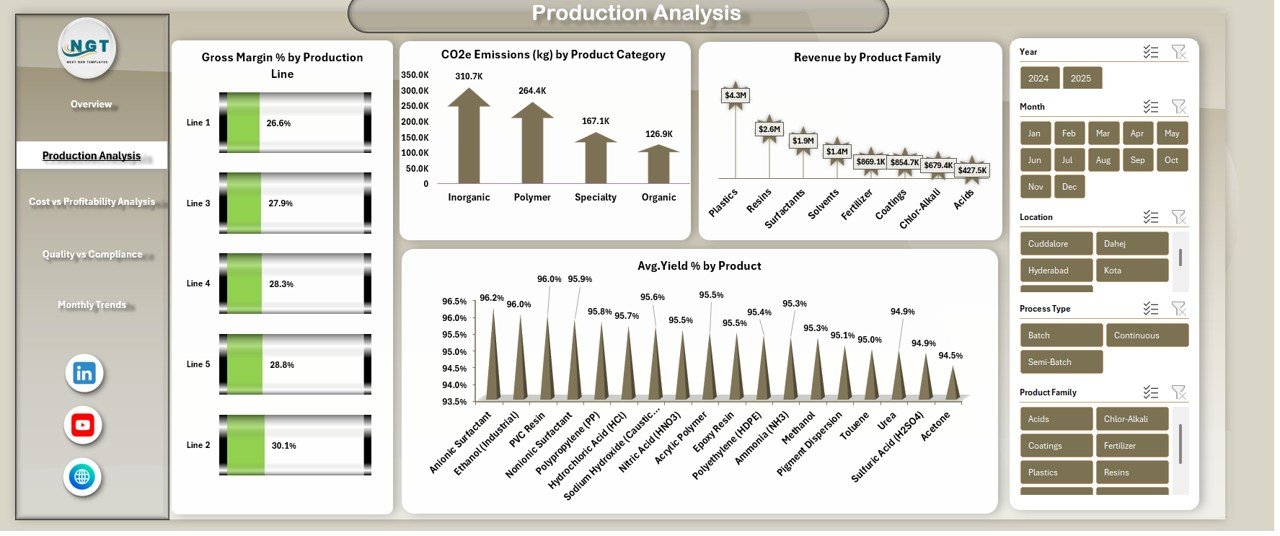
🔹 Production Analysis
Analyze gross margin % by production line, emissions by product category, revenue by product family, and average yield %.
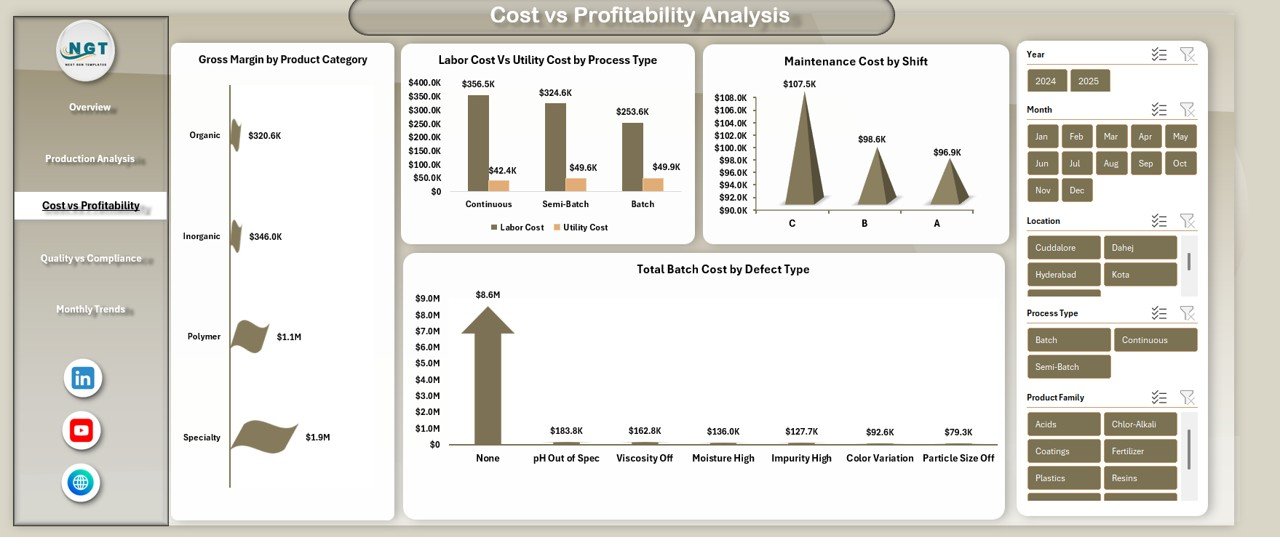
🔹 Cost vs Profitability Analysis
Compare labor vs utility costs, maintenance cost by shift, batch cost by defect type, and margin by product category.
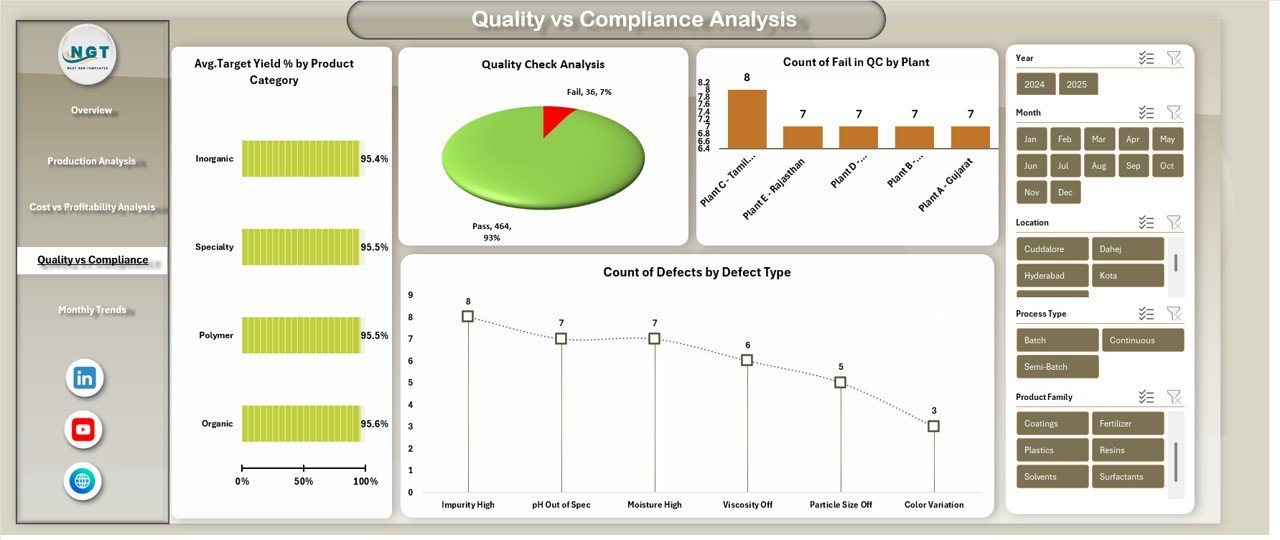
🔹 Quality vs Compliance Analysis
Track target yield %, quality inspection pass/fail rates, defects by type, and CO₂e emissions by region.
🔹 Monthly Trends Analysis
Monitor energy consumption, water usage, and revenue trends month by month to support forecasting and planning.
Each sheet is built to support pivot-based analysis, making it easy to slice data by product, process, region, or time.
## 🛠️ How to Use the Chemical Manufacturing Dashboard in Excel
Using this dashboard is simple and practical:
1️⃣ Enter or paste your operational, cost, quality, and environmental data into the input sheets
2️⃣ Refresh pivot tables and slicers
3️⃣ Instantly view updated KPIs and charts across all dashboard pages
4️⃣ Use filters to analyze performance by product, process, region, or month
5️⃣ Share insights with management during review meetings
Because everything runs inside Excel, customization is effortless. You can add KPIs, modify charts, or adjust layouts as per your plant’s needs.
## 👥 Who Can Benefit from This Chemical Manufacturing Dashboard in Excel
This dashboard is ideal for:
🏭 Chemical Plant Managers – Monitor efficiency, yield, and maintenance costs
📊 Operations & Production Teams – Identify bottlenecks and process losses
💼 Finance Teams – Track margins, batch costs, and profitability drivers
🧪 Quality & Compliance Teams – Reduce defects and stay audit-ready
🌱 Sustainability & ESG Teams – Analyze emissions, energy, and water usage
📈 Executives & Decision-Makers – Get fast, reliable insights without technical complexity
Whether you run a single plant or manage multiple facilities, this dashboard brings clarity to complexity.


Reviews
There are no reviews yet.