


The Chemical KPI Dashboard in Power BI is an essential tool designed for chemical industries to track, monitor, and analyze key performance indicators (KPIs) related to production, quality, safety, and operational efficiency. With this advanced dashboard, managers can easily visualize real-time data on everything from chemical production volumes and energy consumption to waste management and compliance, all in one place.
Power BI’s dynamic features make this dashboard interactive, allowing users to drill down into specific metrics for in-depth analysis. Whether you’re monitoring production efficiency, quality control, or safety incidents, the dashboard provides valuable insights to optimize processes and improve overall performance.

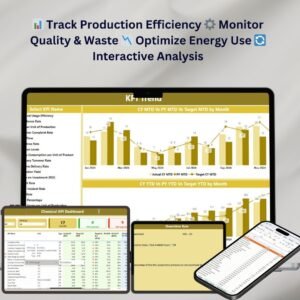
Key Features of the Chemical KPI Dashboard in Power BI
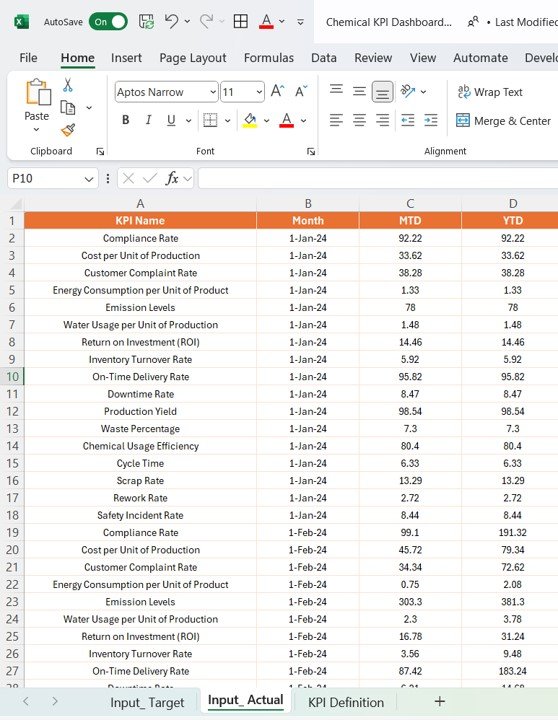
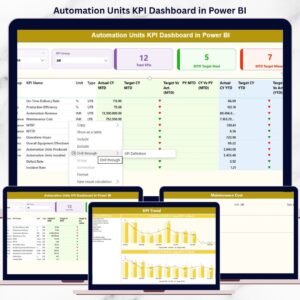
📊 Real-Time Performance Monitoring: Track critical KPIs such as production output, quality levels, and safety incidents in real time.
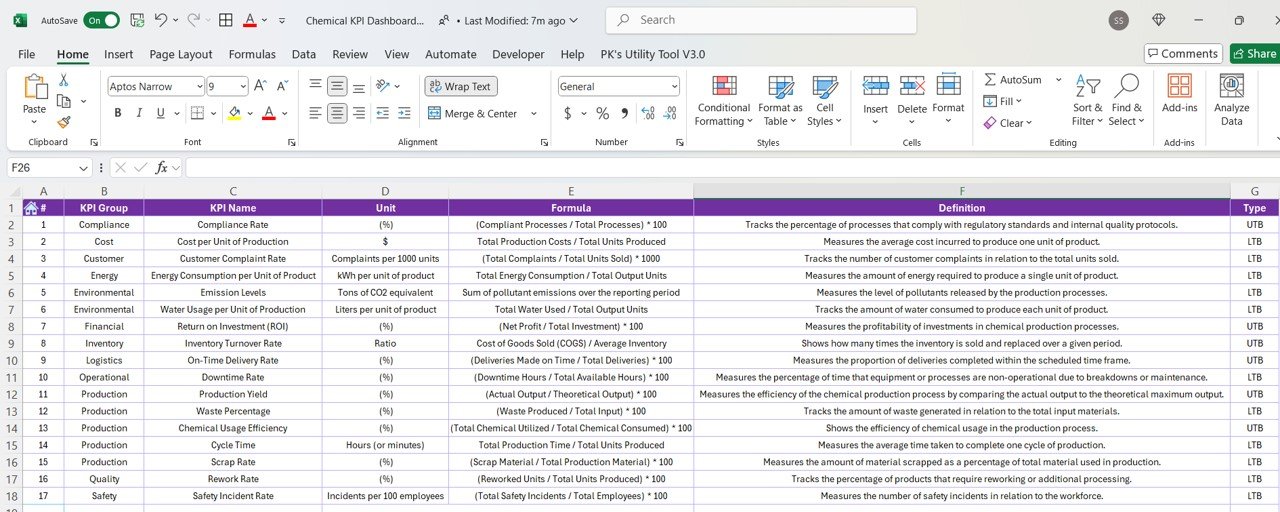
⚙️ Customizable KPIs: Tailor the dashboard to track specific chemical production metrics, such as yield, energy consumption, and waste reduction.
📈 Efficiency and Quality Analysis: Analyze production efficiency, batch quality, and cost per unit to identify areas for improvement.
📅 Time-Based Performance Insights: Monitor performance over different time periods, whether daily, weekly, monthly, or yearly.
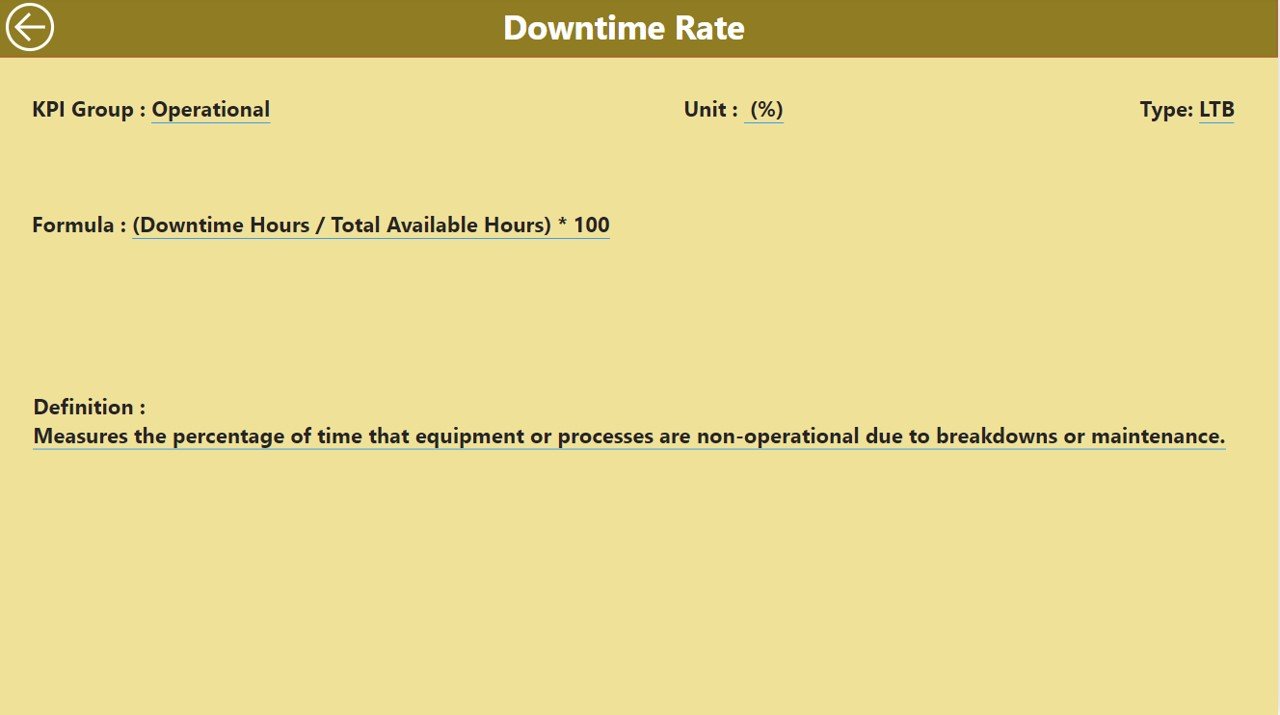
📉 Waste and Energy Consumption Tracking: Measure chemical waste and energy consumption to optimize resource usage and reduce costs.
🔄 Interactive Dashboard: Use interactive filters to drill down into detailed performance metrics and identify trends and inefficiencies.
🧑💼 User-Friendly Interface: A clean and simple design ensures that users can easily navigate and interact with the dashboard.
Why You’ll Love the Chemical KPI Dashboard in Power BI
✅ Streamlined Production Monitoring: Keep track of production volumes, yield, and energy consumption in one central location.
✅ Data-Driven Decision Making: Make informed decisions based on real-time data visualizations and comprehensive performance analysis.
✅ Increases Operational Efficiency: Identify inefficiencies, reduce waste, and optimize energy consumption to improve profitability.
✅ Customizable to Your Needs: Tailor the dashboard to your specific chemical production processes and KPIs.
✅ Improves Safety and Compliance: Track safety incidents and ensure compliance with industry standards.
What’s Inside the Chemical KPI Dashboard in Power BI?
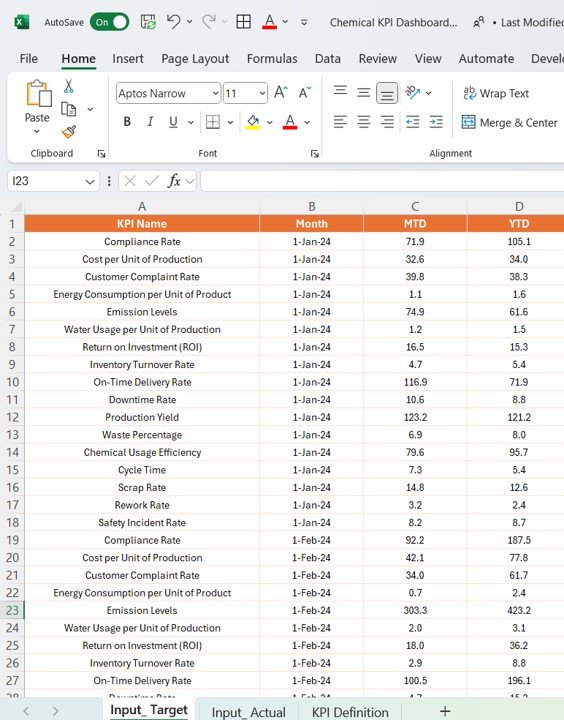
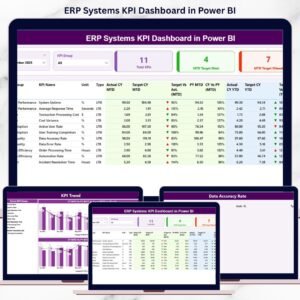
📊 Production Monitoring: Track production output, yield, and quality across multiple production lines.
📈 Efficiency and Cost Analysis: Analyze production efficiency and calculate cost per unit to improve profitability.
⚙️ Energy and Waste Tracking: Measure energy usage, waste generation, and other critical environmental factors.
📉 Safety and Compliance Monitoring: Monitor safety incidents, regulatory compliance, and maintain safety standards.
🔄 Interactive Features: Dive deeper into data and uncover trends with interactive filtering and drill-down capabilities.
How to Use the Chemical KPI Dashboard in Power BI
1️⃣ Download the Dashboard Template – Gain immediate access to the Power BI file.
2️⃣ Customize the KPIs: Modify the dashboard to track KPIs relevant to your chemical production operations.
3️⃣ Connect Your Data: Link your production and operational data to the dashboard for seamless monitoring.
4️⃣ Monitor and Analyze: Use the interactive dashboard to track KPIs, analyze trends, and optimize production.
5️⃣ Generate Reports: Create detailed reports to share insights with stakeholders and decision-makers.
Who Can Benefit from the Chemical KPI Dashboard in Power BI?
🔹 Chemical Engineers
🔹 Production Managers
🔹 Operations Managers
🔹 Safety and Compliance Officers
🔹 Data Analysts
🔹 Quality Control Teams
🔹 Environmental Managers
Streamline chemical production monitoring and improve operational efficiency with this advanced and customizable Power BI dashboard.
Click here to read the detailed blog post
Visit our YouTube channel to learn step-by-step video tutorials
Also check our Expense Tracking Dashboard in Power BI


Reviews
There are no reviews yet.