The cement industry operates under high pressure. Every day, production teams manage massive quantities of raw materials, fuel, clinker, cement bags, dispatch plans, customer orders, and multi-plant operations. As the volume increases, Excel files become bigger, reports become slower, and teams spend hours combining multiple sheets to track production, downtime, dispatch, and energy consumption. This leads to delays, errors, and weak decision-making.
A Cement Industry Dashboard in Excel solves all these challenges instantly. It brings together every critical KPI in a clean, visual, ready-to-use format. With slicers, charts, automated summaries, and structured pages, the dashboard turns raw plant data into clear, real-time insights. Since it works fully inside Excel, every team—from operators to managers—can use it without learning new software.
This dashboard is designed for clinker units, grinding units, OPC/PPC/Slag cement producers, dispatch teams, quality teams, and leadership groups who need fast insights for better control.
🏭 Key Features of the Cement Industry Dashboard in Excel
This dashboard includes multiple structured pages, KPI cards, slicers, and powerful visuals that help cement plants understand operations from every angle.
-
✔ Left-side Page Navigator for quick movement
-
✔ Ready slicers for plant, customer type, product type, and month
-
✔ Automated KPI cards for production, dispatch, downtime & fuel
-
✔ Data-driven charts for complete operational understanding
-
✔ Fully automated Excel-based system—no coding required
-
✔ Instant refresh whenever new data is entered
-
✔ Support sheets + Data Sheet for perfect accuracy
📘 What’s Inside the Cement Industry Dashboard in Excel?
The dashboard consists of five high-value analytical pages. Each page presents a unique perspective to help teams track performance effortlessly.
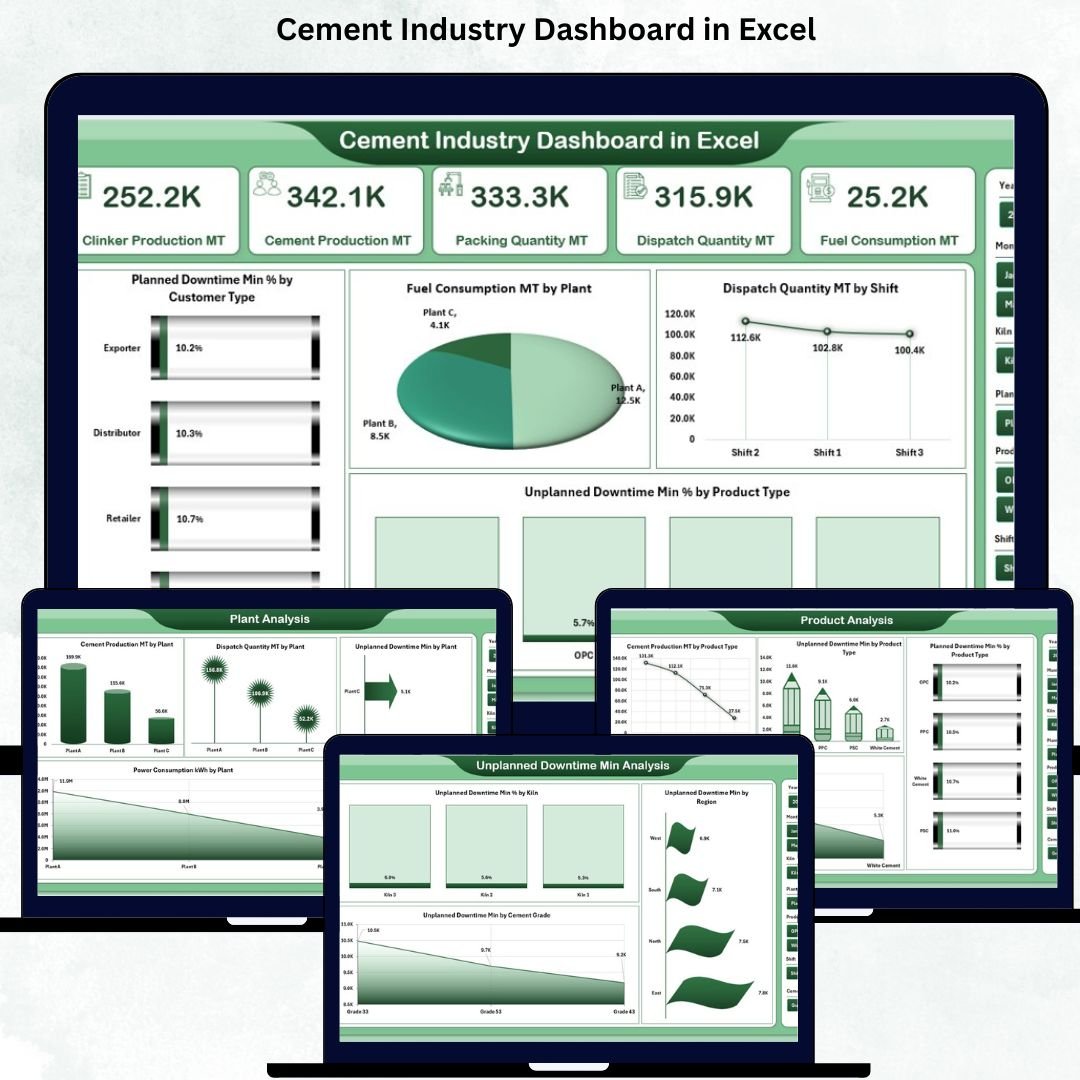
⭐ 1. Overview Page – Your Complete Cement Operations Snapshot
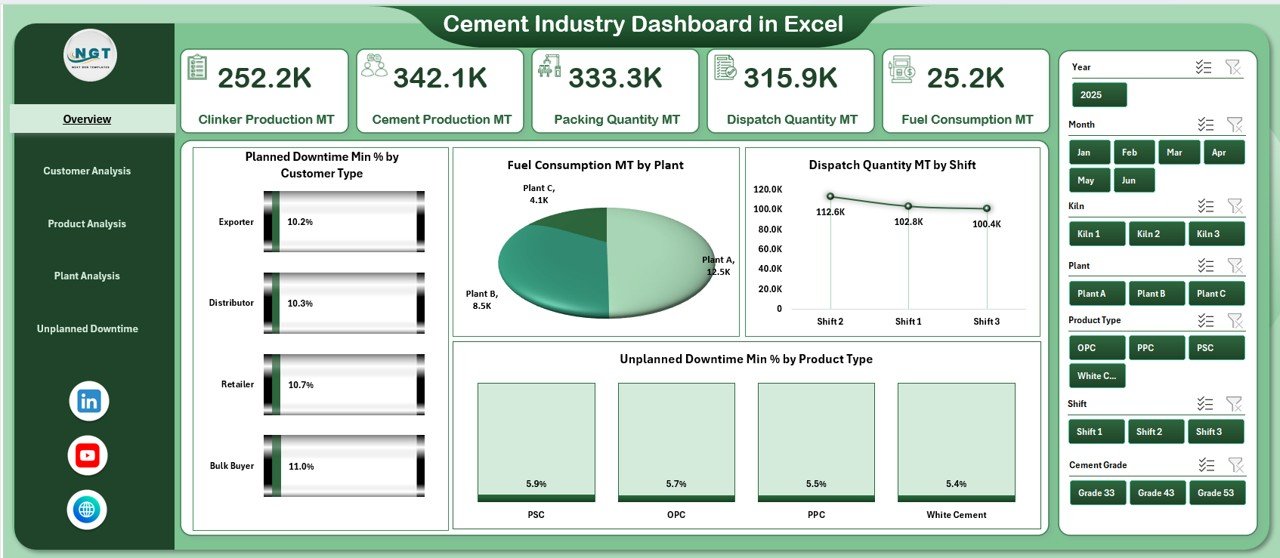
The Overview Page is the main screen showing the most crucial KPIs in card format. This helps managers understand daily and monthly performance immediately.
KPI Cards Include:
-
⚙️ Current Production Performance
-
📦 Total Cement Output
-
🔥 Total Fuel Consumption
-
🚚 Total Dispatch Quantity
-
⛔ Unplanned Downtime Percentage
Key Charts:
-
Planned Downtime % by Customer Type
-
Fuel Consumption (MT) by Plant
-
Dispatch Quantity (MT) by Shift
-
Unplanned Downtime % by Product Type
Right-side slicers make the entire page fully interactive, allowing quick filtering.
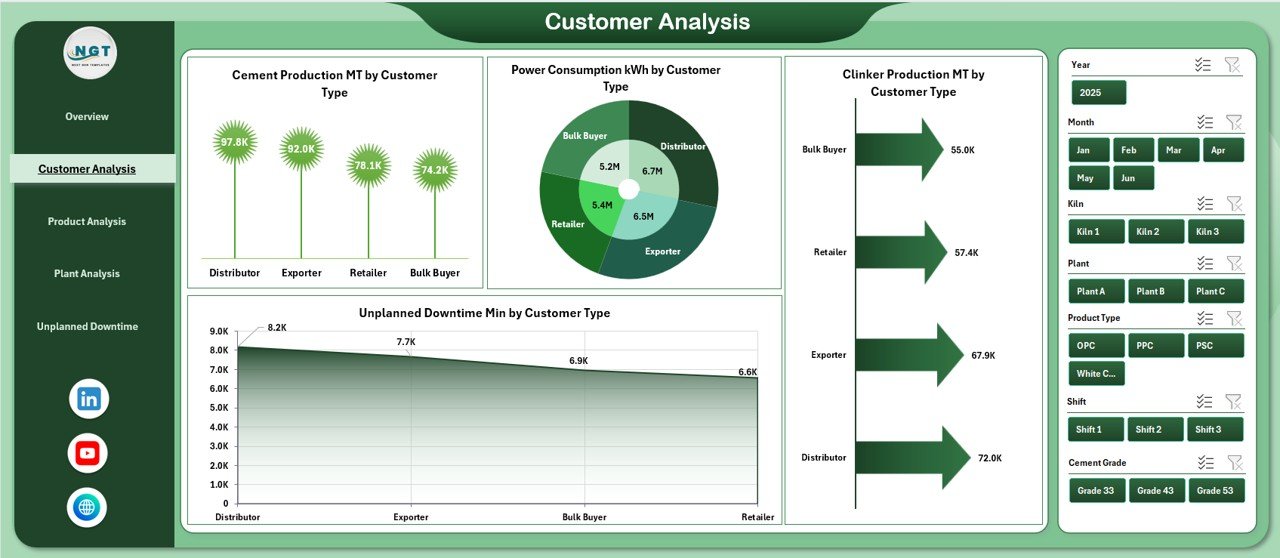
👥 2. Customer Analysis Page – Understand Customer Impact
Customer types influence production patterns, clinker requirements, and power usage. This page helps both sales and production teams align operations with customer demand.
Charts Include:
-
Cement Production (MT) by Customer Type
-
Power Consumption (kWh) by Customer Type
-
Clinker Production (MT) by Customer Type
-
Unplanned Downtime Min by Customer Type
With slicers, teams review monthly, plant-wise, and region-wise customer trends effortlessly.
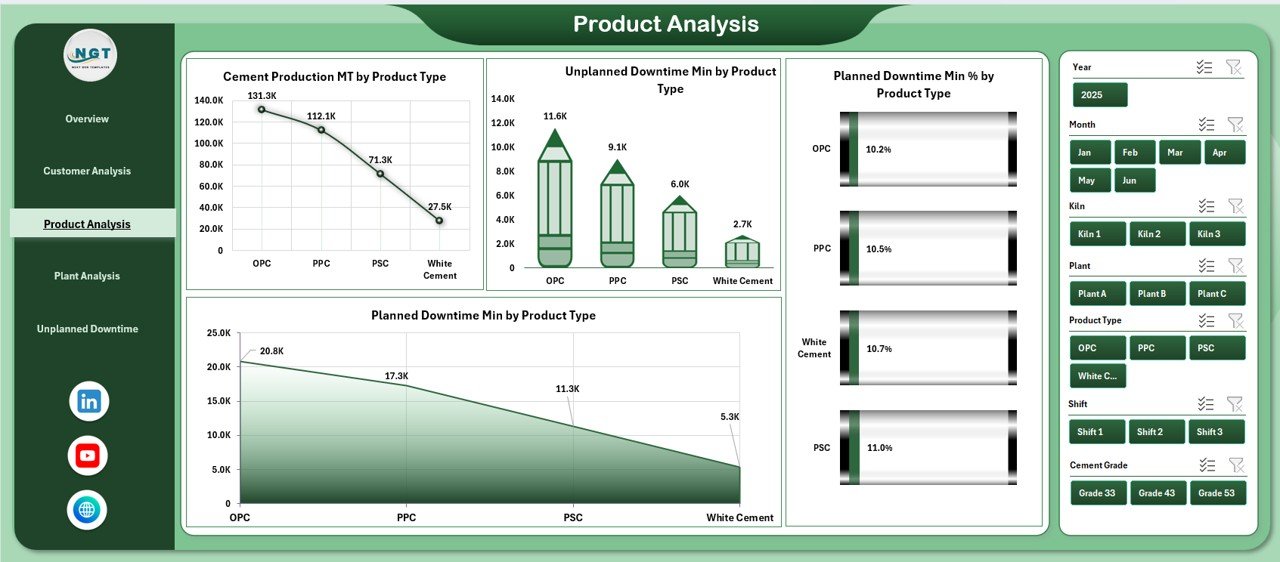
🧱 3. Product Analysis Page – Compare Cement Grades
Cement plants produce multiple products such as OPC, PPC, White Cement, Slag Cement, Rapid Hardening Cement, etc. This page compares product-wise performance across KPIs.
Charts Include:
-
Cement Production (MT) by Product Type
-
Unplanned Downtime Min by Product Type
-
Planned Downtime % by Product Type
-
Planned Downtime Min by Product Type
This helps teams optimize grade-wise planning and manage product-specific bottlenecks.
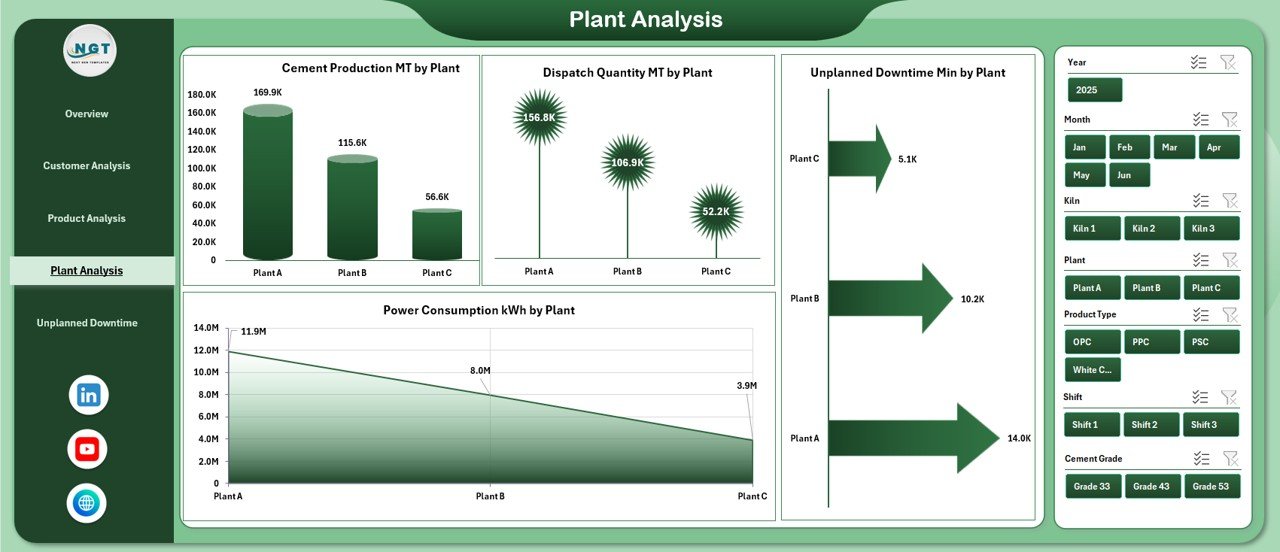
🌍 4. Plant Analysis Page – Plant-wise Operational Insights
Large cement groups operate several plants. This page gives a side-by-side comparison of all locations.
Charts Include:
-
Cement Production (MT) by Plant
-
Unplanned Downtime Min by Plant
-
Power Consumption (kWh) by Plant
-
Dispatch Quantity (MT) by Plant
With slicers, managers filter data by month, region, product, or customer type to get crystal-clear insights.
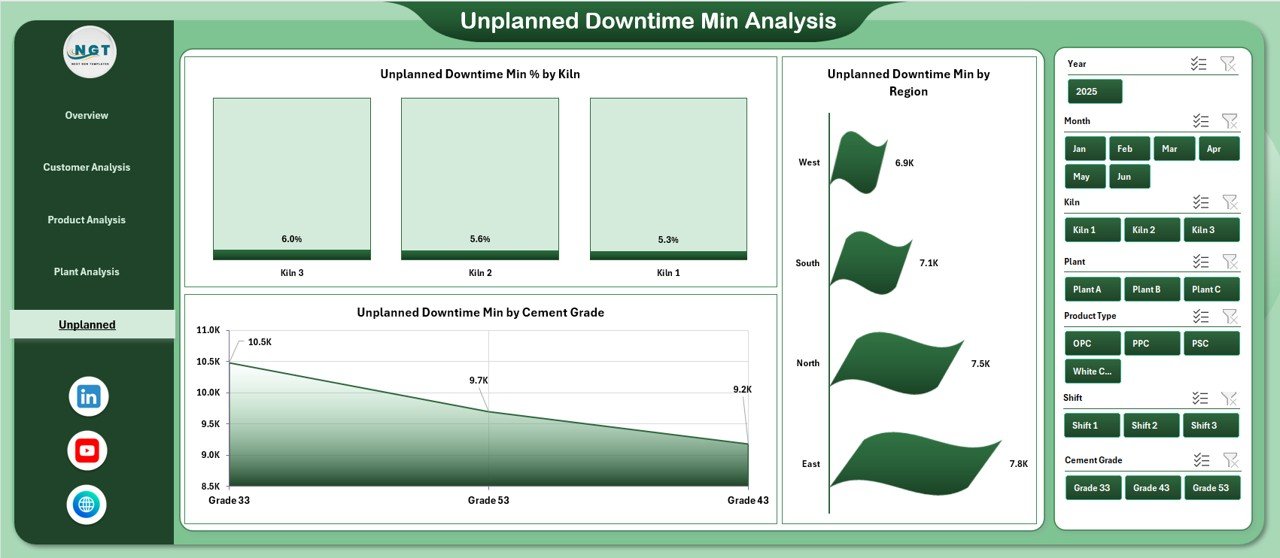
⚠️ 5. Unplanned Downtime Analysis Page – Maintenance Focus
Unplanned downtime impacts clinker generation, cement grinding, dispatch schedules, and fuel consumption. This page helps maintenance teams track and eliminate downtime causes.
Charts Include:
-
Unplanned Downtime % by Kiln
-
Unplanned Downtime Min by Region
-
Unplanned Downtime Min by Cement Grade
This page is essential for preventive and predictive maintenance planning.
📄 Support Sheet & Data Sheet
The dashboard includes:
✔ Support Sheet
Plant list, customer types, product types, regions, and lookup values.
✔ Data Sheet
Stores:
-
Cement production
-
Clinker production
-
Power usage
-
Fuel consumption
-
Dispatch data
-
Downtime (planned/unplanned)
-
Customer type
-
Product type
-
Region
-
Plant details
Enter data once—the dashboard updates everything automatically.
🚀 Why Cement Plants Need This Dashboard
-
Real-time visibility
-
Fewer manual errors
-
Faster decision-making
-
Clear downtime patterns
-
Better production planning
-
Strong KPI tracking
-
Improved coordination between teams
🧠 Best Practices for Using This Dashboard
-
Update the Data Sheet daily
-
Maintain consistent naming
-
Review downtime charts frequently
-
Track product and customer trends
-
Use slicers for deep insights
-
Share the dashboard with management
-
Keep weekly backups
🎯 How the Dashboard Improves Plant Performance
-
Reduces downtime
-
Improves dispatch planning
-
Controls fuel & power usage
-
Supports shift-wise and plant-wise comparison
-
Enhances customer service
-
Helps leadership make accurate decisions
### Click here to read the Detailed Blog Post
📺 Visit our YouTube channel to learn step-by-step video tutorials
👉 https://youtube.com/@PKAnExcelExpert


Reviews
There are no reviews yet.