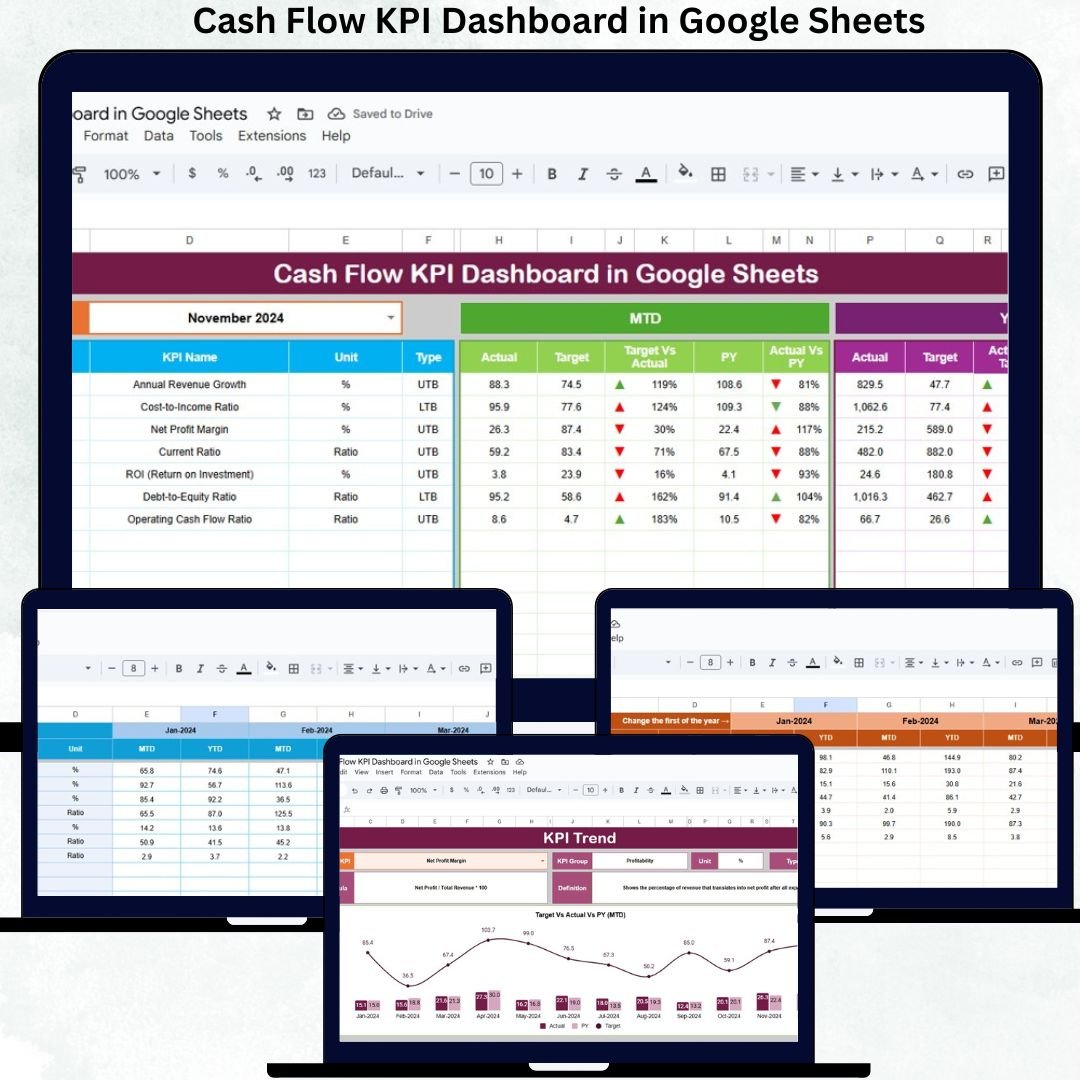

Cash flow is the heartbeat of every business. When money flows in smoothly and expenses stay predictable, companies can grow, invest, and make confident decisions. But when cash flow is unclear, delayed, or poorly tracked, even profitable businesses face financial pressure. That’s why forward-thinking organizations rely on smart tools like the Cash Flow KPI Dashboard in Google Sheets—a powerful, cloud-based system that converts raw finance data into meaningful insights, visual charts, trends, and real-time comparisons.
This dashboard is designed for finance teams, CFOs, startups, SMEs, and consultants who want complete visibility into their cash movement. Instead of scattered spreadsheets or complicated reports, you get one single, automated Google Sheets dashboard that updates instantly when you enter actual, target, or previous-year figures. Whether you want to check liquidity, cash burn rate, working capital efficiency, inflows vs outflows, or monthly movement patterns, this dashboard gives you everything in a clean, organized, and interactive format.
✨ Key Features of the Cash Flow KPI Dashboard in Google Sheets
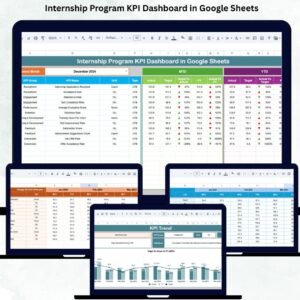
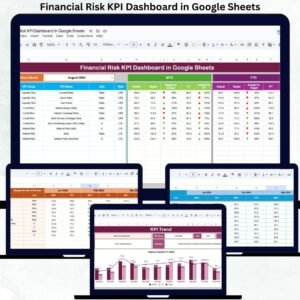
📊 1. Automated MTD & YTD Performance Tracking
Monitor Month-to-Date and Year-to-Date values instantly. Just select your month, and all KPIs refresh automatically—no extra formulas or manual updates needed.
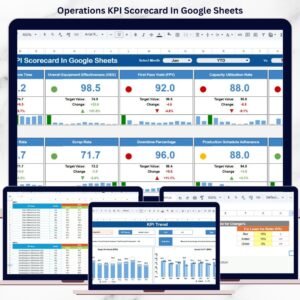
📈 2. Actual vs Target & YoY Comparison
Quickly see whether you are ahead or behind your goals. Conditional formatting arrows highlight improvements or declines, making financial review fast and intuitive.
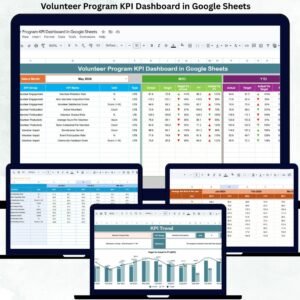
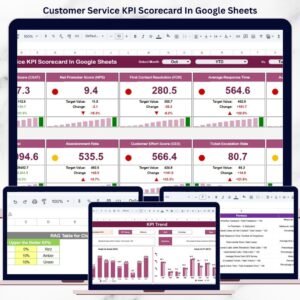
📉 3. Trend Analysis for Every KPI
Select any KPI and visualize its monthly pattern. Spot early warning signs, seasonal fluctuations, or growth opportunities at a glance.
🧮 4. Clean & Structured Data Input Sheets
Dedicated tabs for actual numbers, targets, and previous-year values ensure accuracy and easy data management.
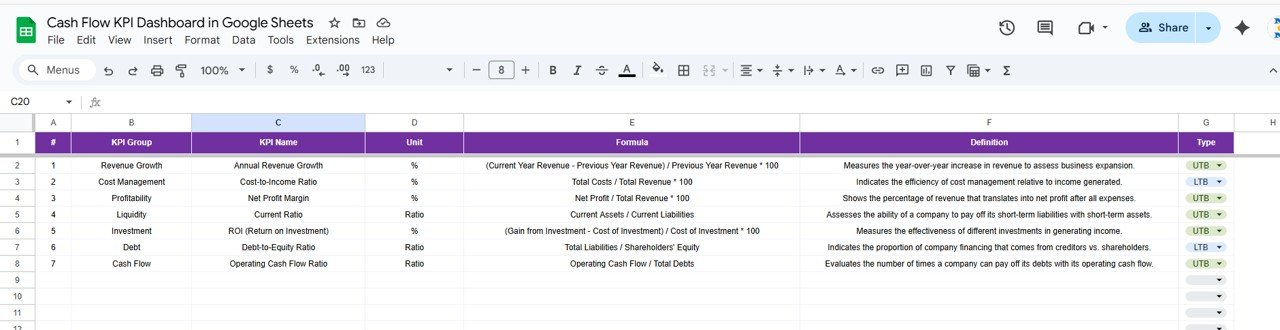
📘 5. KPI Definition Library
Understand every KPI clearly with definitions, formulas, units, and KPI types (LTB or UTB). Ideal for maintaining accuracy across finance teams.
📦 What’s Inside the Cash Flow KPI Dashboard in Google Sheets
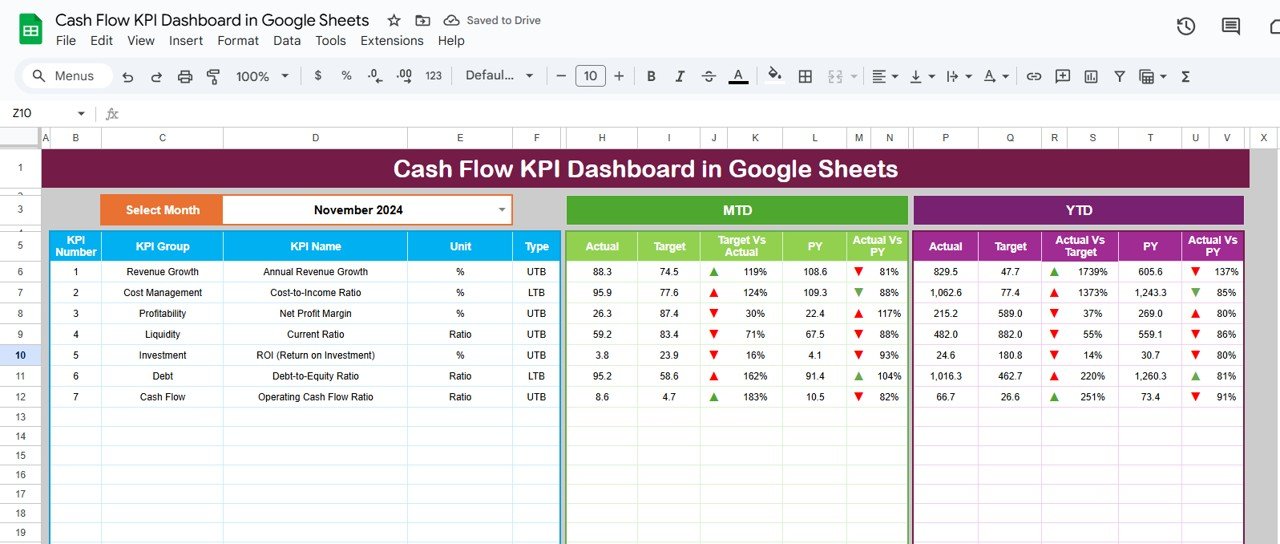
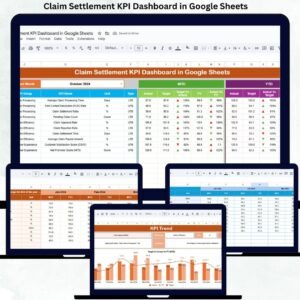
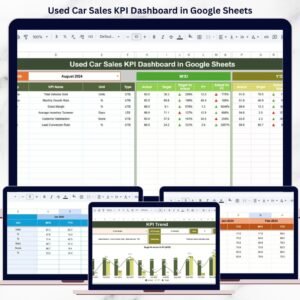
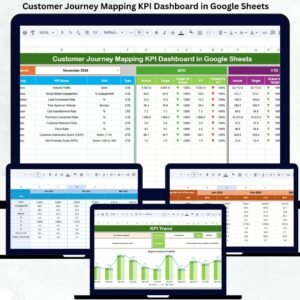
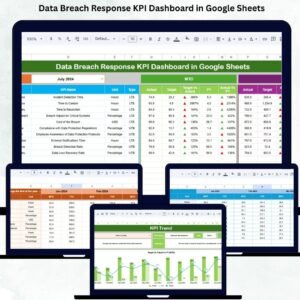
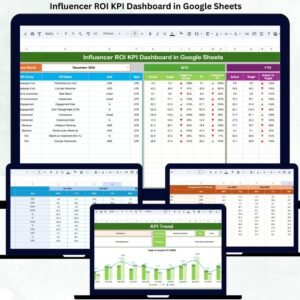
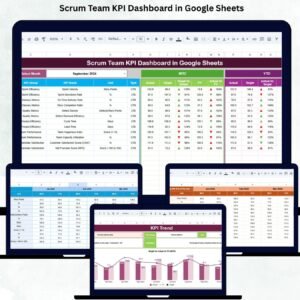
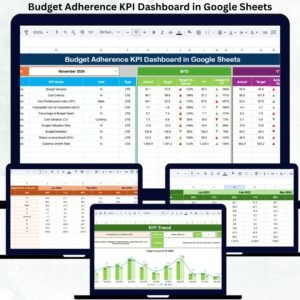
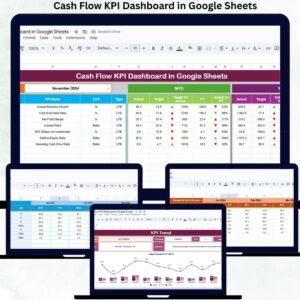
🖥️ Dashboard Sheet (Main Dashboard)
This central page displays all performance metrics in a visual, user-friendly layout. You select the month using the dropdown in D3, and the dashboard instantly updates:
-
MTD Actual, Target, Previous Year
-
YTD Actual, Target, Previous Year
-
Target vs Actual
-
PY vs Actual
Green arrows indicate improvement, red arrows show decline—making financial health visible at a glance.
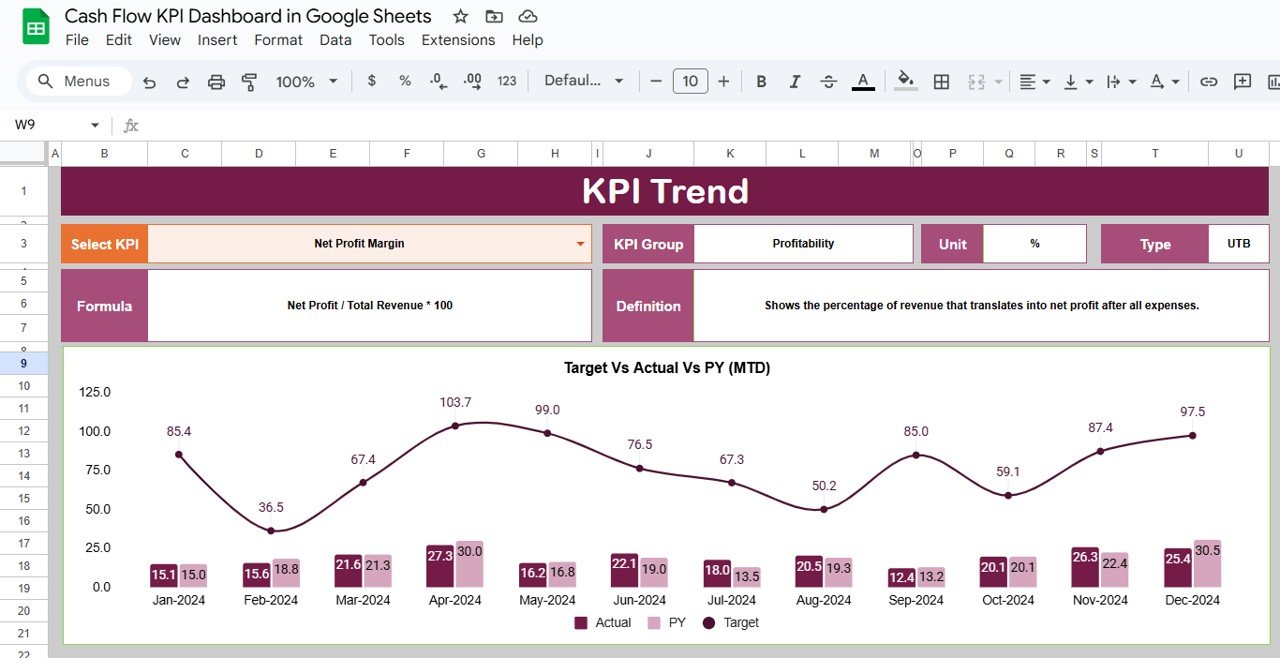
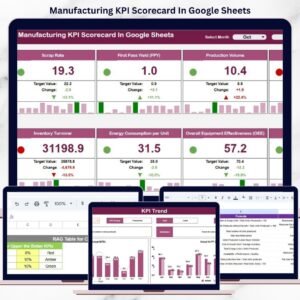
📈 KPI Trend Sheet
Choose a KPI from the dropdown (C3) to see its group, formula, definition, type, and trend chart. This helps finance teams analyze month-to-month movement and find improvement opportunities.
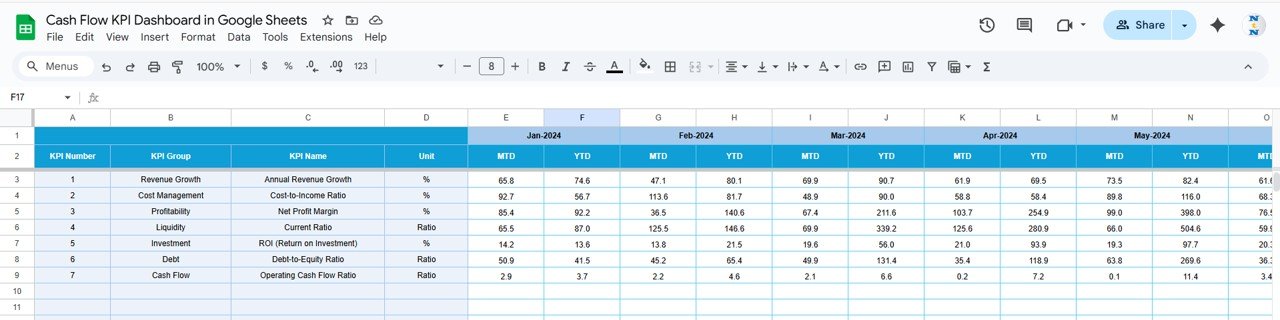
📋 Actual Number Sheet
Enter all MTD and YTD actual cash data here. Adjust the current month using E1, and the dashboard instantly pulls updated values.
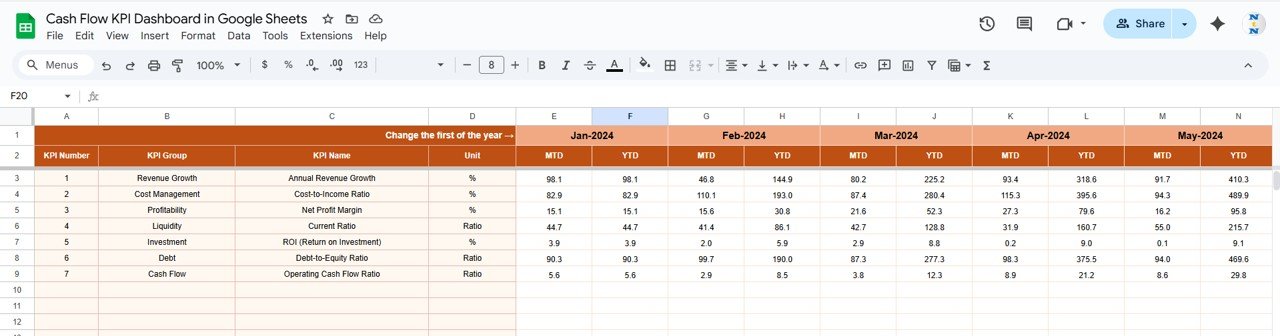
🎯 Target Sheet
Set both MTD and YTD target numbers for each KPI. This helps track whether financial goals are on track or slipping.
📆 Previous Year Number Sheet
Store last year’s performance numbers here. The dashboard uses this for YOY comparisons and understanding long-term trends.
📘 KPI Definition Sheet
A reference library for KPI names, units, formulas, types, and definitions. This ensures consistent reporting across your finance department.
🛠️ How to Use the Cash Flow KPI Dashboard in Google Sheets
1️⃣ Update Actual Numbers Regularly
Enter your MTD and YTD actual figures in the Actual Number sheet.
2️⃣ Set Targets & Expectations
Input your target values to compare goals vs actual performance.
3️⃣ Enter Previous-Year Values
This enables strong YOY performance analysis.
4️⃣ Select Your Month
Use the dashboard dropdown to refresh KPIs and charts instantly.
5️⃣ Review Trends & Plan Ahead
Use the KPI Trend Sheet to identify patterns, growth areas, and risks.
6️⃣ Collaborate With Your Team
Since it’s cloud-based, multiple members can work on the dashboard in real time.
🎯 Who Can Benefit from This Cash Flow KPI Dashboard in Google Sheets
💼 CFOs & Finance Leaders
Track liquidity, cash burn, payables, receivables, and working capital easily.
🚀 Startup Founders
Understand financial runway and make confident investment decisions.
📊 Finance Teams & Accountants
Avoid manual reporting and get real-time insights instantly.
🏢 SMEs & Enterprise Teams
Plan budgets, control expenses, and maintain financial stability.
📈 Consultants & Advisors
Monitor client cash flow professionally and present insights clearly.
Click here to read the Detailed blog post
Watch the step-by-step video tutorial:


Reviews
There are no reviews yet.