Managing a cardiology institute is not just about treating patients—it’s about making fast, data-driven decisions that save lives. What if you could monitor every critical KPI, track performance in real time, and improve patient outcomes—all in one powerful Excel dashboard? 🚀
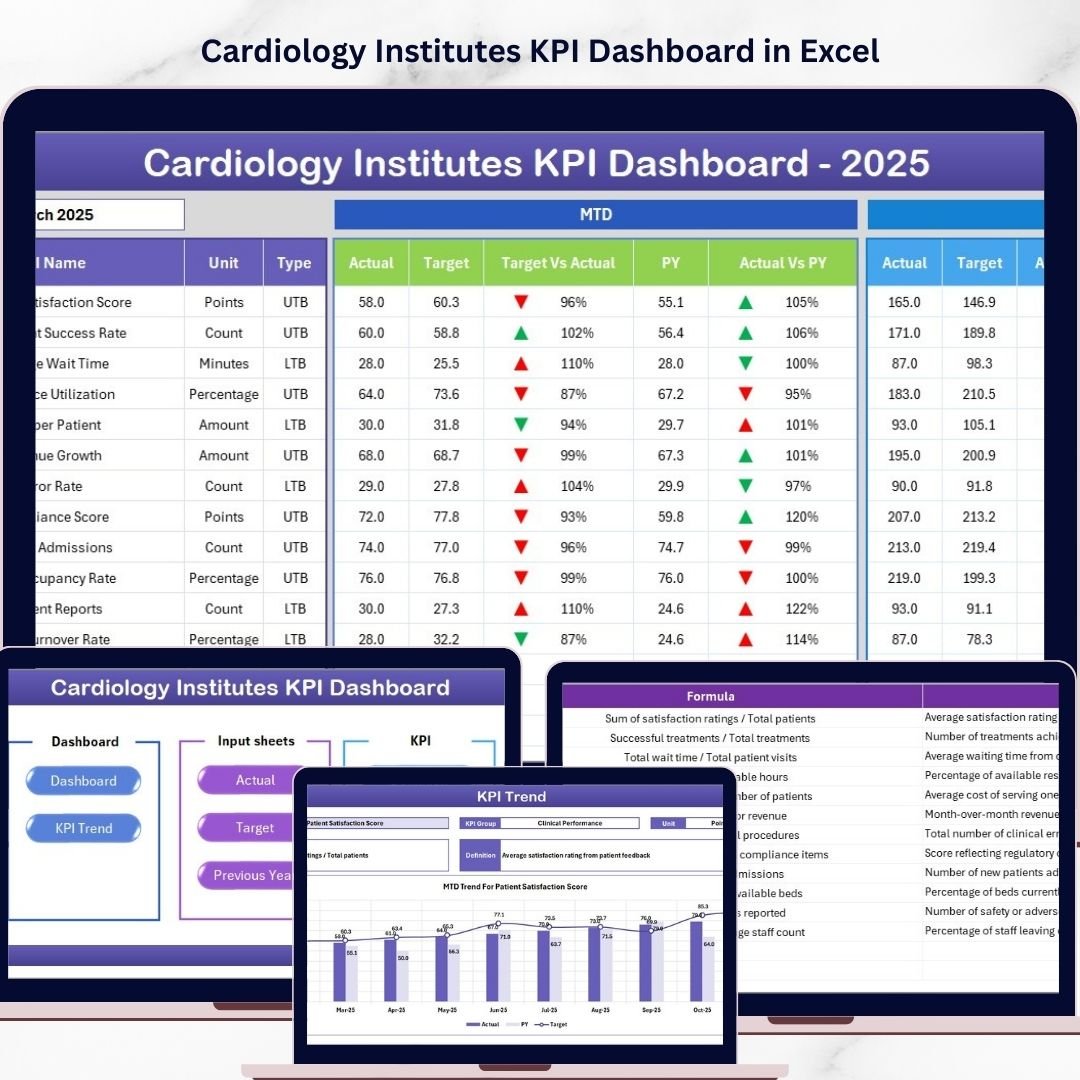
Introducing the Cardiology Institutes KPI Dashboard in Excel — a smart, ready-to-use solution designed to transform how healthcare professionals track, analyze, and improve performance. This dashboard eliminates manual reporting, reduces errors, and provides instant insights into clinical, operational, and financial KPIs.
Whether you are managing a hospital, cardiac care center, or healthcare organization, this dashboard empowers you with clarity, speed, and control.
💡 Key Features of Cardiology Institutes KPI Dashboard in Excel
✨ Interactive Dashboard View – Monitor all KPIs in one screen with dynamic visuals and insights.
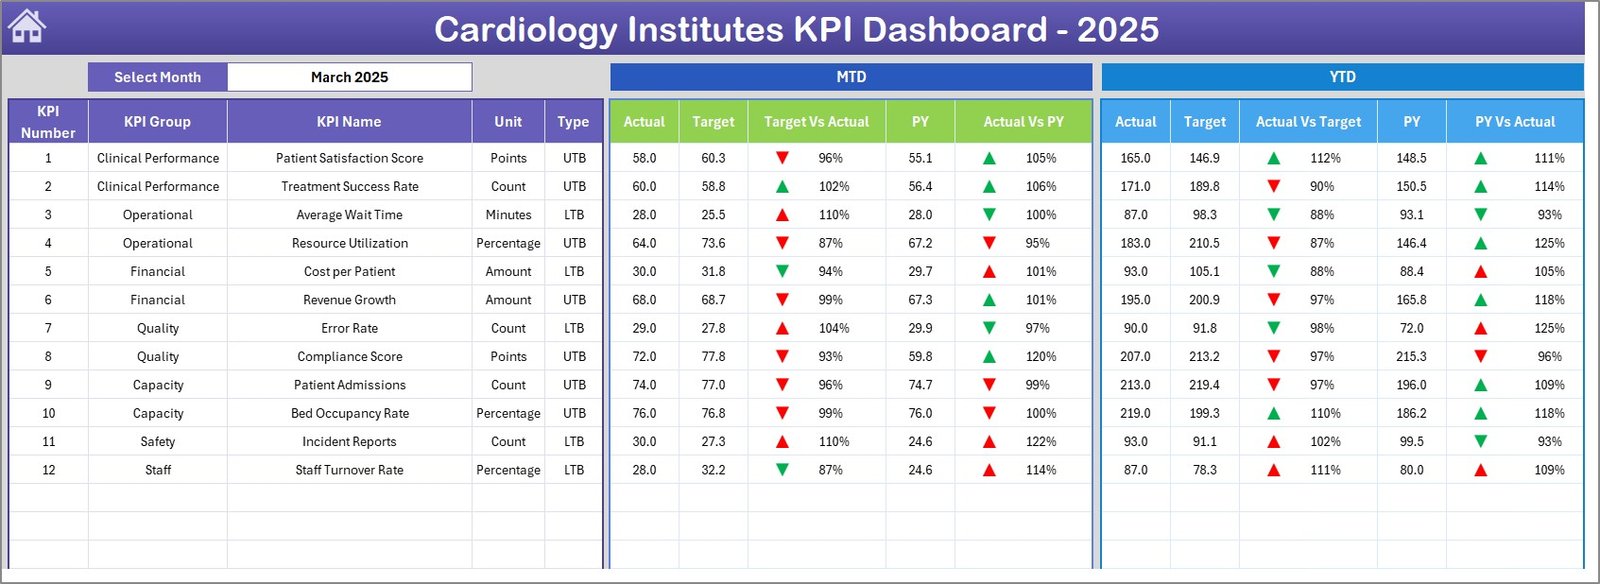
📅 Month-Based Analysis – Select any month and instantly update the entire dashboard.
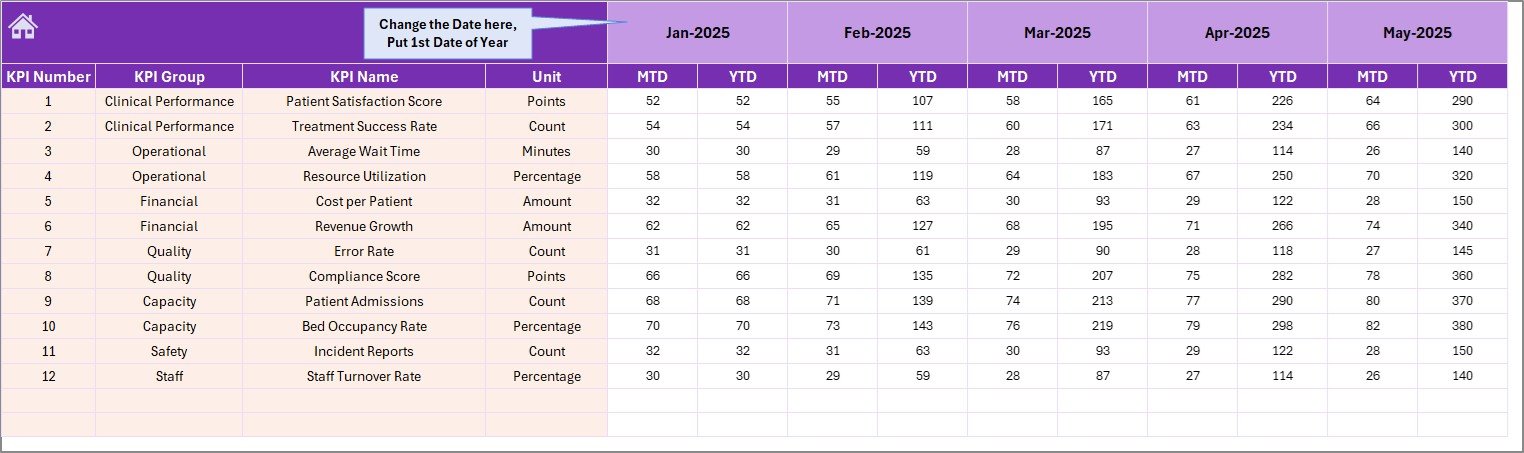
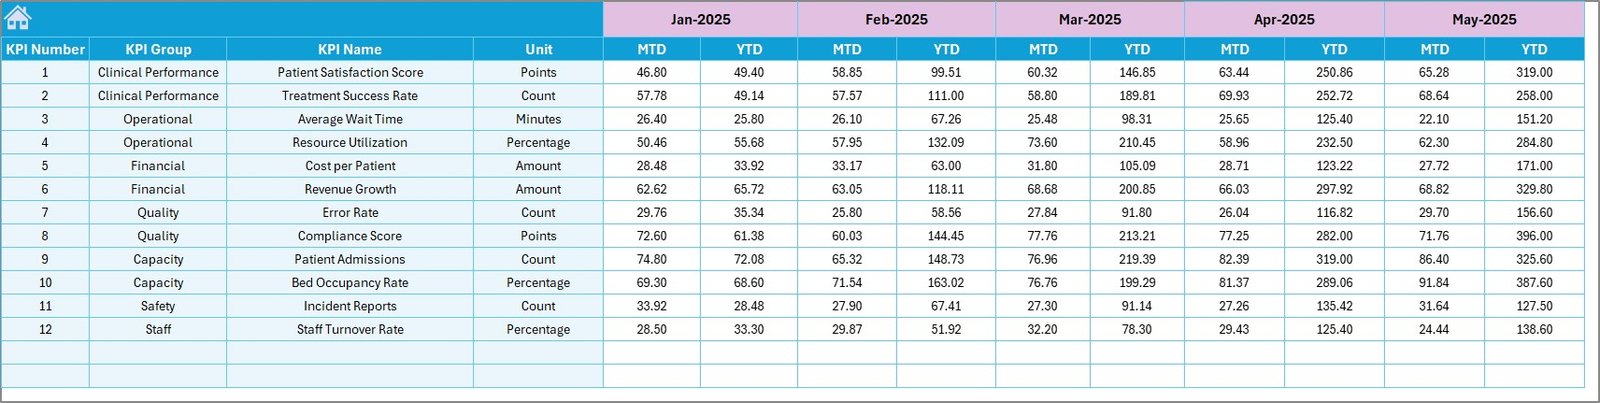
📊 MTD & YTD Tracking – Analyze Month-to-Date and Year-to-Date performance with ease.
🎯 Target vs Actual Comparison – Identify performance gaps quickly with visual indicators.
📉 Previous Year Comparison – Track growth and performance trends over time.
🔺 Conditional Formatting Indicators – Up/down arrows highlight performance instantly.
🧭 Easy Navigation System – Access all sheets quickly using the Summary Page buttons.
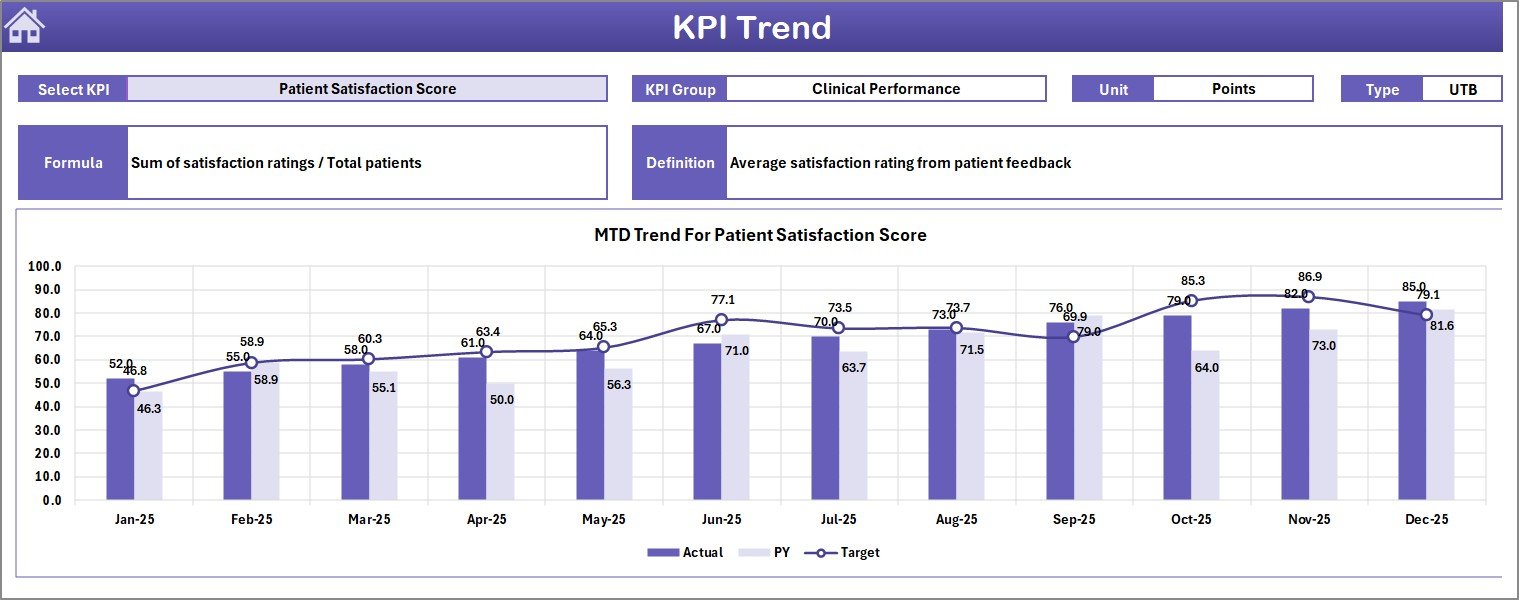
📈 KPI Trend Analysis – Understand patterns with MTD & YTD trend charts.
🧾 Structured Data Input Sheets – Maintain accuracy with organized data entry formats.
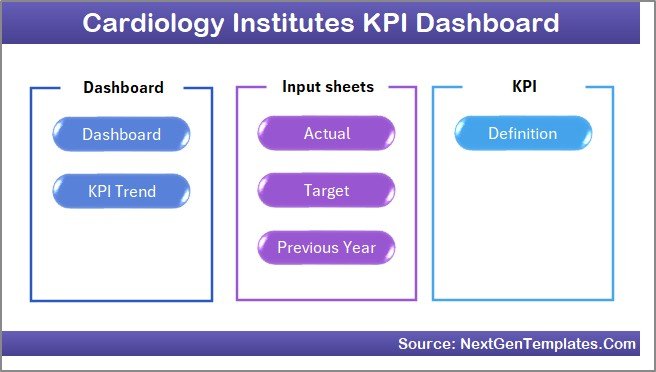
📦 What’s Inside the Cardiology Institutes KPI Dashboard in Excel
This powerful Excel template includes 7 well-structured worksheets designed for complete performance analysis:
📌 Summary Page – Navigation hub with quick-access buttons.
📌 Dashboard Sheet – Central KPI overview with dynamic metrics and comparisons.
📌 Trend Sheet – Detailed KPI performance trends and analysis.
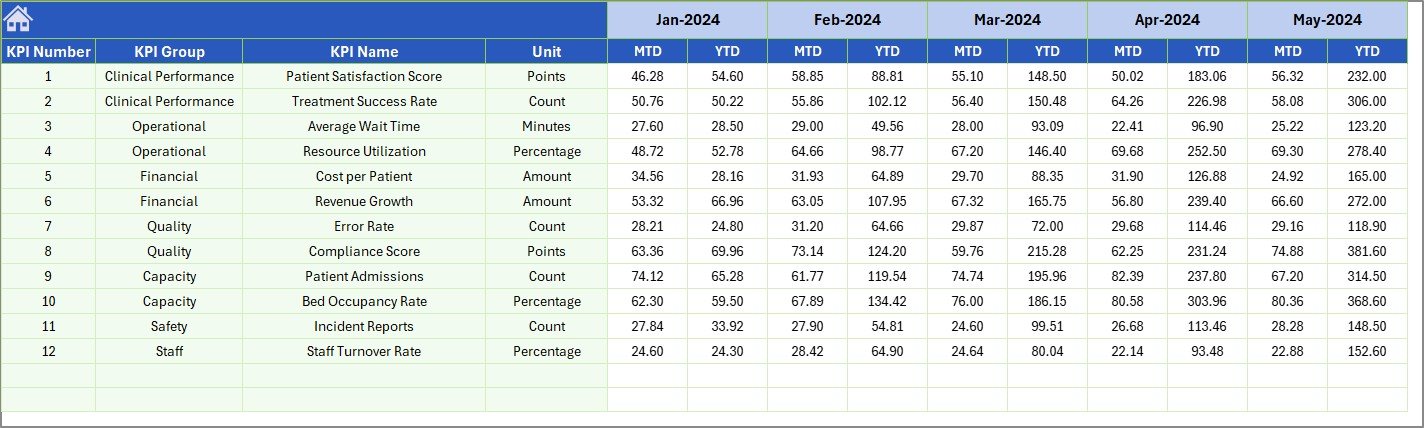
📌 Actual Data Sheet – Input actual MTD and YTD performance values.
📌 Target Sheet – Define monthly and yearly performance goals.
📌 Previous Year Sheet – Store historical data for comparison.
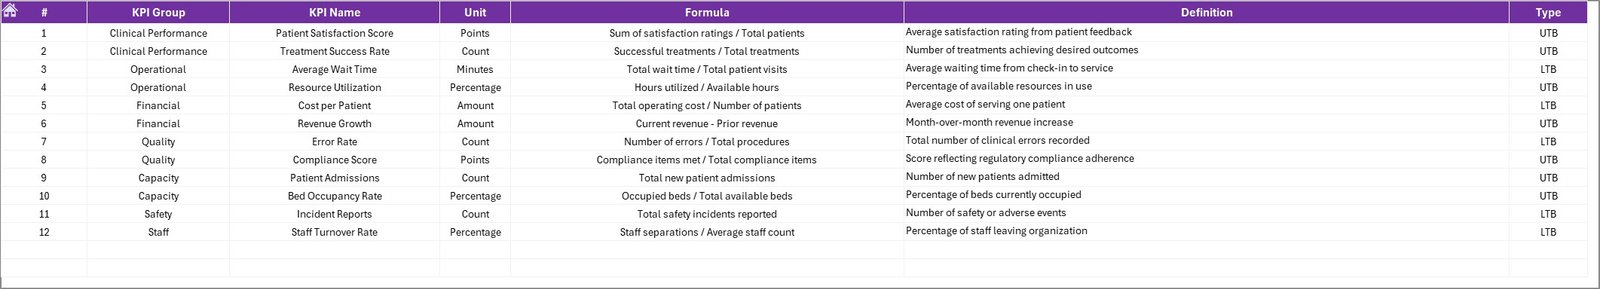
📌 KPI Definition Sheet – Define KPI names, formulas, and units.
Together, these sheets create a complete ecosystem for performance tracking and decision-making.
⚙️ How to Use the Cardiology Institutes KPI Dashboard in Excel
Using this dashboard is simple—even if you are not a technical expert.
👉 Step 1: Define KPIs
Enter KPI details such as name, formula, and unit in the KPI Definition sheet.
👉 Step 2: Set Targets
Input monthly targets in the Target sheet for performance benchmarking.
👉 Step 3: Enter Actual Data
Add real-time performance data in the Actual sheet.
👉 Step 4: Add Historical Data
Input previous year values for trend comparison.
👉 Step 5: Analyze the Dashboard
Select the month and instantly view insights, trends, and comparisons.
Within minutes, you’ll have a fully functional analytics system ready to support decision-making.
👥 Who Can Benefit from This Cardiology Institutes KPI Dashboard in Excel
🏥 Hospitals & Cardiology Centers – Monitor patient care performance effectively.
👨⚕️ Healthcare Managers – Make faster, data-driven decisions.
📊 Data Analysts – Analyze trends and identify improvement areas.
💼 Healthcare Administrators – Track operational and financial KPIs.
🏢 Medical Institutions – Improve efficiency and patient outcomes.
📈 Quality Control Teams – Monitor compliance and performance metrics.
If you want better visibility, faster insights, and improved healthcare outcomes—this dashboard is for you.
This dashboard is not just a reporting tool—it’s a decision-making engine. It transforms raw data into actionable insights, helping cardiology institutes improve efficiency, reduce delays, and enhance patient care.
💥 Stop relying on scattered spreadsheets.
💥 Start making smarter healthcare decisions today.
Click here to read the Detailed blog post
Watch the step-by-step video tutorial: