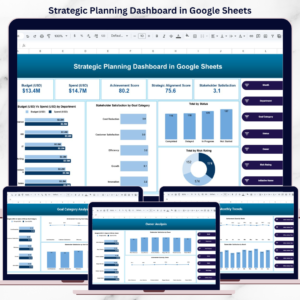
The Business Development Dashboard in Google Sheets is a powerful, ready-to-use analytics template designed to help businesses monitor, analyze, and improve their sales and operational performance. Modern organizations generate large volumes of business data including revenue, marketing spend, product sales, and regional performance. Without proper visualization tools, analyzing this data can become complex and time-consuming.
This dashboard solves that challenge by transforming raw business data into clear visual insights using charts, KPI cards, and interactive filters. Because the dashboard is built in Google Sheets, teams can collaborate in real time, update data easily, and instantly view updated performance metrics.
By simply updating the data in the source sheet, the dashboard automatically refreshes calculations and visualizations. This allows managers and decision-makers to quickly monitor key metrics and identify opportunities for growth.
Whether you are managing a growing business, analyzing sales performance, or monitoring product demand, this Business Development Dashboard in Google Sheets provides a simple and effective solution for data-driven decision making.
Key Features of the Business Development Dashboard
✔ Interactive Google Sheets dashboard with multiple analysis pages
✔ Automated calculations for revenue, profit, and business KPIs
✔ Multiple charts for visual business analysis
✔ Interactive filters for dynamic data exploration
✔ Organized layout for clear and professional reporting
✔ Easy data update through a centralized data sheet
✔ Real-time collaboration with team members
Dashboard Analysis Pages
This dashboard includes multiple analytical sections that help users explore business performance from different perspectives.
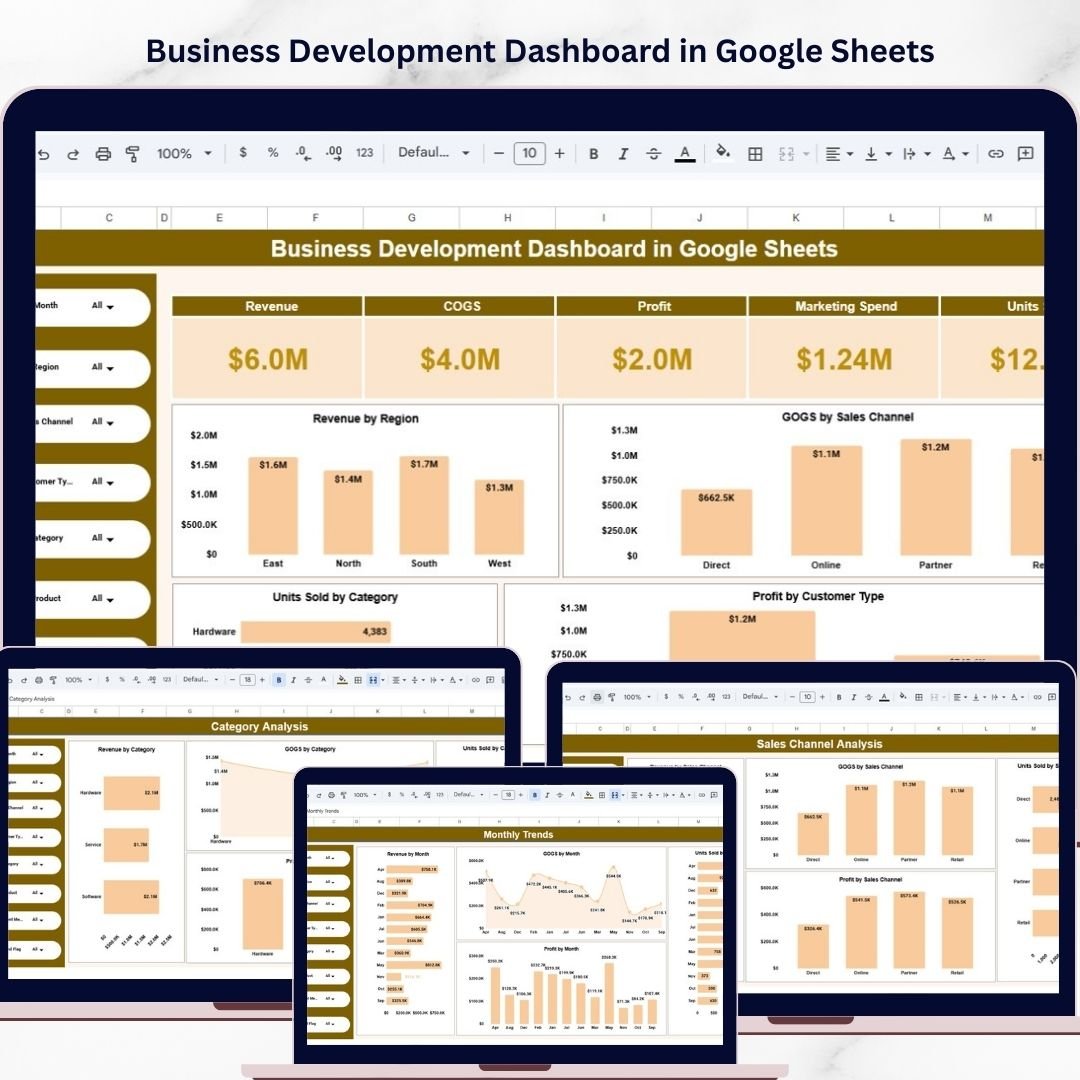
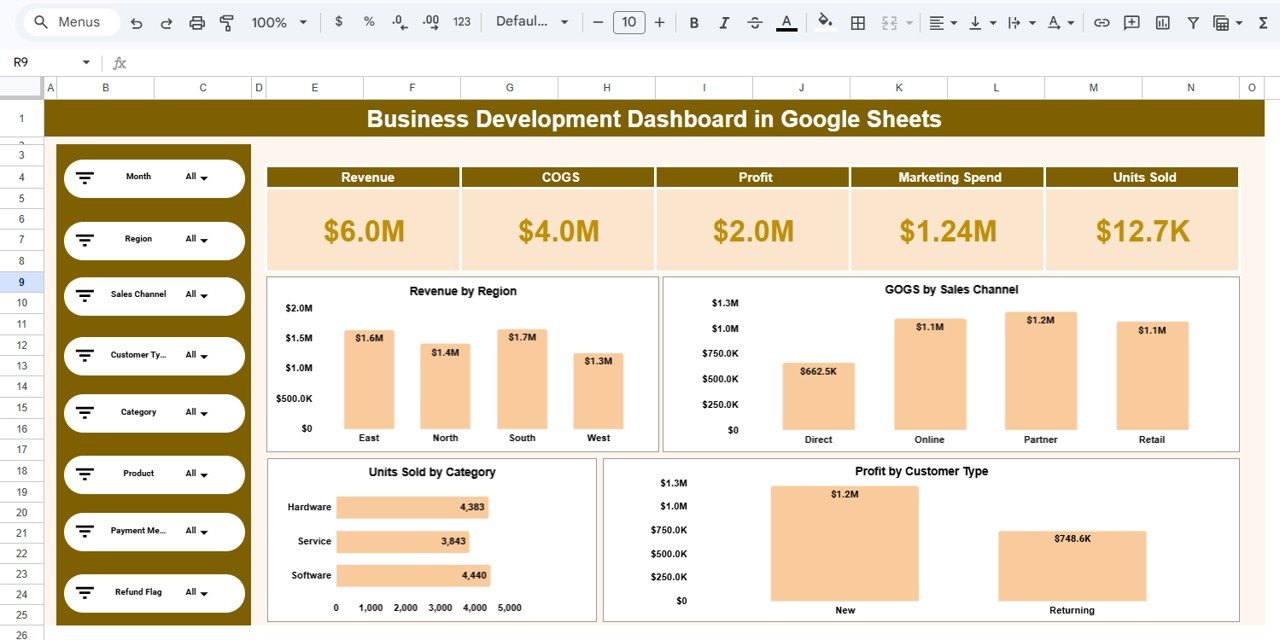
1️⃣ Overview Dashboard
The Overview Dashboard provides a high-level summary of the company’s overall business performance.
At the top of the dashboard, several KPI cards highlight the most important business metrics:
• Revenue – $6.0M
• Cost of Goods Sold (COGS) – $4.0M
• Profit – $2.0M
• Marketing Spend – $1.24M
• Units Sold – 12.7K
These KPIs allow executives and managers to quickly evaluate financial performance.
The dashboard also includes several interactive filters such as:
• Month
• Region
• Sales Channel
• Customer Type
• Product Category
• Product
• Payment Method
• Refund Status
Using these filters, users can instantly analyze specific segments of business data.
The Overview page also includes multiple charts such as:
• Revenue by Region
• COGS by Sales Channel
• Units Sold by Product Category
• Profit by Customer Type
These visual insights help organizations understand revenue distribution, product demand, and profitability.
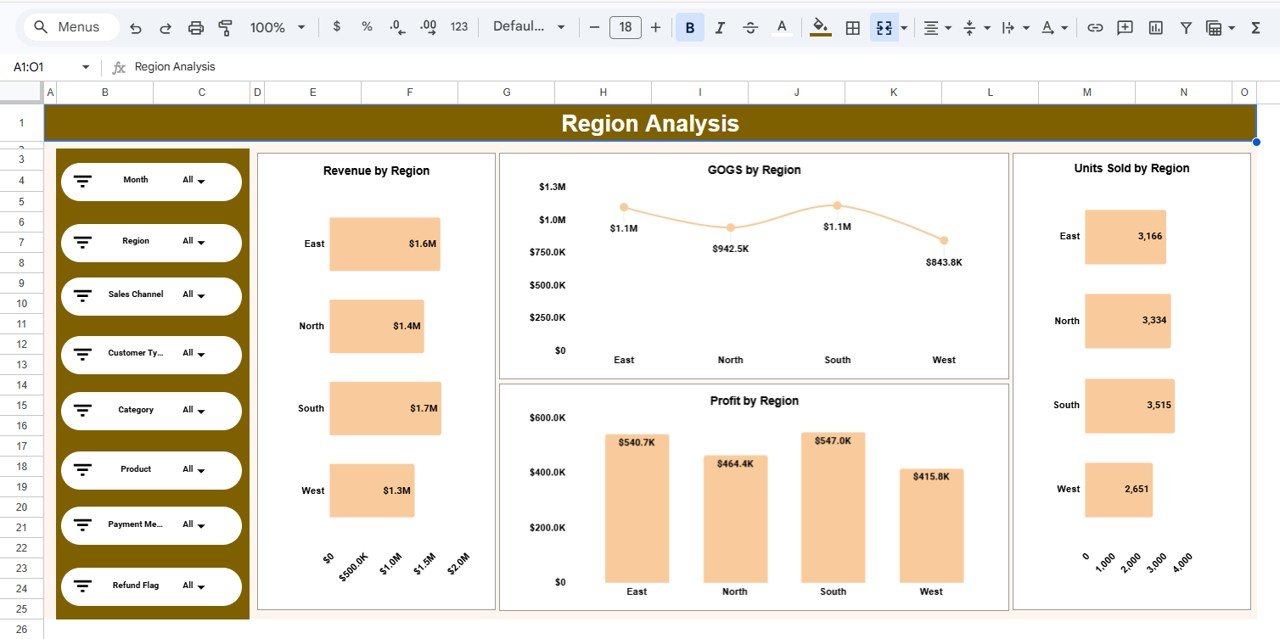
2️⃣ Region Analysis Dashboard
The Region Analysis Page focuses on geographic sales performance.
This section includes visual charts such as:
• Revenue by Region
• COGS by Region
• Profit by Region
• Units Sold by Region
Managers can use these insights to identify strong markets and underperforming regions. This helps businesses allocate marketing budgets and resources more effectively.
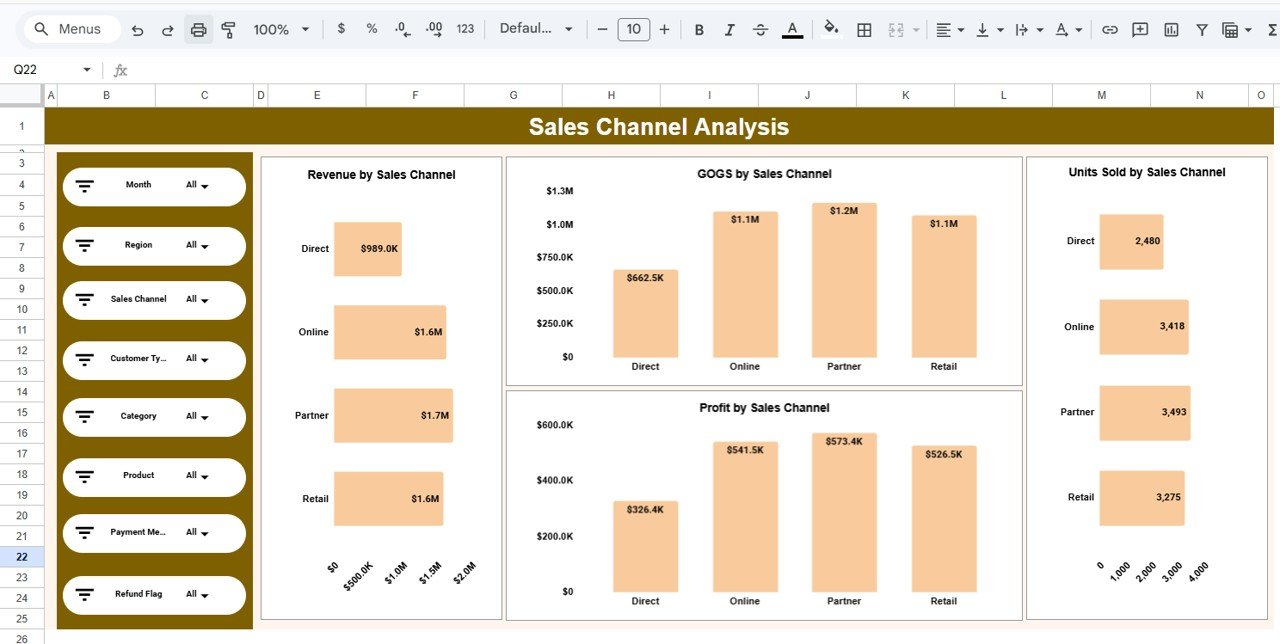
3️⃣ Sales Channel Analysis Dashboard
The Sales Channel Analysis Page analyzes performance across different distribution channels.
Charts included in this section:
• Revenue by Sales Channel
• COGS by Sales Channel
• Profit by Sales Channel
• Units Sold by Sales Channel
These insights help businesses understand which channels generate the highest revenue and which channels have higher operational costs.
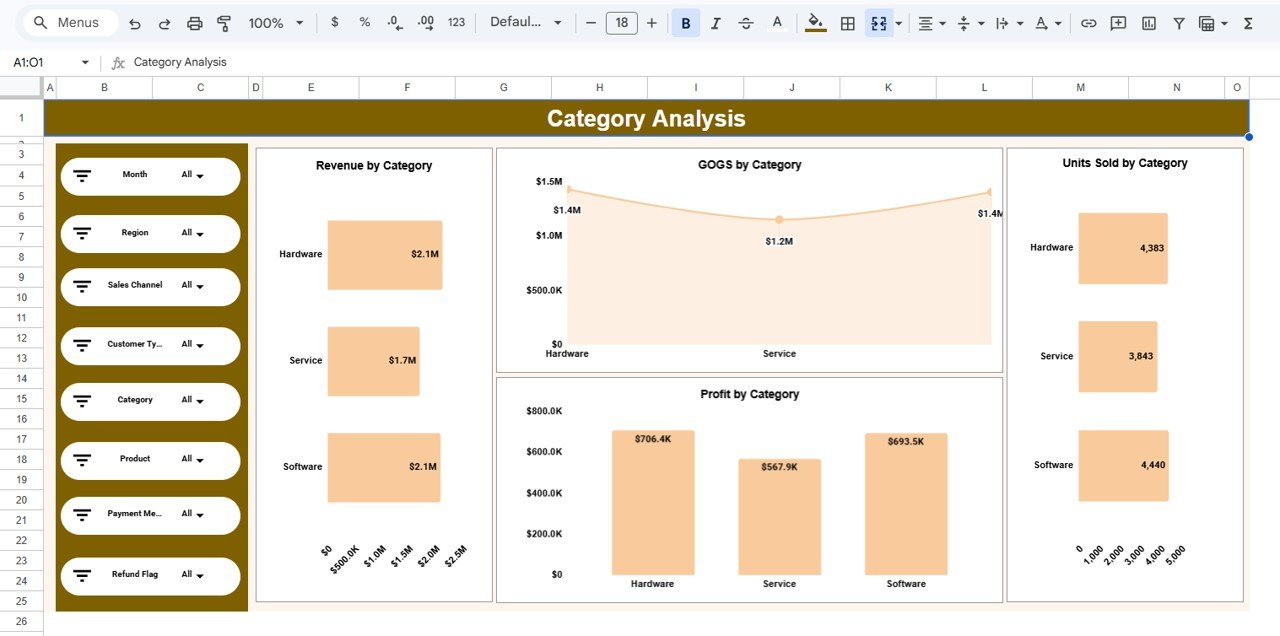
4️⃣ Category Analysis Dashboard
The Category Analysis Page evaluates product performance across different product categories.
This page includes charts such as:
• Revenue by Category
• COGS by Category
• Profit by Category
• Units Sold by Category
This analysis helps companies identify high-demand products and improve inventory planning.
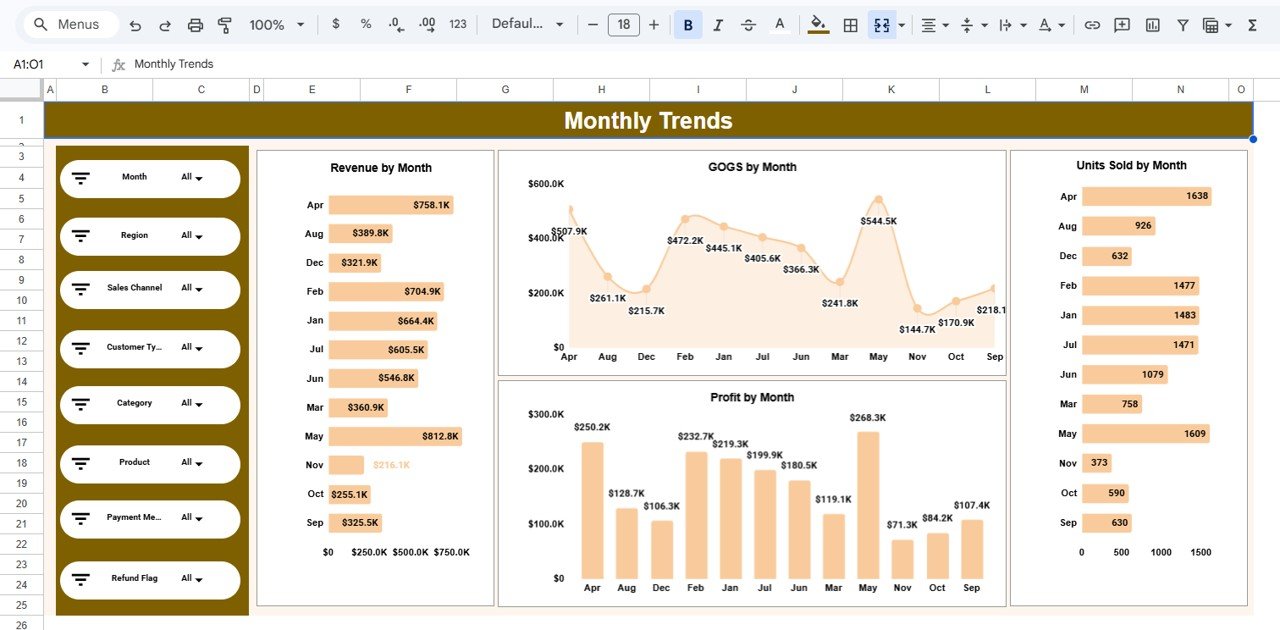
5️⃣ Monthly Trends Dashboard
The Monthly Trends Page analyzes how business performance changes throughout the year.
This section tracks:
• Revenue by Month
• COGS by Month
• Profit by Month
• Units Sold by Month
These insights allow businesses to identify seasonal trends, sales cycles, and revenue growth patterns.
Advantages of Using This Dashboard
✔ Real-Time Collaboration
Multiple users can access and update the dashboard simultaneously using Google Sheets.
✔ Easy Accessibility
Access the dashboard from any device with internet access.
✔ Automated Calculations
Formulas automatically update calculations when data is entered.
✔ Cost-Effective Business Intelligence Tool
Google Sheets provides powerful analytics without expensive BI software.
✔ Clear Data Visualization
Charts and KPI indicators simplify complex business data.
Opportunities for Improvement
Although this dashboard already provides powerful analytics capabilities, businesses can further enhance it by:
• Integrating CRM systems for automated data updates
• Adding predictive sales forecasting models
• Performing advanced customer segmentation analysis
• Implementing additional data visualization techniques
Best Practices for Using the Dashboard
To maximize the value of the dashboard, organizations should follow these best practices:
• Focus on key business KPIs rather than tracking too many metrics
• Maintain clean and accurate data for reliable insights
• Update the dashboard regularly to monitor performance
• Use interactive filters to explore different business segments
• Keep the dashboard layout organized for easier interpretation
Who Can Benefit From This Dashboard?
This dashboard is ideal for:
• Business Development Managers
• Sales Managers
• Marketing Analysts
• Business Owners
• Startup Teams
• Financial Analysts
• Strategy Teams
Conclusion
The Business Development Dashboard in Google Sheets provides a powerful solution for monitoring and analyzing business performance. By combining KPI metrics, charts, and interactive filters into a single dashboard, businesses can easily track revenue trends, evaluate sales channels, analyze product performance, and identify growth opportunities.
Because Google Sheets supports real-time collaboration, automated calculations, and cloud accessibility, teams can work together efficiently and make faster, data-driven decisions.
Organizations that adopt data-driven dashboards like this can significantly improve strategic planning, optimize operations, and drive long-term business growth.
Click here to Read detailed blog post
Watch the step-by-step video tutorial:
Visit our YouTube channel to learn step-by-step video tutorials