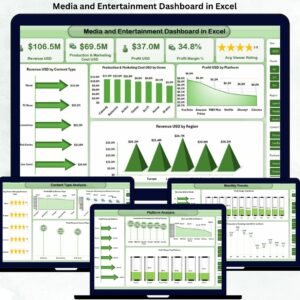
In today’s fast-moving media and entertainment industry, broadcasting decisions must be driven by data—not assumptions. Broadcasting Dashboard manage multiple channels, programs, languages, advertisers, regions, and time slots every single month. However, when broadcasting data remains scattered across spreadsheets or manual reports, visibility drops quickly. As a result, teams struggle to track TRP performance, advertising revenue, and scheduling efficiency.
That is exactly where a Broadcasting Dashboard in Excel becomes a powerful and essential decision-making tool.
This ready-to-use Broadcasting Dashboard in Excel converts raw broadcasting data into clear visuals, KPI cards, and interactive analysis. Instead of reviewing multiple Excel files or static reports, broadcasters can monitor TRP ratings, advertisement revenue, broadcast volume, postponed shows, and performance trends from one centralized dashboard.
Because the dashboard is built entirely in Microsoft Excel, it remains cost-effective, flexible, and easy to use. Users simply update the data sheet, refresh pivot tables, and instantly access updated insights—without complex formulas, VBA, or BI software.
📡 Key Features of Broadcasting Dashboard in Excel
This dashboard is designed for both operational monitoring and strategic review.
📊 Excel-based interactive dashboard with pivot charts
🎯 Centralized tracking of broadcasting KPIs
🧭 Page Navigator for smooth navigation
📌 KPI cards for quick performance insights
🎛️ Right-side slicers for dynamic filtering
📈 Channel, program, advertiser & time analysis
🌍 Region-wise revenue visibility
📅 Monthly trend and seasonality analysis
🗂️ What’s Inside the Broadcasting Dashboard in Excel
The dashboard includes 5 professionally designed analytical pages, along with structured backend sheets.
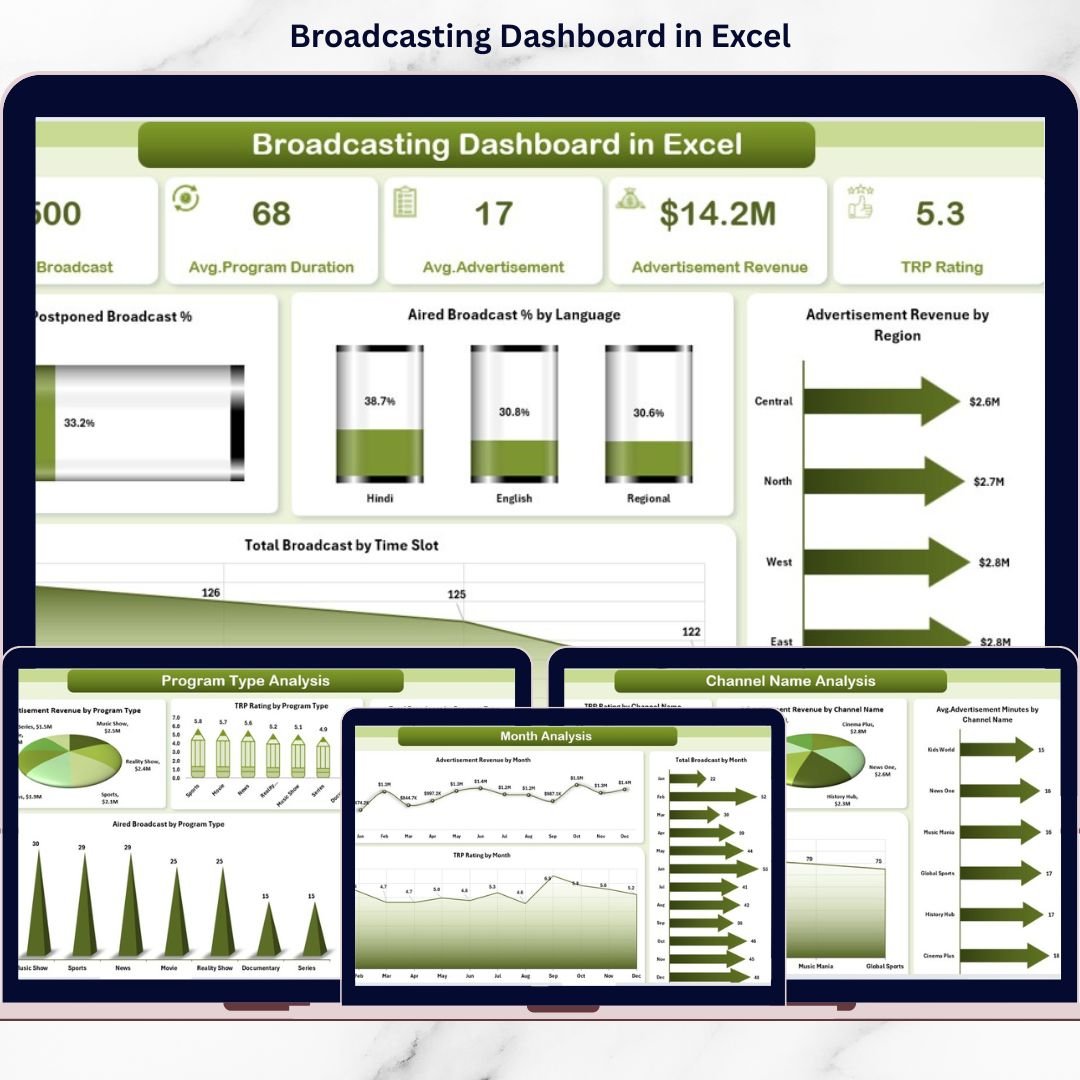
📍 1. Overview Page – Broadcasting Performance Snapshot
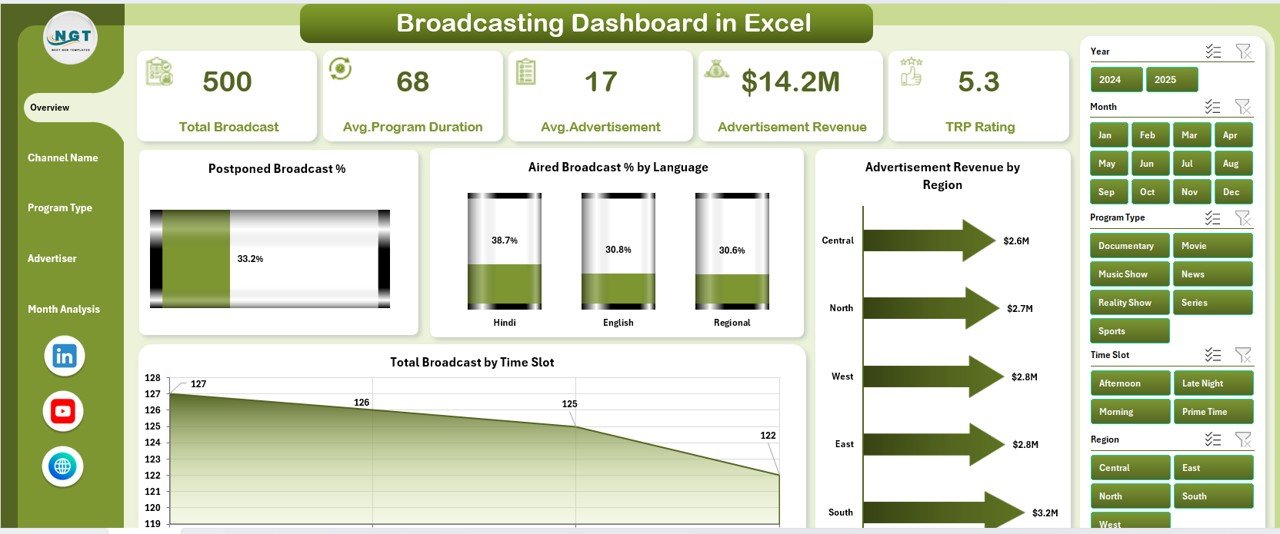
This page acts as the control center of the dashboard.
KPI & Charts Included
-
📉 Postponed Broadcast %
-
🗣️ Aired Broadcast % by Language
-
💰 Advertisement Revenue by Region
-
⏰ Total Broadcast by Time Slot
This page helps leadership quickly assess scheduling efficiency, regional revenue contribution, and broadcast distribution.
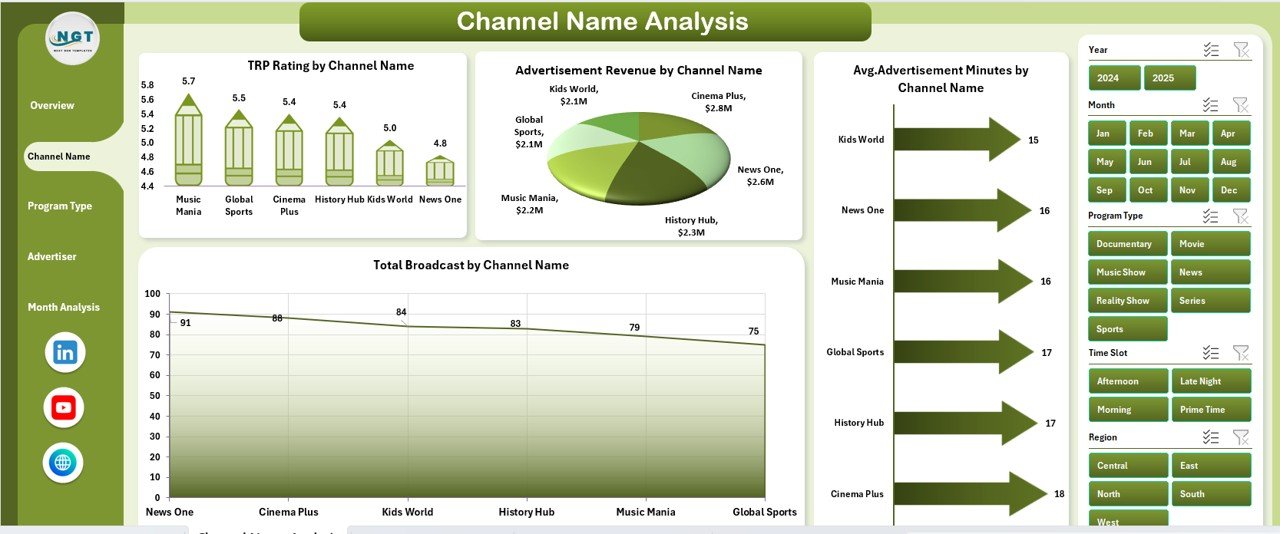
📺 2. Channel Name Analysis – Channel-Wise Performance
This page analyzes performance at the individual channel level.
Charts Included
-
📊 TRP Rating by Channel Name
-
💰 Advertisement Revenue by Channel Name
-
⏱️ Average Advertisement Minutes by Channel
-
📡 Total Broadcast by Channel Name
It helps identify high-performing channels and optimize advertising inventory.
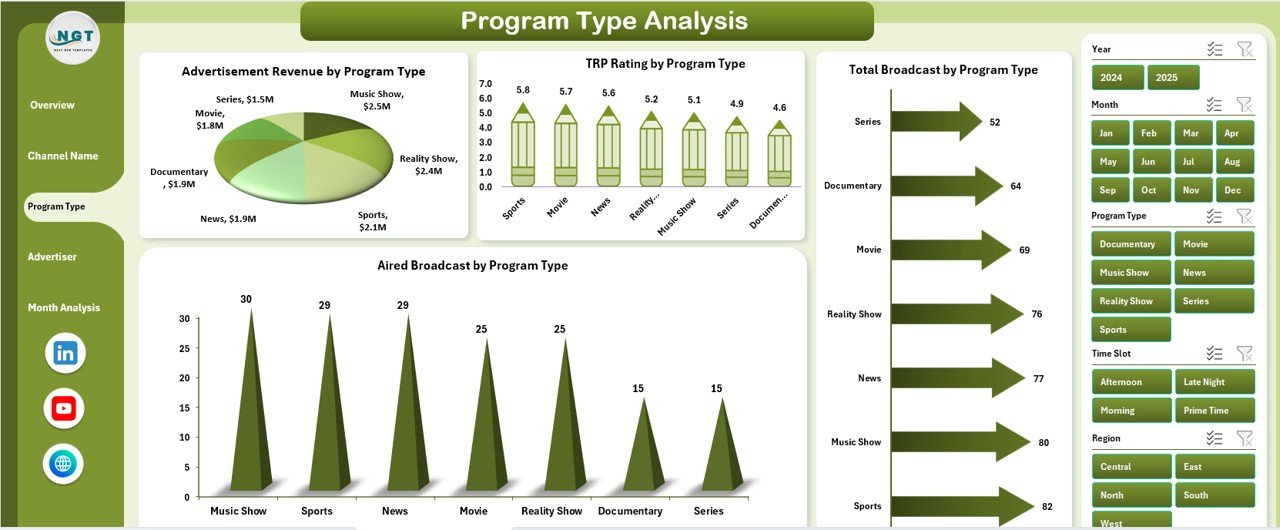
🎬 3. Program Type Analysis – Content Performance Insights
Different program types attract different audiences and advertisers.
Charts Included
-
📈 TRP Rating by Program Type
-
💵 Advertisement Revenue by Program Type
-
📡 Total Broadcast by Program Type
-
✔️ Aired Broadcast by Program Type
This page supports content planning, scheduling, and production decisions.
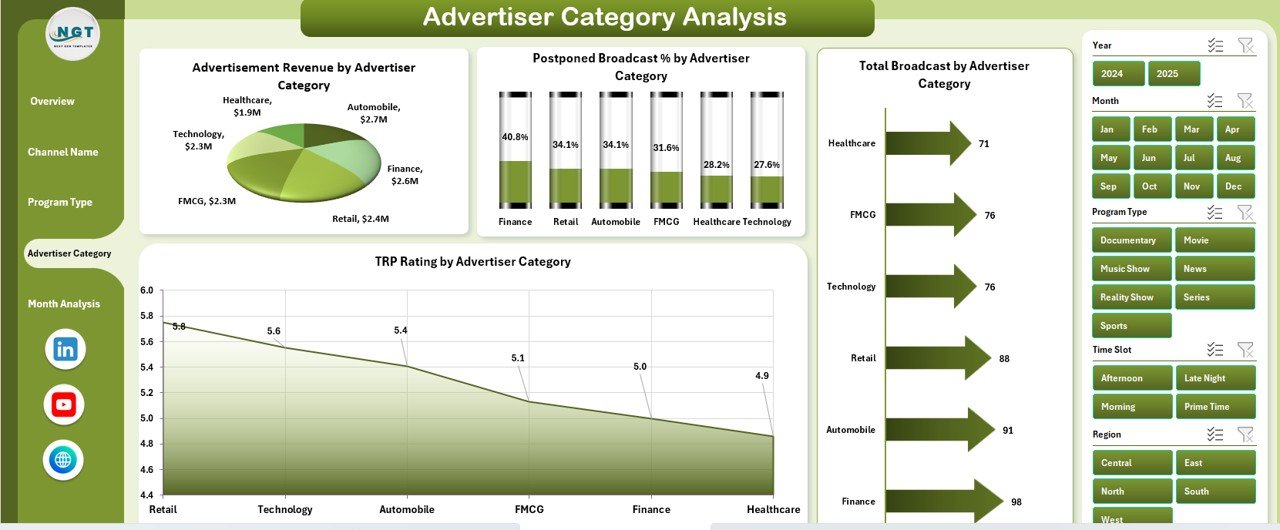
🏷️ 4. Advertiser Category Analysis – Revenue Optimization
This page focuses on advertiser-driven performance.
Charts Included
-
📊 TRP Rating by Advertiser Category
-
💰 Advertisement Revenue by Advertiser Category
-
📡 Total Broadcast by Advertiser Category
-
✔️ Aired Broadcast by Advertiser Category
Sales teams use this page to identify high-value advertiser segments and growth opportunities.
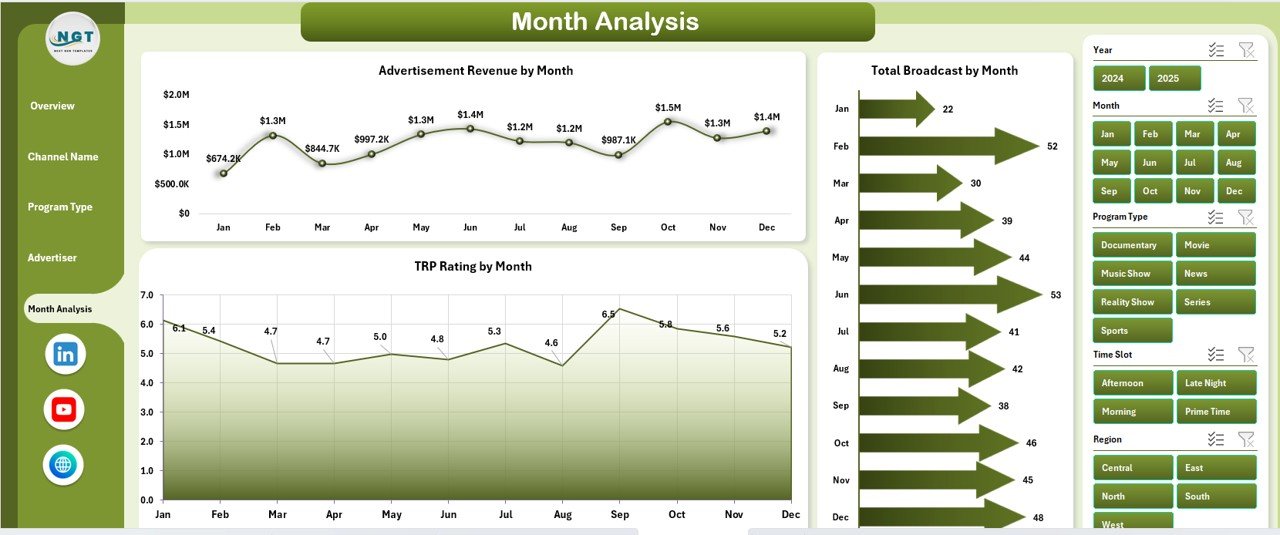
📅 5. Month Analysis – Trend & Seasonality View
Broadcasting performance changes throughout the year.
Charts Included
-
📈 TRP Rating by Month
-
💰 Advertisement Revenue by Month
-
📡 Total Broadcast by Month
This page helps forecast demand, plan schedules, and align sales campaigns with seasonal trends.
▶️ How to Use the Broadcasting Dashboard in Excel
Using the dashboard is simple and intuitive:
1️⃣ Update broadcasting data in the Data Sheet
2️⃣ Refresh pivot tables (one click)
3️⃣ Use slicers to filter by channel, program type, advertiser category, region, or month
4️⃣ Review KPIs and charts instantly
5️⃣ Take faster, data-driven decisions
No advanced Excel or technical skills are required.
👥 Who Can Benefit from This Broadcasting Dashboard?
This dashboard is ideal for:
✔ TV Broadcasting Networks
✔ Radio Stations
✔ Media & Entertainment Companies
✔ Programming Teams
✔ Advertisement Sales Teams
✔ Media Analysts & Managers
Both small broadcasters and large media networks can use and scale this dashboard easily.
🚀 Business Advantages
Using this dashboard helps broadcasters:
-
Improve TRP & content planning
-
Optimize advertising revenue
-
Reduce postponed broadcasts
-
Improve regional sales focus
-
Save reporting time
-
Strengthen strategic decisions
### 📘 Click here to read the Detailed blog post
📺 Visit our YouTube channel to learn step-by-step video tutorials
👉 https://youtube.com/@PKAnExcelExpert