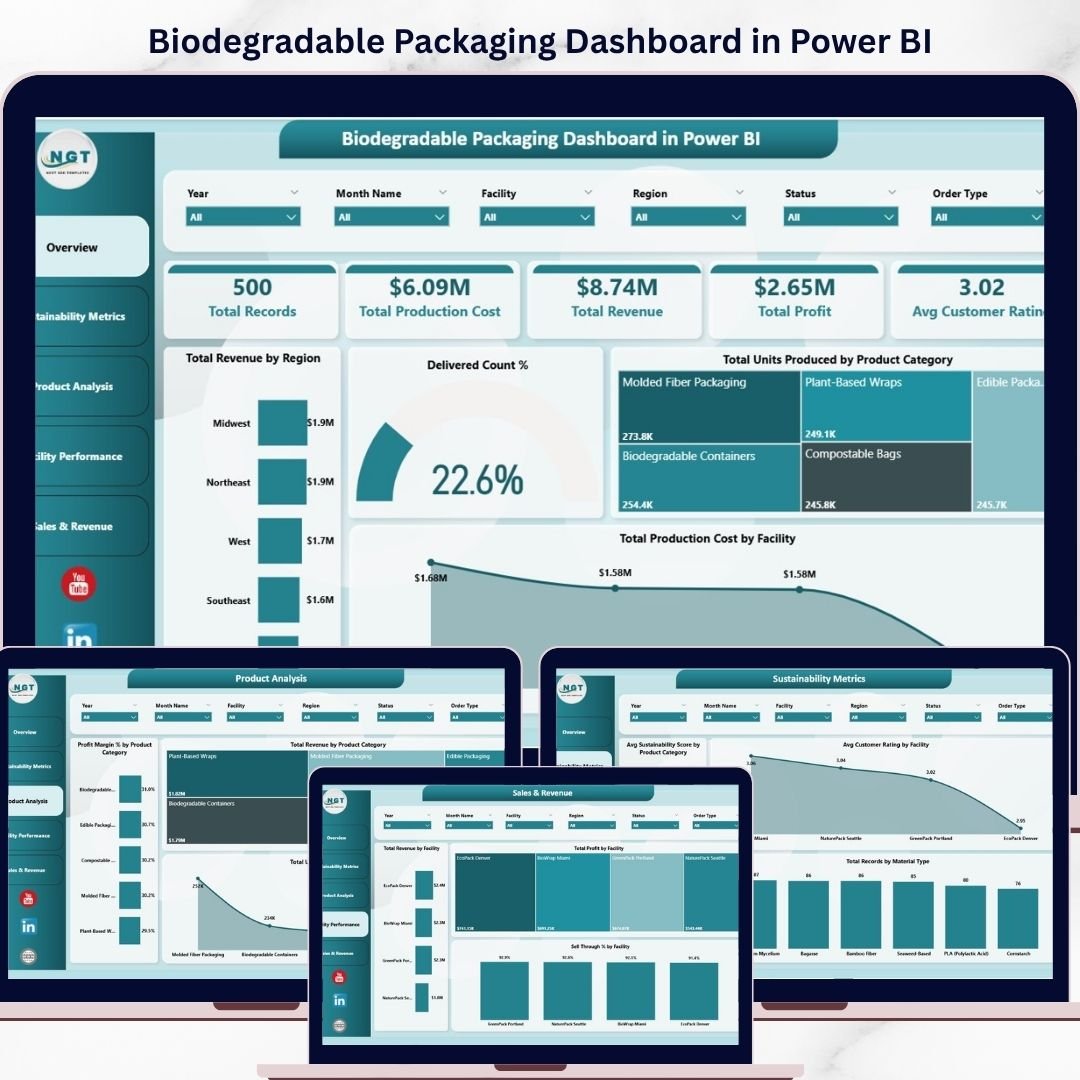

Key Features of Biodegradable Packaging Dashboard in Power BI
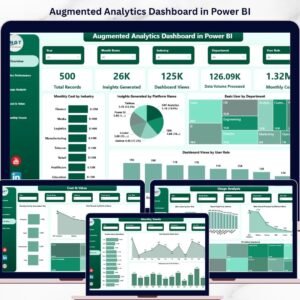
Unlock the power of data visualization with our Biodegradable Packaging Dashboard in Power BI, a ready-to-use, comprehensive digital solution designed to streamline your packaging analytics. This dashboard enables you to effortlessly update your data by simply refreshing the Power BI file after connecting it with your data source. No complex setup required – just import your data, refresh, and watch the insights come alive!
Featuring multiple interactive pages, this dashboard is tailored to provide a holistic view of your biodegradable packaging operations, costs, sustainability metrics, and sales performance. The intuitive design incorporates high-level summary cards, dynamic charts, and multiple slicers for quick filtering, enabling you to make confident, data-driven decisions.
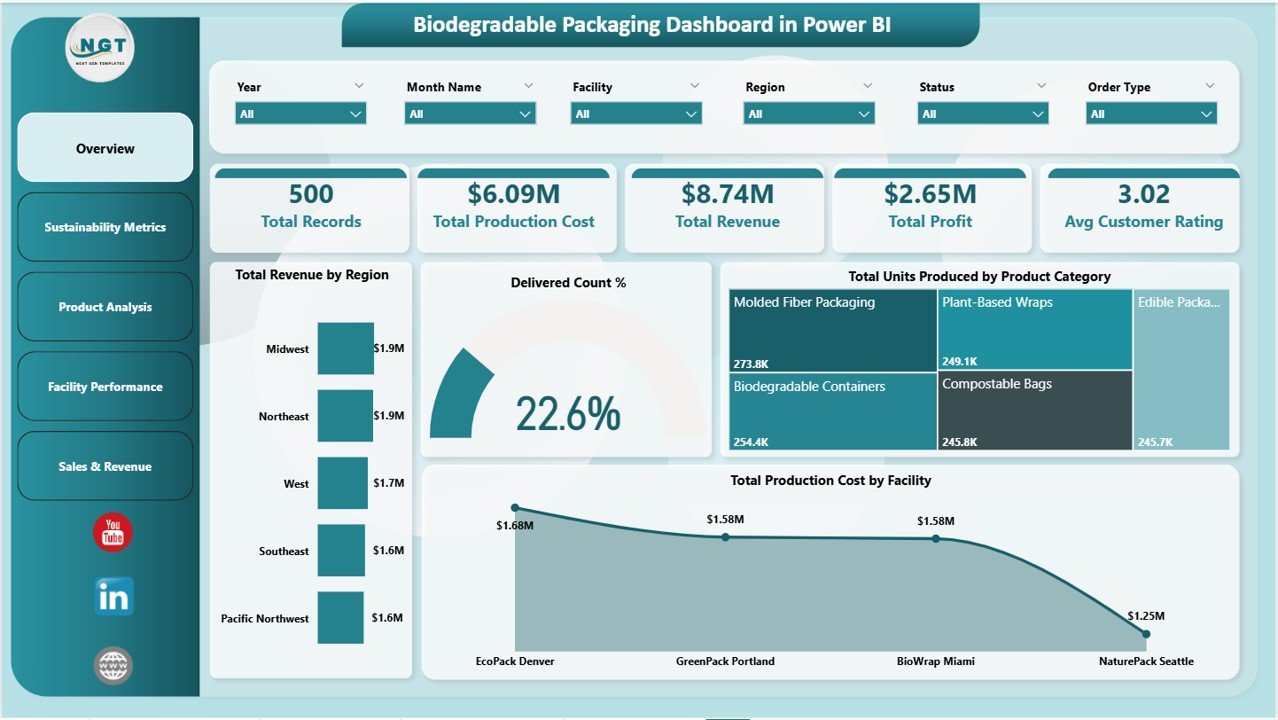
Overview Page
This page offers a snapshot of your entire packaging business through key metrics displayed as cards:
- 📊 Total Records: Track the total number of packaging records processed.
- 💰 Total Production Cost: Monitor overall production expenses.
- 📈 Total Revenue: See your revenue generated across regions and products.
- 💵 Total Profit: Analyze your profitability at a glance.
- ⭐ Avg Customer Rating: Gauge customer satisfaction effectively.
Charts include:
- Total Revenue by Region: Visualize revenue distribution across different geographic areas to identify lucrative markets.
- Delivered Count %: Understand delivery efficiency and fulfillment rates.
- Total Units Produced by Product Category: Analyze production volumes by category to optimize inventory.
- Total Production Cost by Facility: Compare cost efficiencies among facilities.
Biodegradable Packaging Dashboard in Power BI
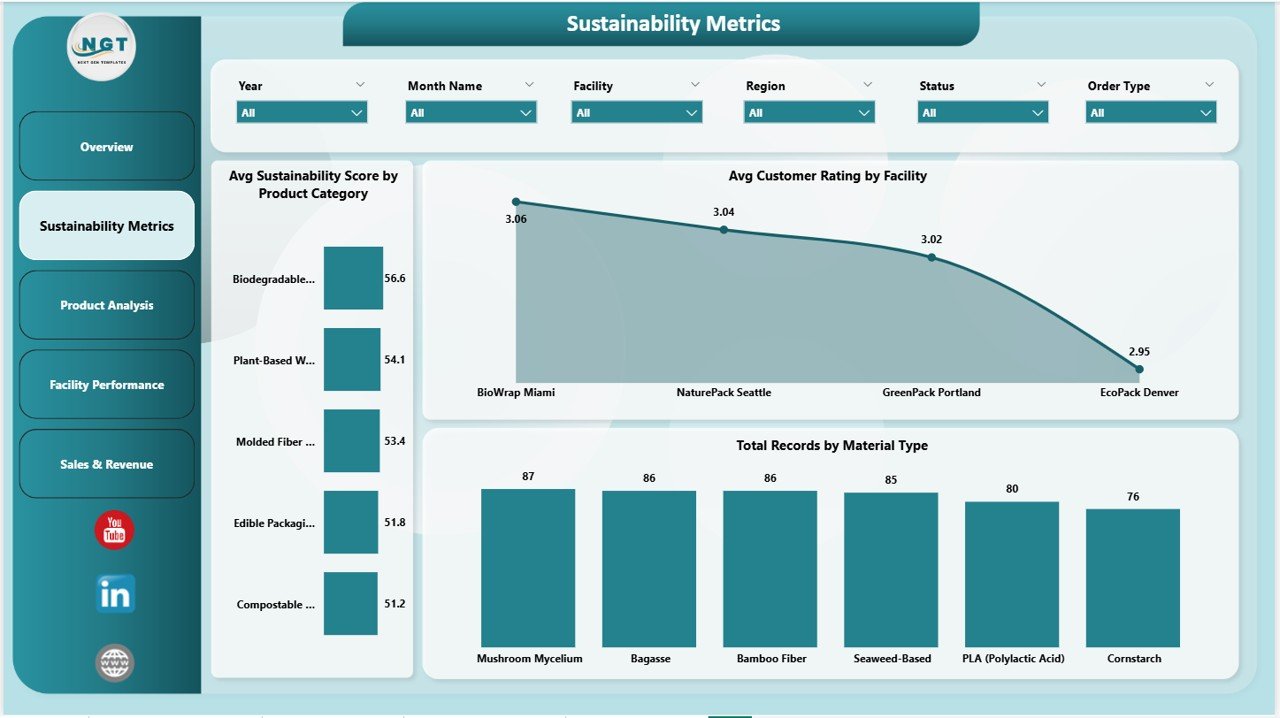
Sustainability Metrics
Focus on eco-friendly insights with charts like:
- 🌿 Avg Sustainability Score by Product Category: Measure environmental impact per category.
- 🏭 Avg Customer Rating by Facility: Correlate sustainability efforts with customer satisfaction at specific sites.
- 🔍 Total Records by Material Type: Track usage of biodegradable materials efficiently.
Sustainability Metrics
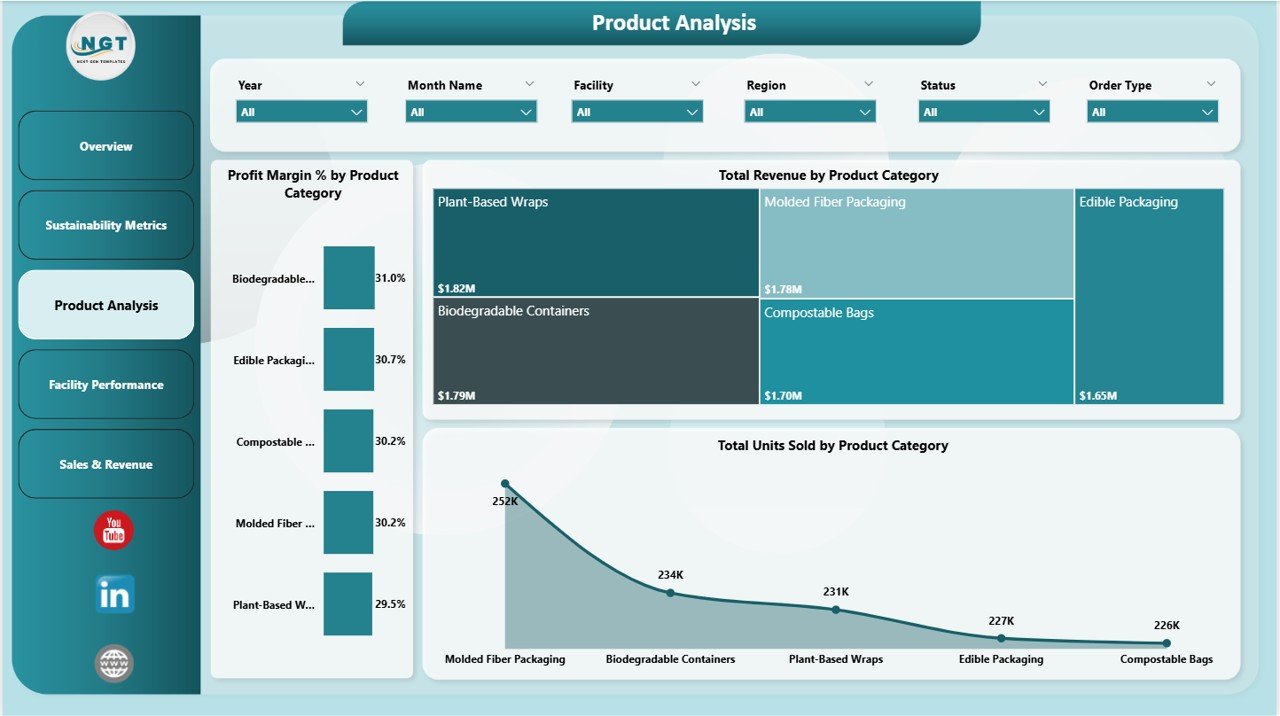
Product Analysis
Unlock deep product insights with:
- 📊 Profit Margin % by Product Category: Identify your most profitable product lines.
- 💼 Total Revenue by Product Category: Assess sales performance across categories.
- 📦 Total Units Sold by Product Category: Track product demand trends for strategic planning.
Product Analysis
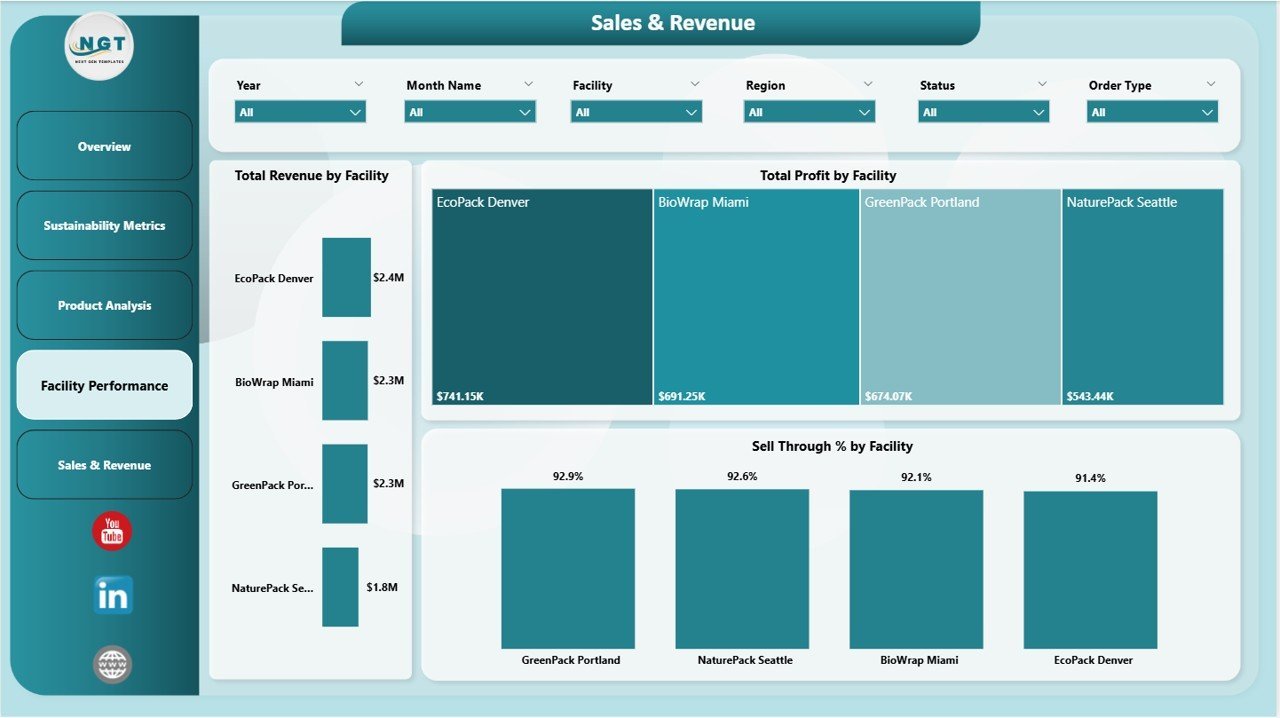
Facility Performance
Compare your facilities efficiently with metrics like:
- 🏭 Total Revenue by Facility: Identify top-performing locations.
- 💵 Total Profit by Facility: Measure profitability across sites.
- 📈 Sell Through % by Facility: Evaluate inventory turnover and sales efficiency.

Facility Performance
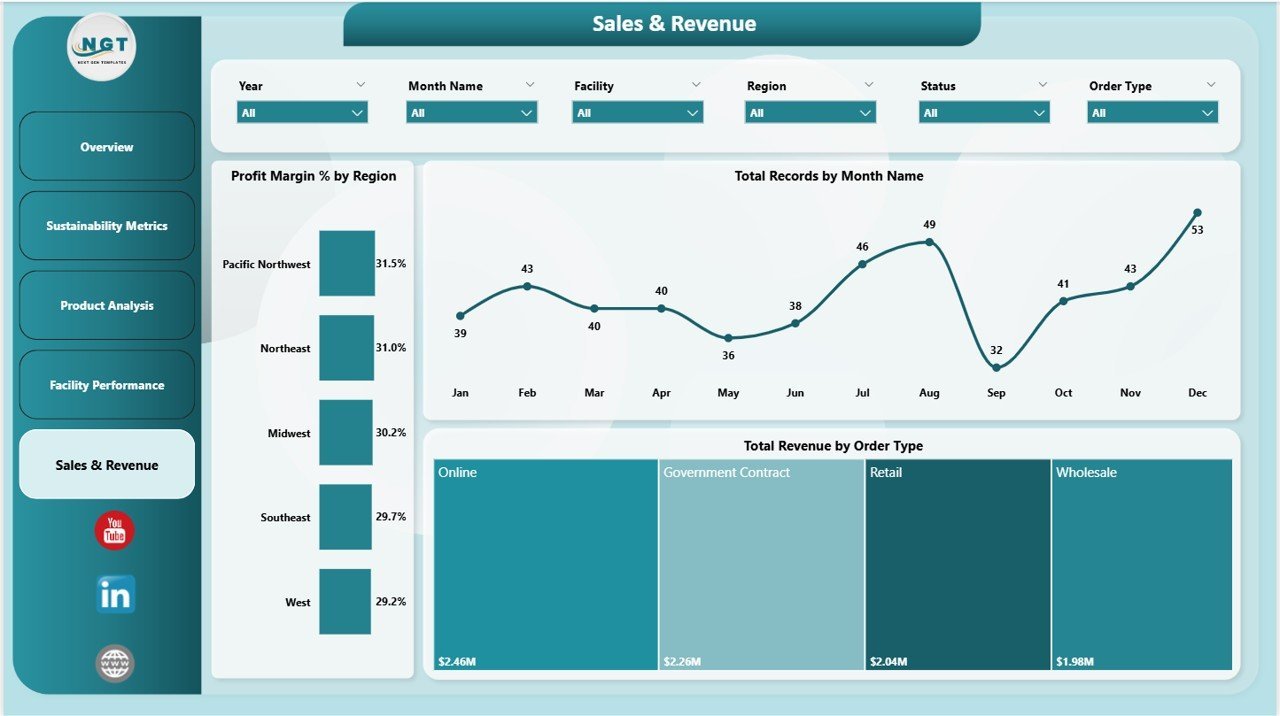
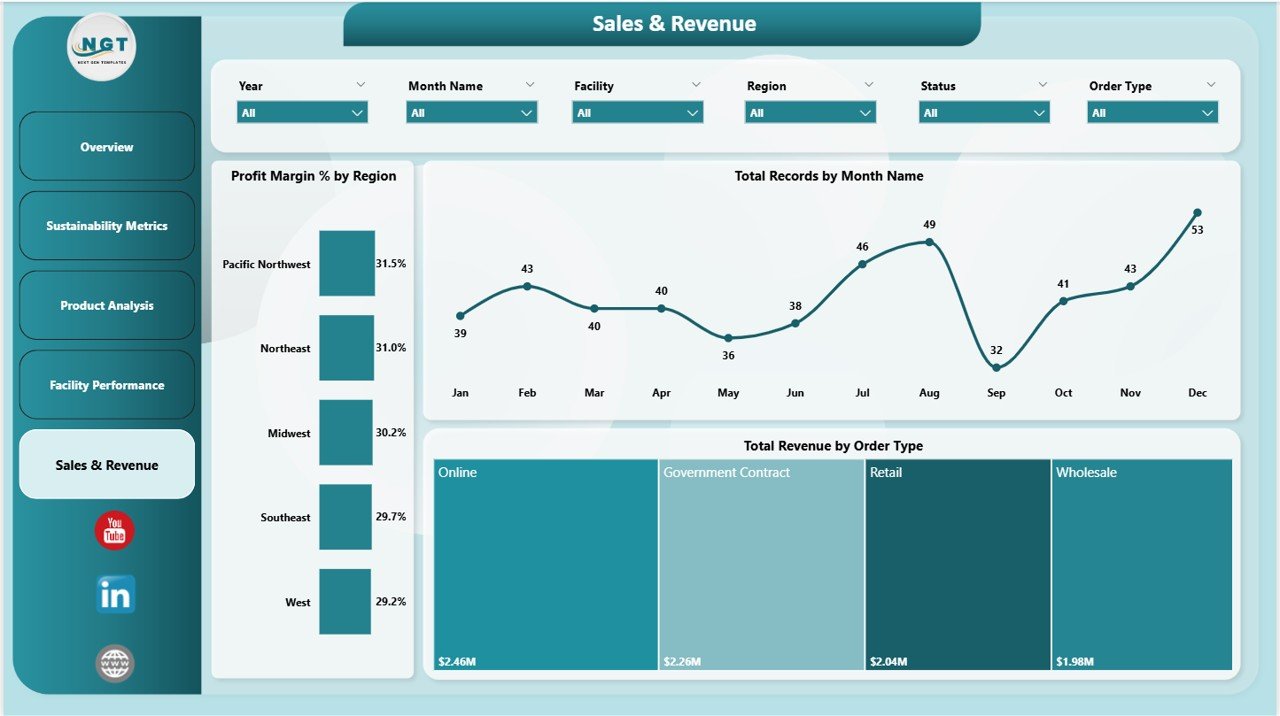
Sales & Revenue
Monitor sales trends and margins with:
- 🌍 Profit Margin % by Region: Pinpoint geographic profitability variations.
- 📅 Total Records by Month Name: Track monthly sales and production volumes.
- 🛒 Total Revenue by Order Type: Analyze revenue streams by different order categories.
Sales & Revenue
What’s Inside the Biodegradable Packaging Dashboard in Power BI
This package includes:
- 📂 A fully interactive Power BI dashboard file ready for your data updates
- 📊 Multiple detailed pages covering Overview, Sustainability, Product, Facility, and Sales analytics
- 🔄 Easy-to-refresh data connection setup-no technical expertise required
- 🎛️ Multiple slicers for quick data filtering and customized views
- 📈 Visually engaging charts and high-level KPI cards for instant insights
How to Use the Biodegradable Packaging Dashboard in Power BI
Getting started is simple:
- 🔗 Connect your data file with the Power BI template
- 🔄 Hit the Refresh button on the Home tab to update all visuals automatically
- 🎯 Use slicers to filter data by regions, products, facilities, and timeframes
- 📊 Analyze the charts and cards to uncover trends, identify inefficiencies, and optimize production
- 💡 Export insights and reports as needed for presentations or decision-making
Who Can Benefit from This Biodegradable Packaging Dashboard in Power BI
This dashboard is ideal for:
- 🏢 Packaging manufacturers looking to track costs, production, and sustainability metrics
- 🌱 Sustainability officers aiming to monitor eco-friendly initiatives and material usage
- 📈 Sales and marketing teams wanting to analyze revenue and customer ratings by region and product
- 🏭 Facility managers who need to evaluate performance and profitability across multiple sites
- 📊 Business analysts seeking a ready-made, customizable dashboard for biodegradable packaging data
Click here to read the Detailed blog post.
Visit our YouTube channel to learn step-by-step video tutorials


Reviews
There are no reviews yet.