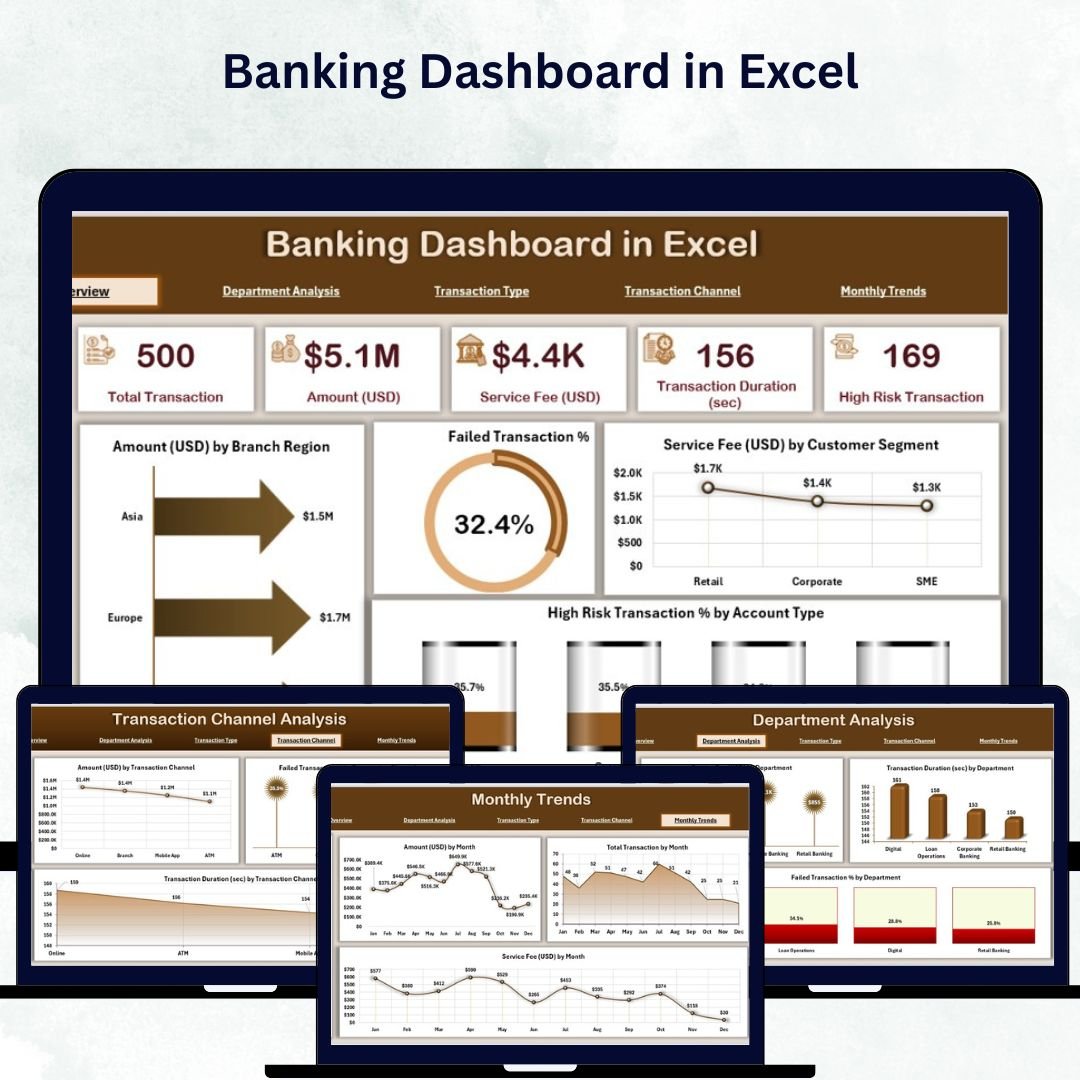
In today’s fast-paced financial world, banks need real-time insights to make smarter decisions. Spreadsheets and manual reports often delay critical actions — that’s why the Banking Dashboard in Excel is the perfect solution. This ready-to-use analytical tool turns complex banking data into interactive visuals, helping you monitor key performance indicators (KPIs), branch performance, customer satisfaction, and risk — all in one clean, automated interface.
Built with pivot tables, formulas, and dynamic charts, this dashboard simplifies data analysis and delivers clear, actionable insights without any coding or BI software. Whether you’re tracking transactions, analyzing revenue, or monitoring risk exposure, this Excel dashboard puts the power of data-driven decision-making right at your fingertips.
⚙️ Key Features of Banking Dashboard in Excel
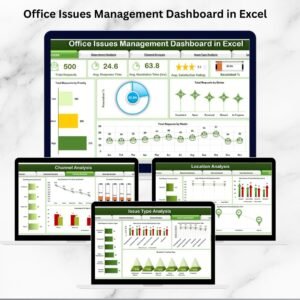
✅ 📊 Five Analytical Pages – Get 360° visibility with dedicated pages for Overview, Department Analysis, Transaction Type, Channel Analysis, and Monthly Trends.
✅ 📍 Page Navigator – Effortlessly switch between dashboard pages using the left-side navigation panel.
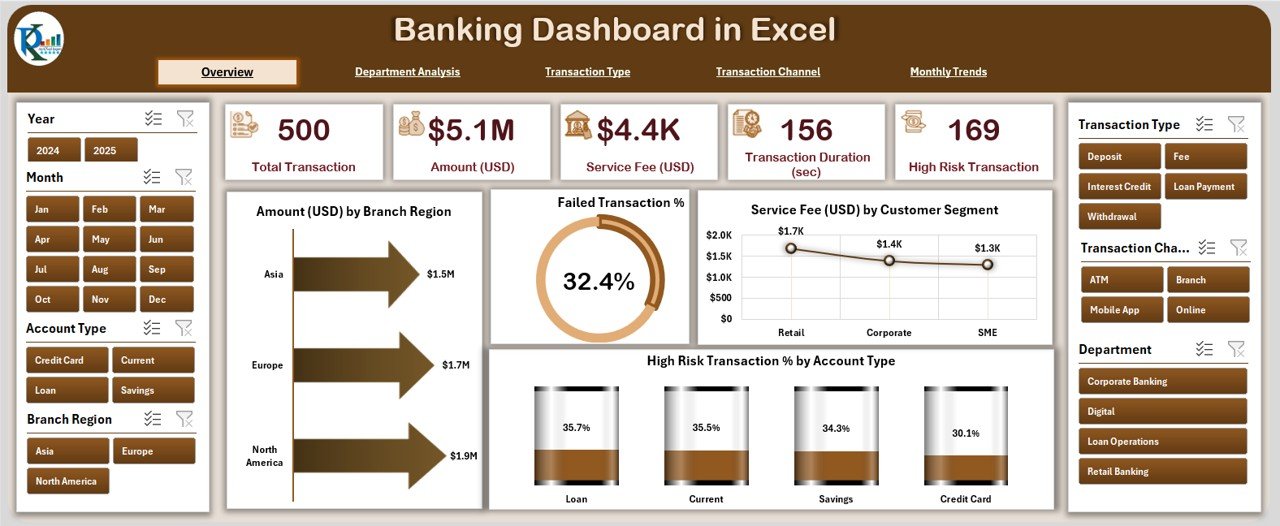
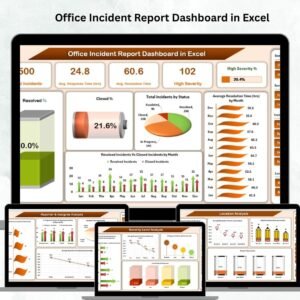
✅ 📈 Interactive KPI Cards – View Total Transactions, Failed Transaction %, Service Fee (USD), and other vital figures instantly.
✅ 🔍 Dynamic Slicers – Filter data by Region, Branch, Month, or Customer Segment for quick, custom analysis.
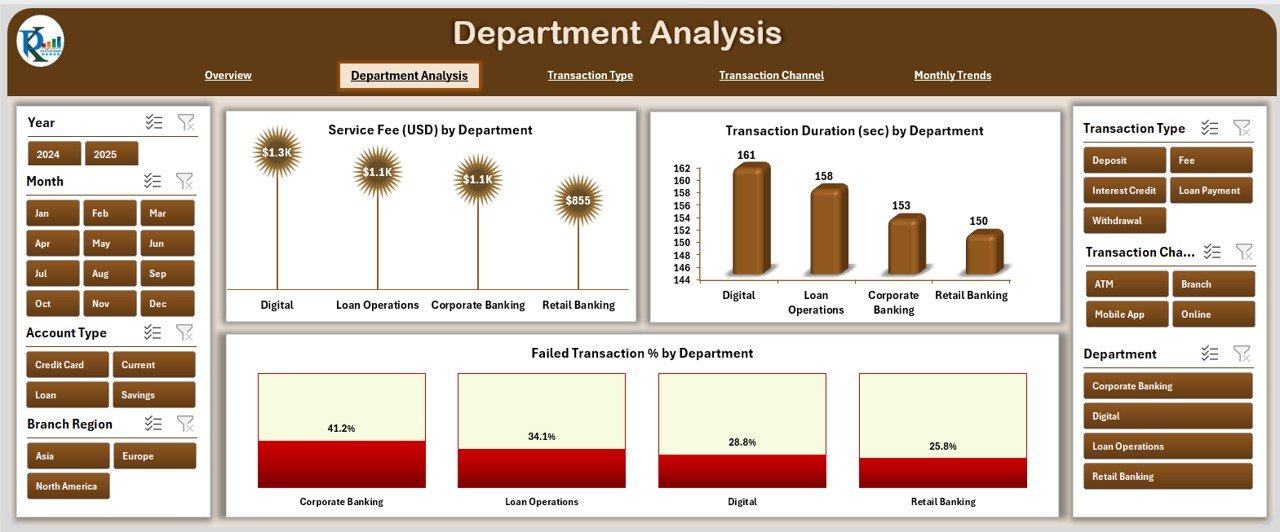
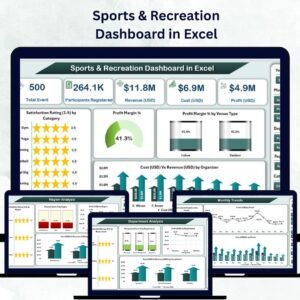
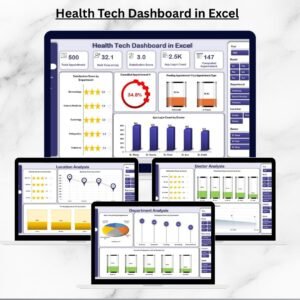
✅ 🏢 Departmental Analysis – Compare performance across Retail, Corporate, and Investment Banking departments with satisfaction ratings, event completion %, and profit visuals.
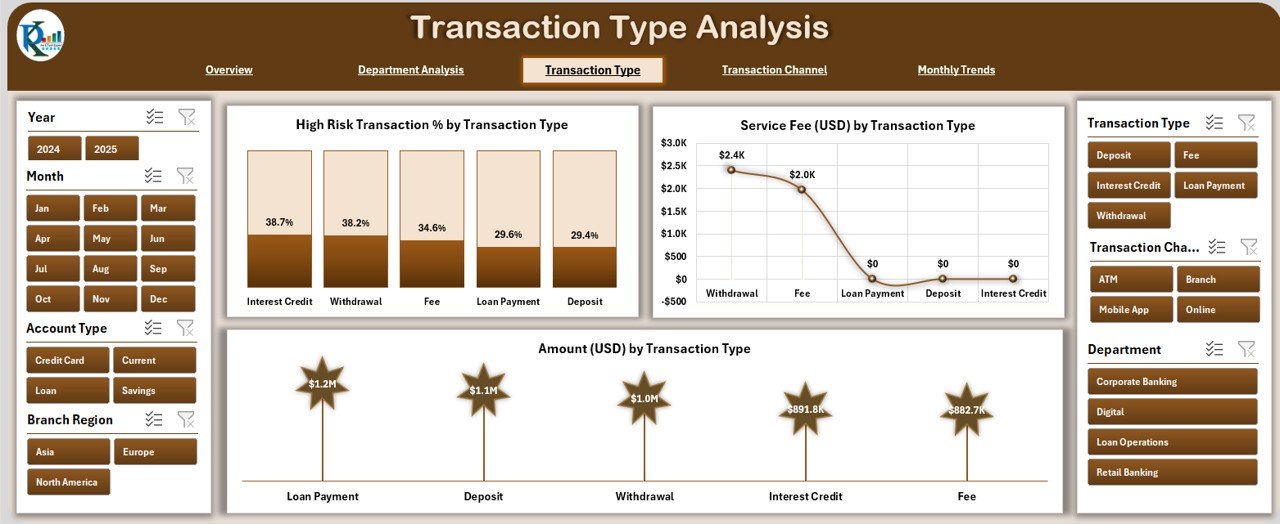
✅ 💰 Transaction Type Insights – Analyze revenue and risks by transaction type (loans, deposits, transfers) and spot growth areas.
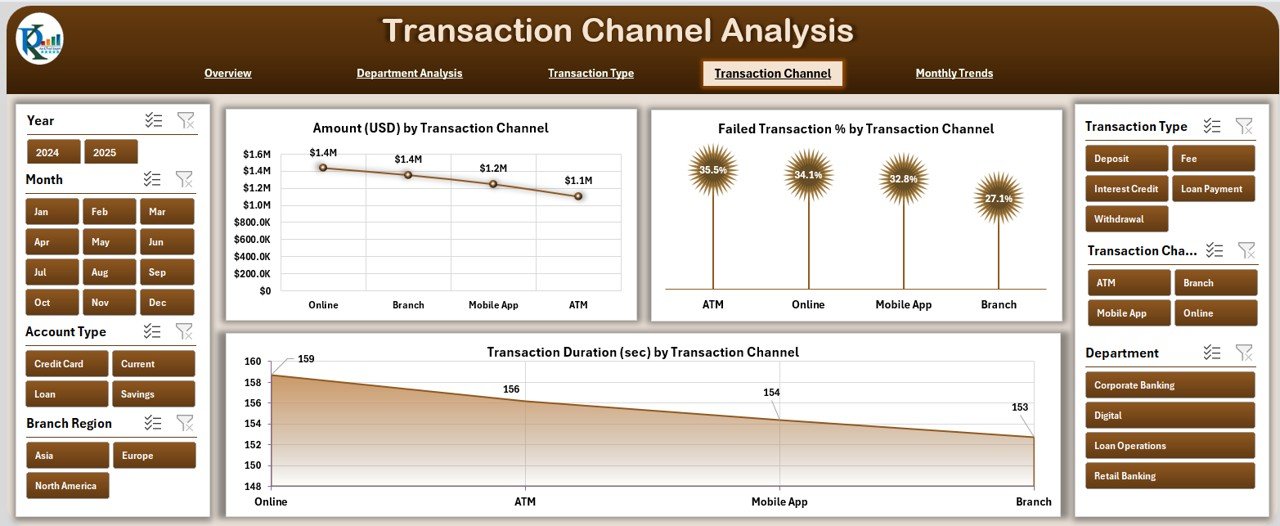
✅ 📡 Channel Analysis – Track ATM, Online, and Mobile transactions — identify where customers prefer to bank and improve experience.
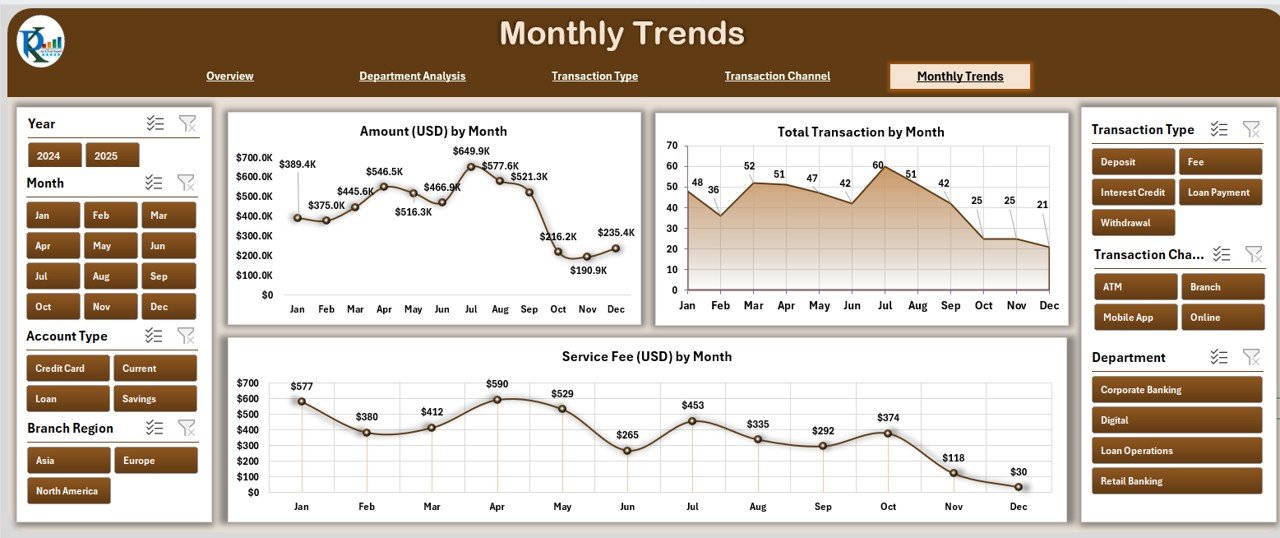
✅ 📅 Monthly Trends Page – Visualize performance over time and identify seasonal banking patterns easily.
✅ 📂 Automated Data Sheet – Add or replace transaction data; all charts update automatically in seconds.
✅ 🔒 Secure & Customizable – No technical setup required — just open, refresh, and analyze securely on your system.
💼 What’s Inside the Banking Dashboard in Excel
This dashboard template comes preloaded with everything a bank or financial analyst needs:
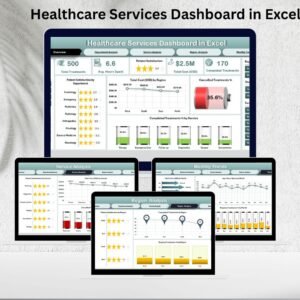
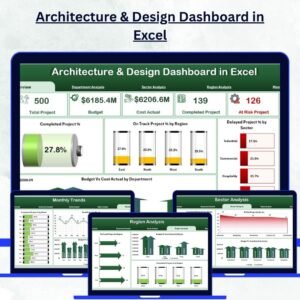
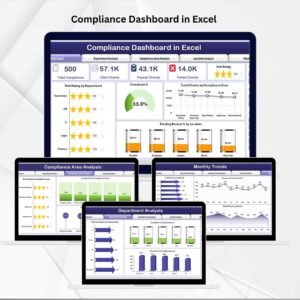
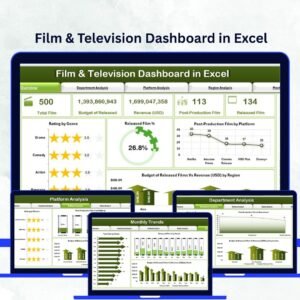
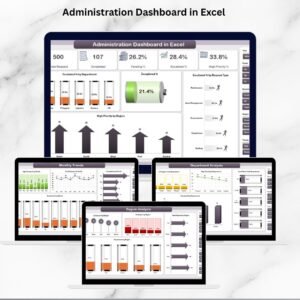
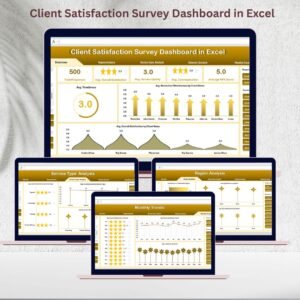
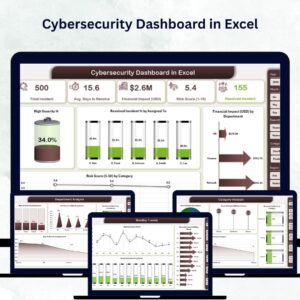
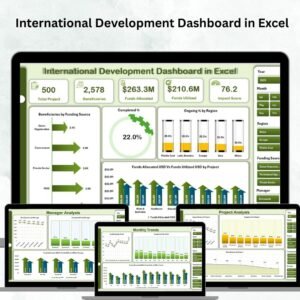
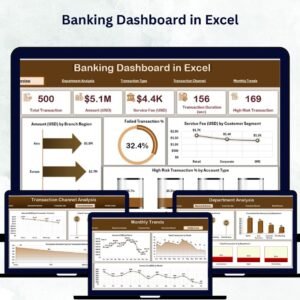
📊 Overview Page: A central command center showing KPIs, cards, and 4 powerful charts — including transaction amount by branch, failed transactions %, service fees by customer segment, and high-risk transactions %.
🏢 Department Analysis: Compare satisfaction rating, completed events %, profits, and cost vs. revenue — all department-wise.
💳 Transaction Type Analysis: Discover which transaction categories contribute most to revenue and risk.
📱 Transaction Channel Analysis: Analyze how customers interact across ATMs, mobile apps, or branches.
📆 Monthly Trends: Identify growth and performance patterns month-over-month.
📋 Support & Data Sheets: Backend automation with slicers, lists, and master data tables — ready for customization.
Each page is visually designed for clarity, ensuring you can present results directly to management or auditors without extra formatting.
🚀 How to Use the Banking Dashboard in Excel
1️⃣ Open the file and go to the Overview Page.
2️⃣ Use slicers to filter by date, region, or transaction type.
3️⃣ Navigate between analytical pages using the sidebar.
4️⃣ Update data in the Data Sheet — all visuals refresh automatically.
5️⃣ Export charts or print summaries for meetings and reports.
No advanced Excel skills required — it’s completely plug-and-play!
👨💼 Who Can Benefit from This Banking Dashboard
🏦 Bank Managers: Monitor regional branch performance and customer satisfaction instantly.
💰 Finance Teams: Evaluate cost, revenue, and profitability trends.
⚙️ Operations Teams: Track failed transactions, identify delays, and optimize efficiency.
👩💻 Customer Service Teams: Improve experience by analyzing feedback and issue patterns.
🧮 Risk & Compliance Teams: Detect suspicious transactions early and ensure compliance.
📊 Executives & Analysts: Get consolidated visual summaries for presentations and reviews.
From local branches to corporate headquarters, this dashboard helps you make faster, smarter, and more confident financial decisions — without the need for complex BI tools.
🔗 Click here to read the Detailed blog post
📺 Visit our YouTube channel to learn step-by-step video tutorials
👉 YouTube.com/@PKAnExcelExpert


Reviews
There are no reviews yet.