Take control of your startup growth with the Avatar Tech Startups Dashboard in Excel 💡. In today’s fast-paced tech ecosystem, tracking data across funding, revenue, partnerships, customer acquisition, and industry performance can quickly become overwhelming.
However, this powerful and ready-to-use Excel dashboard simplifies everything. It transforms complex startup data into clear visuals, actionable insights, and structured reports—all in one place.
With this dashboard, you can monitor your startup ecosystem, analyze trends, and make faster, smarter, and data-driven decisions without relying on multiple spreadsheets.
🚀 Key Feature of Avatar Tech Startups Dashboard in Excel
✅ 📊 Interactive Excel Dashboard
Analyze startup performance using dynamic charts and slicers.
✅ 📈 Complete KPI Tracking
Track funding, revenue, partnerships, customer acquisition cost, and more.
✅ 📅 Multi-Page Dashboard Structure
Explore insights across 5 structured analytical pages.
✅ 🔍 Smart Filtering with Slicers
Filter data instantly for customized analysis.
✅ 🌍 Region & Industry Insights
Evaluate performance across regions and industry sectors.
✅ ⚙️ Automated Calculations
Support sheet handles backend calculations for accurate results.
✅ 📂 Organized Data Structure
Separate Data and Support sheets for efficient data management.
📦 What’s Inside the Avatar Tech Startups Dashboard in Excel
This template includes 5 powerful analytical pages:
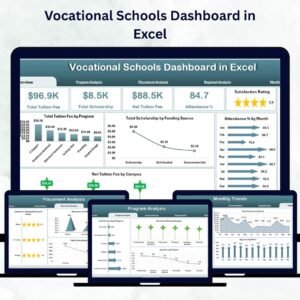
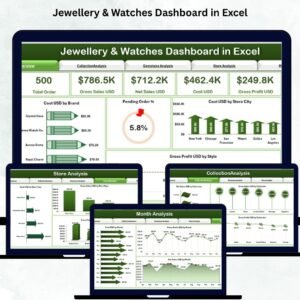
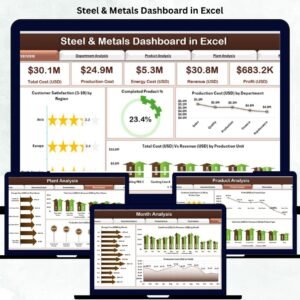
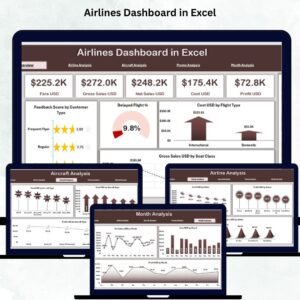
📊 Overview Page – Snapshot of startup performance with KPI cards
💰 Funding Round Analysis – Analyze funding trends and investment performance
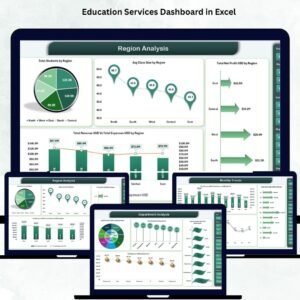
🌍 Region Analysis – Compare performance across geographic regions
🏢 Industry Sector Analysis – Evaluate startup performance by sector
📅 Month Analysis – Track growth and trends over time
📂 Additional Sheets:
-
Data Sheet – Stores all raw startup data
-
Support Sheet – Handles calculations and backend logic
Everything is designed to provide a complete 360° startup performance view.
⚙️ How to Use the Avatar Tech Startups Dashboard in Excel
Getting started is simple:
👉 Enter your data in the Data Sheet
👉 Calculations update automatically in the Support Sheet
👉 Use slicers to filter by region, industry, or funding round
👉 Analyze KPI cards and charts
👉 Track trends across multiple pages
Within minutes, you can transform raw startup data into powerful business insights 📊.
👨💼 Who Can Benefit from This Avatar Tech Startups Dashboard in Excel
This dashboard is perfect for:
🚀 Startup Founders – Track growth and performance
💼 Investors & Venture Capitalists – Analyze funding and returns
📊 Business Analysts – Evaluate startup KPIs
📈 Finance Teams – Monitor financial performance
📉 Data Analysts – Generate insights
🌍 Consultants – Provide strategic recommendations
Anyone involved in startup growth, funding, and analytics will benefit from this tool.
🔗 Click hare to read the Detailed blog post
Explore the complete guide with detailed features, benefits, and use cases.
👉 Visit our YouTube channel to learn step-by-step video tutorials:
https://youtube.com/@PKAnExcelExpert