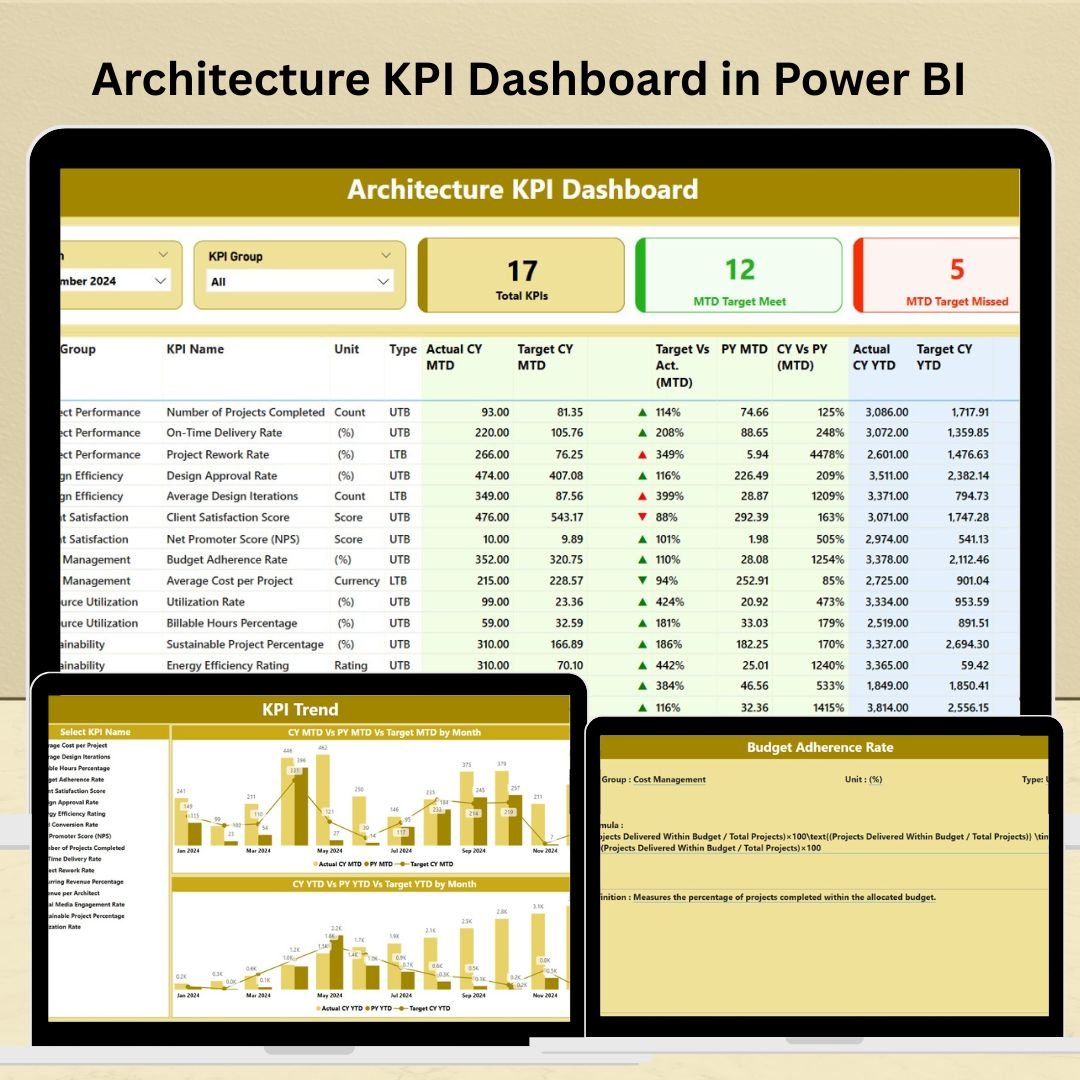


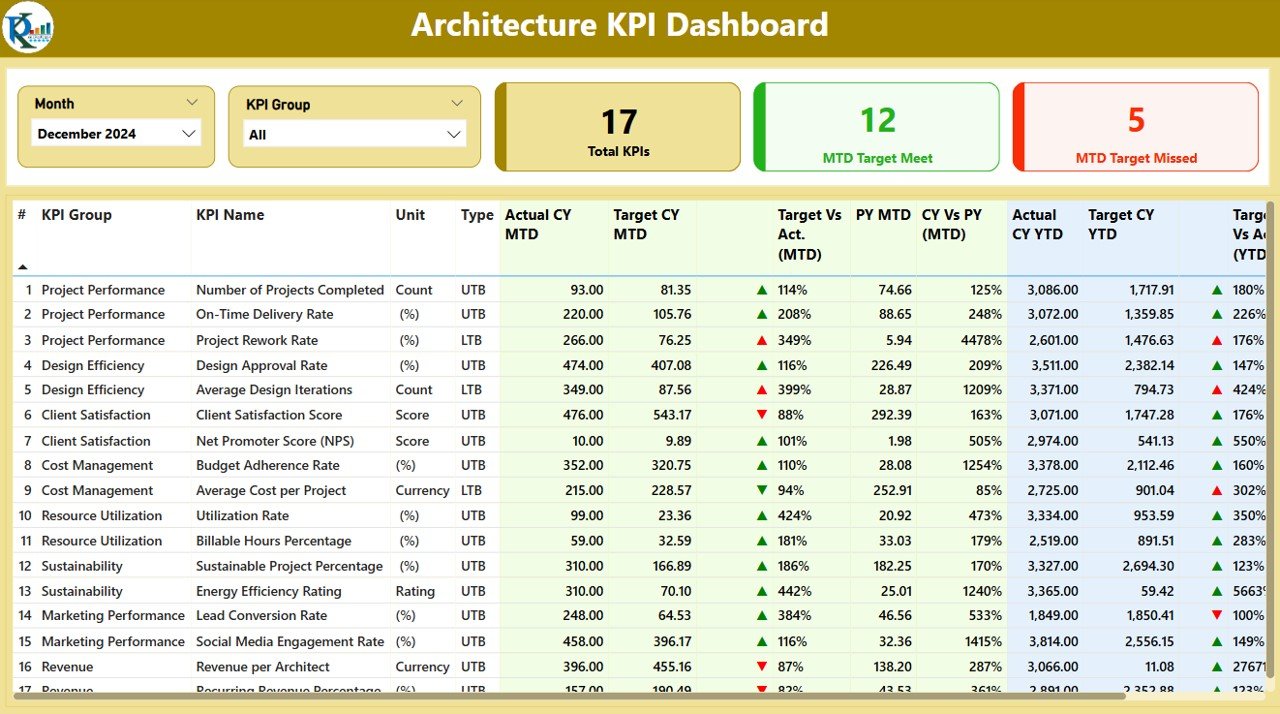
The Architecture KPI Dashboard in Power BI is a powerful tool designed for architecture firms, project managers, and architects to track and measure key performance indicators (KPIs) related to their projects and operations. This dashboard helps to manage project timelines, costs, resources, and client satisfaction, providing a comprehensive overview of project health and performance.
With its intuitive design and real-time data integration, this dashboard allows architecture professionals to gain actionable insights into project progress, resource allocation, and financial health. Use this dashboard to improve decision-making, ensure projects stay on track, and enhance overall operational efficiency.
Key Features of the Architecture KPI Dashboard in Power BI
📊 Project Performance Tracking
Monitor the health of ongoing projects by tracking key metrics such as project completion rates, milestones achieved, and time to project completion. Get a clear picture of project progress and identify potential delays early.
📈 Cost & Budget Management
Track project costs against budgets to ensure financial control. Monitor expenses for each project phase, helping you stay within budget and avoid overspending.
📅 Timeline & Milestone Monitoring
Visualize project timelines and key milestones. Track deadlines and ensure projects are completed on schedule. Identify delays and take corrective actions promptly to keep everything on track.
⚙️ Resource Allocation & Utilization
Monitor how resources such as manpower, equipment, and materials are allocated across various projects. Ensure resources are being utilized efficiently and avoid over- or under-utilization.
🔑 Client Satisfaction & Feedback
Track client satisfaction with project feedback metrics. Monitor client surveys, NPS (Net Promoter Score), and other satisfaction indicators to ensure your projects meet client expectations.
📈 Customizable KPIs & Metrics
The dashboard is highly customizable to allow you to track the KPIs that matter most to your organization. Add specific performance indicators that align with your goals, whether it’s project delivery time, team efficiency, or quality metrics.
Why You’ll Love the Architecture KPI Dashboard in Power BI
✅ Comprehensive Project Tracking
Track all aspects of your projects, from cost management to client satisfaction, ensuring projects are completed efficiently and within scope.
✅ Financial Oversight
Keep an eye on budgets, expenses, and profits, preventing project overruns and ensuring financial viability.
✅ Ensure Timely Project Completion
Monitor deadlines and milestones, ensuring that projects are completed on time and within agreed-upon terms.
✅ Improve Resource Management
Optimize resource allocation across various projects, ensuring efficient use of labor, materials, and equipment.
✅ Improve Client Relationships
Track client satisfaction to ensure that the projects align with client expectations, leading to better long-term relationships and repeat business.
What’s Inside the Architecture KPI Dashboard in Power BI?
-
Project Performance Tracking: Track project completion rates, milestones, and timelines.
-
Cost & Budget Management: Monitor project costs and budget performance.
-
Timeline & Milestone Monitoring: Visualize project timelines and key deadlines.
-
Resource Allocation: Ensure efficient use of resources across projects.
-
Client Satisfaction Tracking: Measure and monitor client satisfaction and feedback.
-
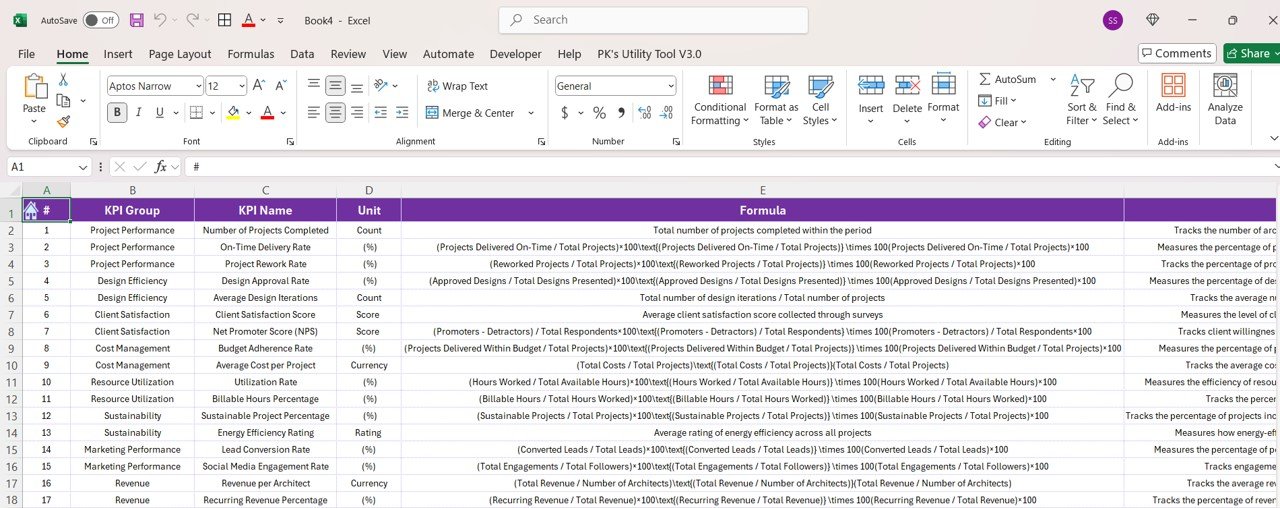
Customizable KPIs: Track the KPIs that align with your firm’s objectives.
How to Use the Architecture KPI Dashboard in Power BI
1️⃣ Download the Template: Access the Architecture KPI Dashboard in Power BI instantly.
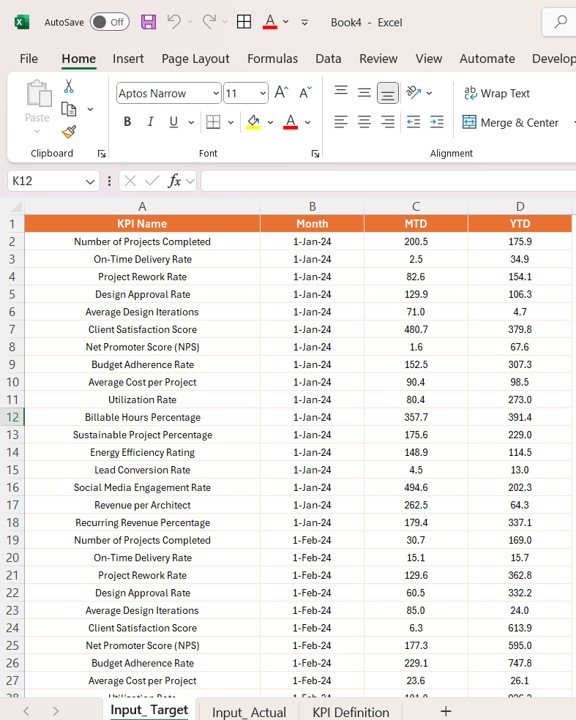
2️⃣ Integrate Your Data Sources: Connect your project management tools, budget tracking, and resource planning systems to the dashboard for real-time data.
3️⃣ Track Key KPIs: Monitor project progress, costs, timelines, and resource utilization.
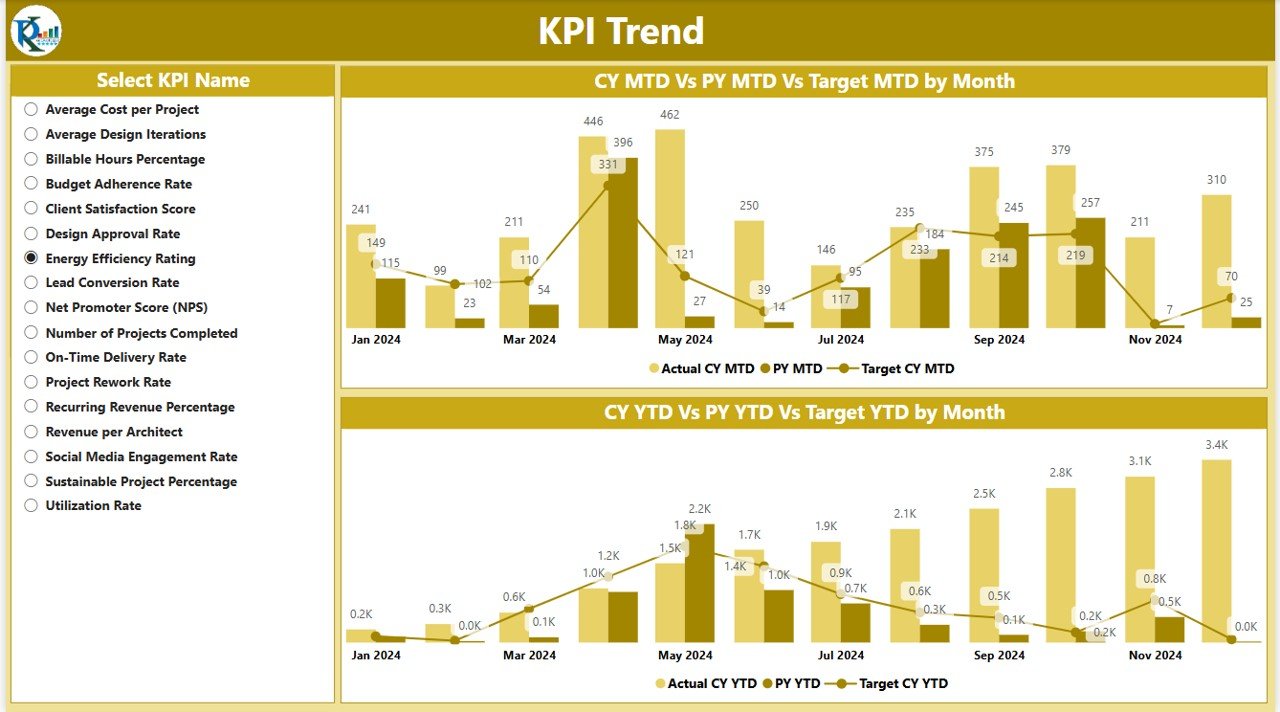
4️⃣ Analyze Trends & Metrics: Use the data to identify trends, inefficiencies, and opportunities for improvement.
5️⃣ Optimize Project Delivery: Use insights from the dashboard to ensure projects are delivered on time, within budget, and to client satisfaction.
Who Can Benefit from the Architecture KPI Dashboard in Power BI?
🔹 Architecture Firms & Architects
🔹 Project Managers & Project Teams
🔹 Construction Managers & Contractors
🔹 Operations Managers & Resource Planners
🔹 Financial Managers & Cost Analysts
🔹 Client Relationship Managers
🔹 Firms and Businesses in the Architecture, Engineering, and Construction (AEC) Industry
Ensure your architecture projects are successful with the Architecture KPI Dashboard in Power BI. Track key metrics, optimize resources, and deliver high-quality projects on time and within budget.
Click here to read the Detailed blog post
Visit our YouTube channel to learn step-by-step video tutorials
Youtube.com/@PKAnExcelExpert


Reviews
There are no reviews yet.