In the fast-paced world of aviation, every second counts. From managing flight operations to optimizing costs, airlines need accurate, real-time performance tracking. The Airlines KPI Dashboard in Excel ✈️📊 is a ready-to-use, interactive tool that helps airline professionals visualize key metrics, analyze trends, and make data-driven decisions — all within the familiar environment of Microsoft Excel.
Built for executives, operations managers, and analysts alike, this Excel dashboard provides a complete view of airline performance across departments such as operations, maintenance, safety, customer experience, and finance. It’s your flight-deck for performance management — clear, fast, and fully automated.
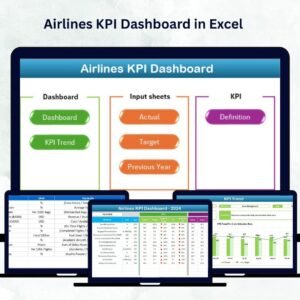
⚡ Key Features of Airlines KPI Dashboard in Excel
✅ Interactive Dashboard Page: View all essential airline KPIs like on-time departures, fuel efficiency, customer satisfaction, and operational costs in one snapshot.
✅ Automated Month Selection: Choose any month using a dropdown menu (cell D3) — all charts and tables refresh instantly.
✅ MTD, YTD & PY Comparison: Monitor Month-to-Date, Year-to-Date, and Previous Year data side by side.
✅ Visual Indicators: Conditional arrows 🟢🔴 highlight achievements and underperformance instantly.
✅ Dynamic Charts: Track trends for each KPI across months or years.
✅ Department-Wise Insights: Evaluate performance across operations, maintenance, finance, and customer service.
✅ No Macros Required: Runs entirely on formulas and Excel features — simple yet powerful.
✅ Customizable: Add, remove, or modify KPIs to match your airline’s structure.
✅ Professional Layout: Visually engaging charts and cards designed for executive reporting.
This dashboard brings clarity to your performance tracking — letting your teams focus on improvement, not manual reporting.
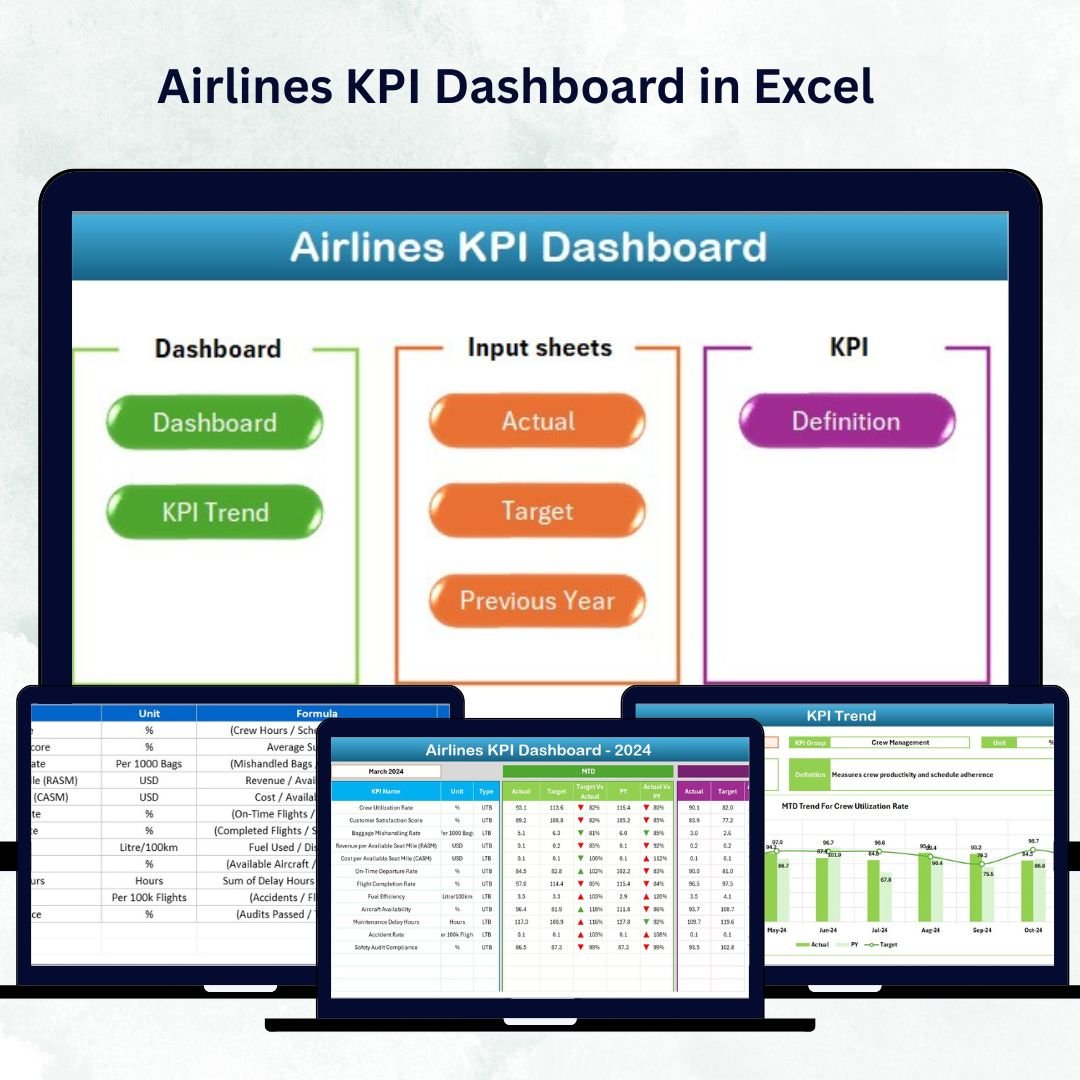
🧩 What’s Inside the Airlines KPI Dashboard in Excel
This template is organized into seven connected worksheets, each serving a distinct role in data management and analytics:
1️⃣ Home Sheet:
Your navigation hub — featuring quick-access buttons to key pages. Even new users can move through the dashboard effortlessly.
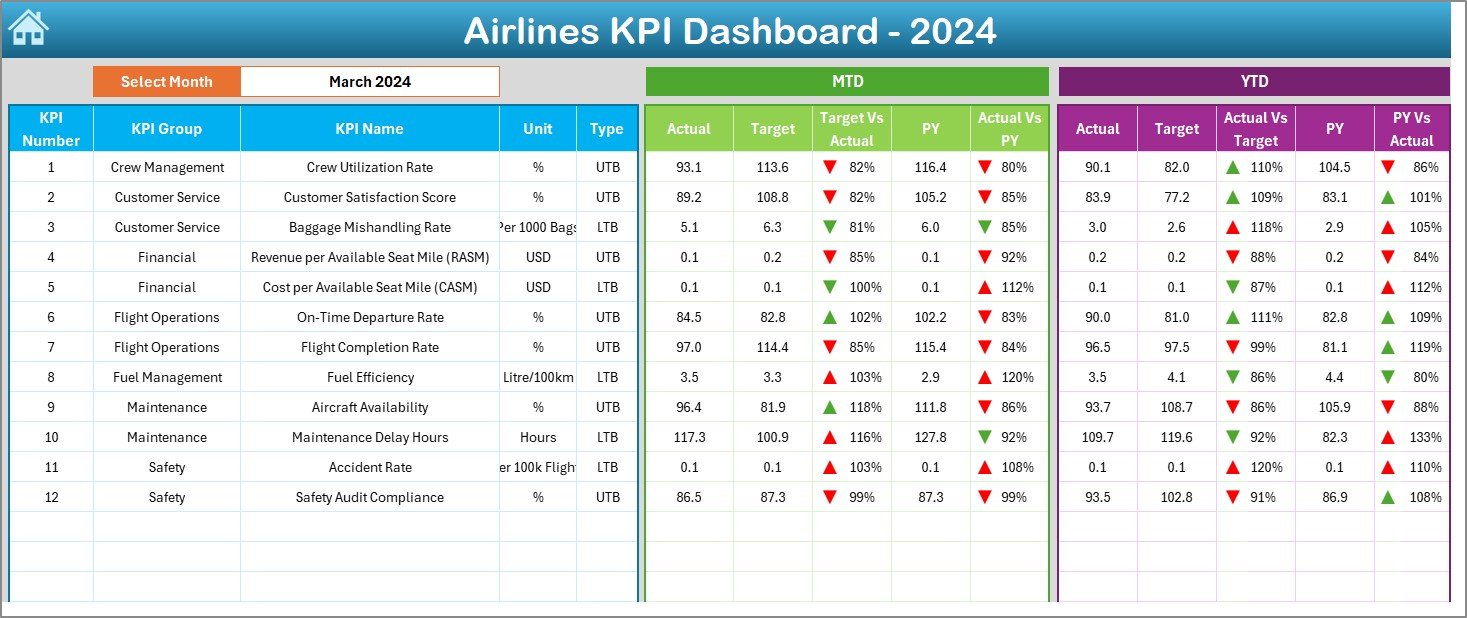
2️⃣ Dashboard Sheet:
The main analytics page that showcases all KPIs using cards, charts, and conditional formatting.
-
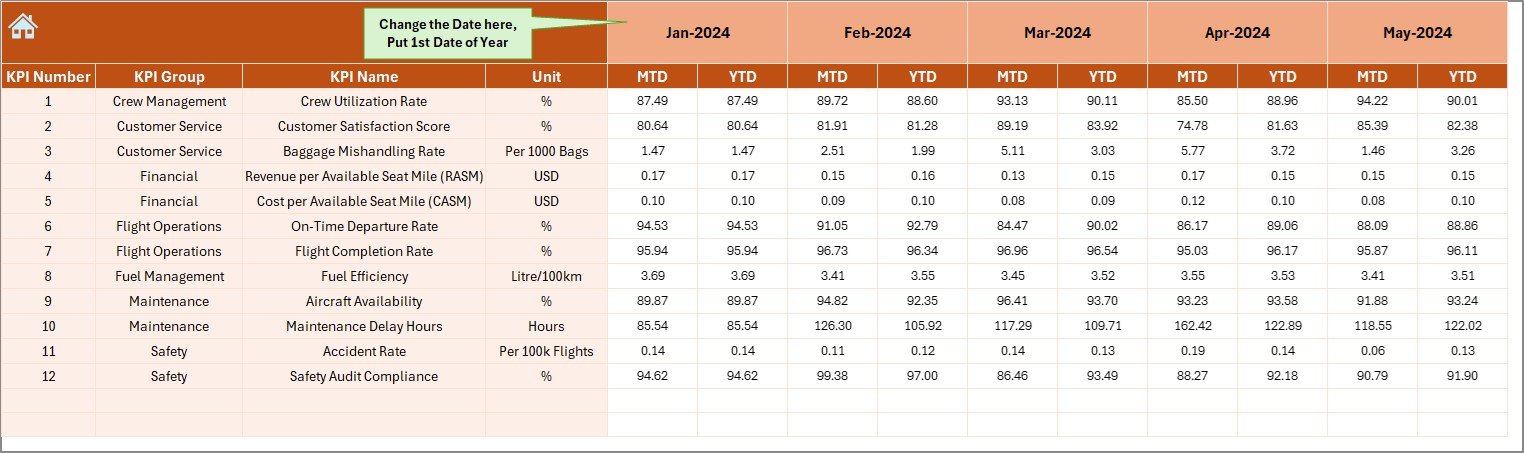
Includes Month Selector (D3).
-
Displays MTD/YTD Actual, Target, and PY data.
-
Provides Target vs Actual % and PY vs Actual % for instant comparison.
Perfect for management reviews and performance summaries.
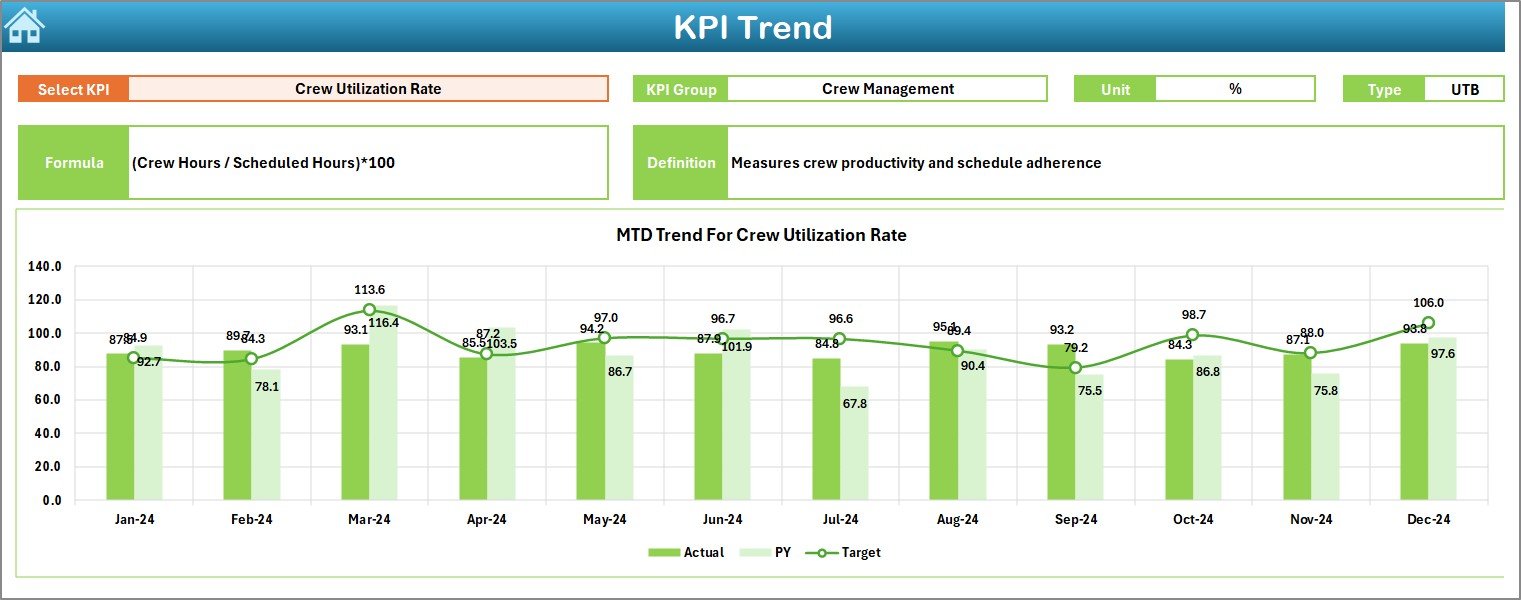
3️⃣ KPI Trend Sheet:
Select any KPI (cell C3) to view its historical MTD and YTD performance.
Interactive charts illustrate Actual vs Target vs PY values, helping teams identify trends and seasonal patterns.
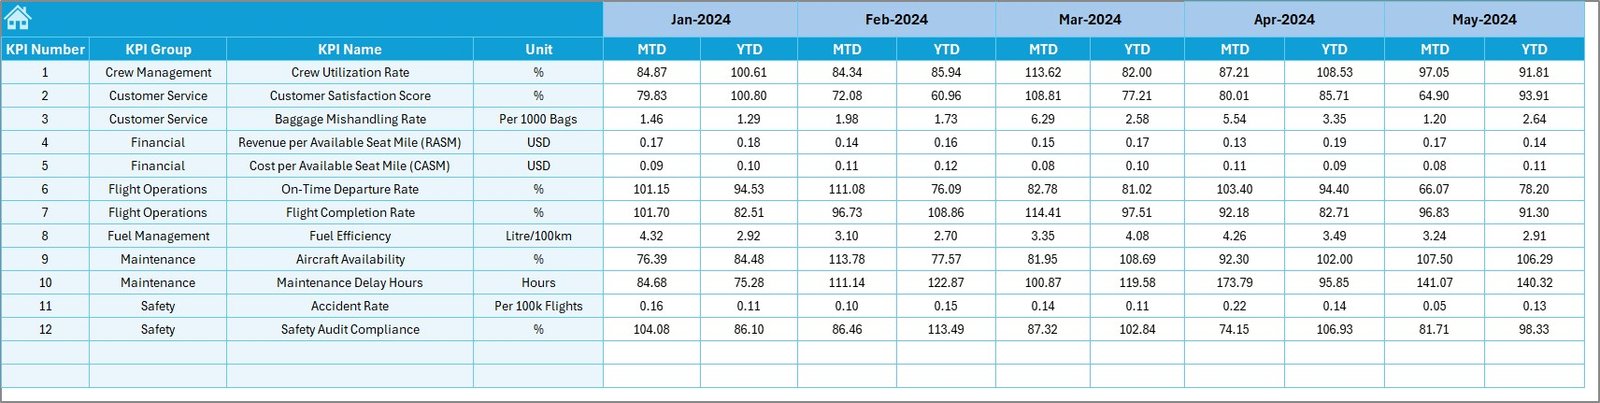
4️⃣ Actual Numbers Input Sheet:
Enter real-time monthly data — both MTD and YTD — for every KPI.
Use the dropdown in E1 to define your fiscal year start.
5️⃣ Target Sheet:
Set monthly and yearly benchmark targets for each KPI.
These values power the dashboard’s comparison visuals.
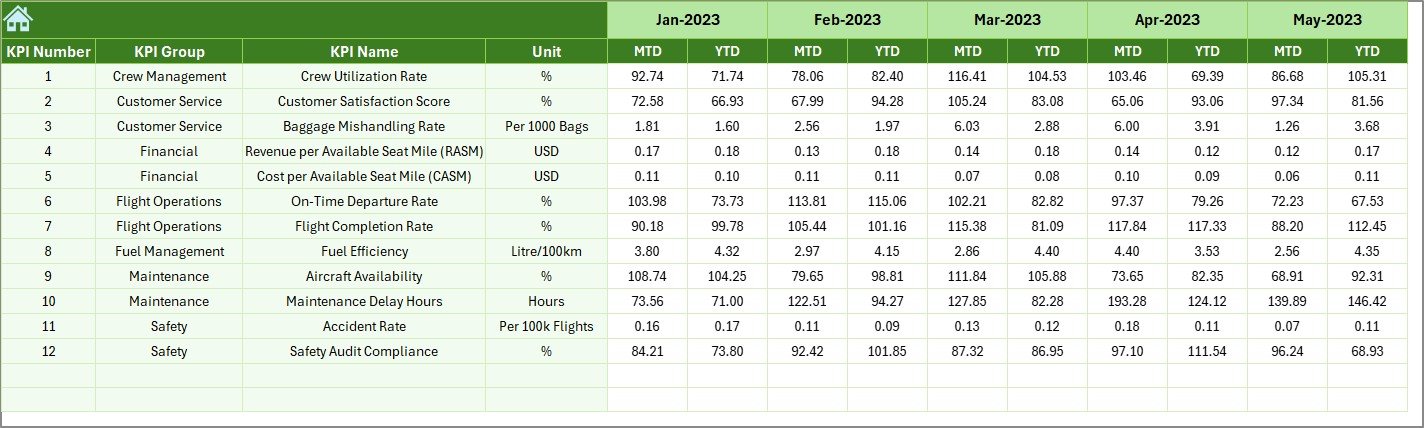
6️⃣ Previous Year Sheet:
Record prior-year figures to measure growth or decline and track improvement trajectories.
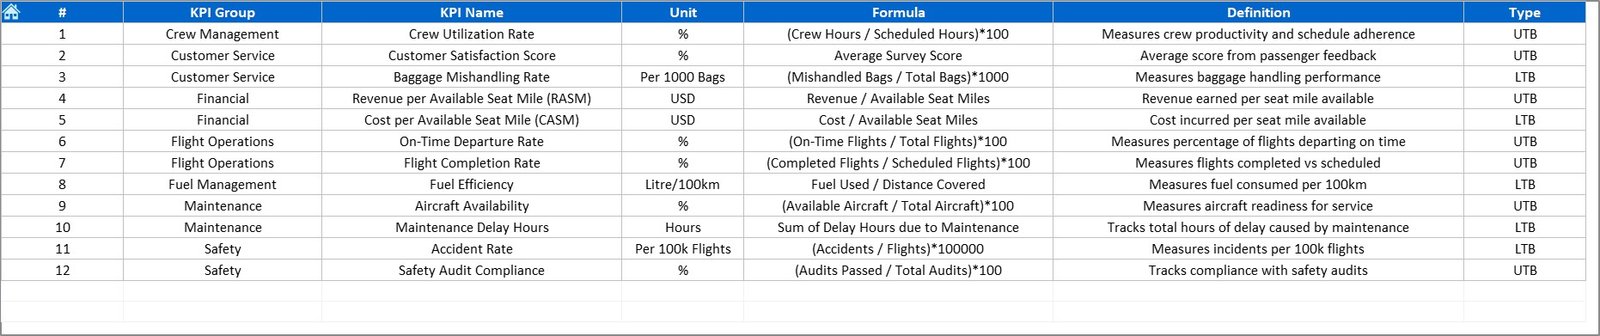
7️⃣ KPI Definition Sheet:
A centralized reference detailing each KPI’s Name, Group, Unit, Formula, and Definition — ensuring consistency and transparency across teams.
🧠 How to Use the Airlines KPI Dashboard in Excel
✈️ Step 1: Enter current data in the Actual Numbers Input Sheet.
🎯 Step 2: Define targets in the Target Sheet.
📅 Step 3: Add previous year values for comparison.
📊 Step 4: Go to the Dashboard Sheet — all visuals update automatically.
📈 Step 5: Use the KPI Trend Sheet to analyze performance across time.
In just a few clicks, you’ll have a complete analytical cockpit for your airline operations.
👥 Who Can Benefit from This Airlines KPI Dashboard
🛫 Airline Operations Managers: Track flight efficiency and schedule reliability.
⚙️ Maintenance Teams: Monitor aircraft downtime and turnaround time.
💼 Finance Departments: Measure fuel costs, revenue, and expenditure.
👨✈️ Crew Management: Evaluate performance, training progress, and utilization.
🙋 Customer Experience Teams: Analyze satisfaction and service-quality KPIs.
📊 Executives & Decision-Makers: Get a bird’s-eye view of operational performance across all departments.
This dashboard empowers every stakeholder to make smarter, faster, data-driven decisions.
🔗 Click here to read the Detailed Blog Post
🎥 Visit our YouTube channel to learn step-by-step video tutorials
👉 YouTube.com/@PKAnExcelExpert


Reviews
There are no reviews yet.