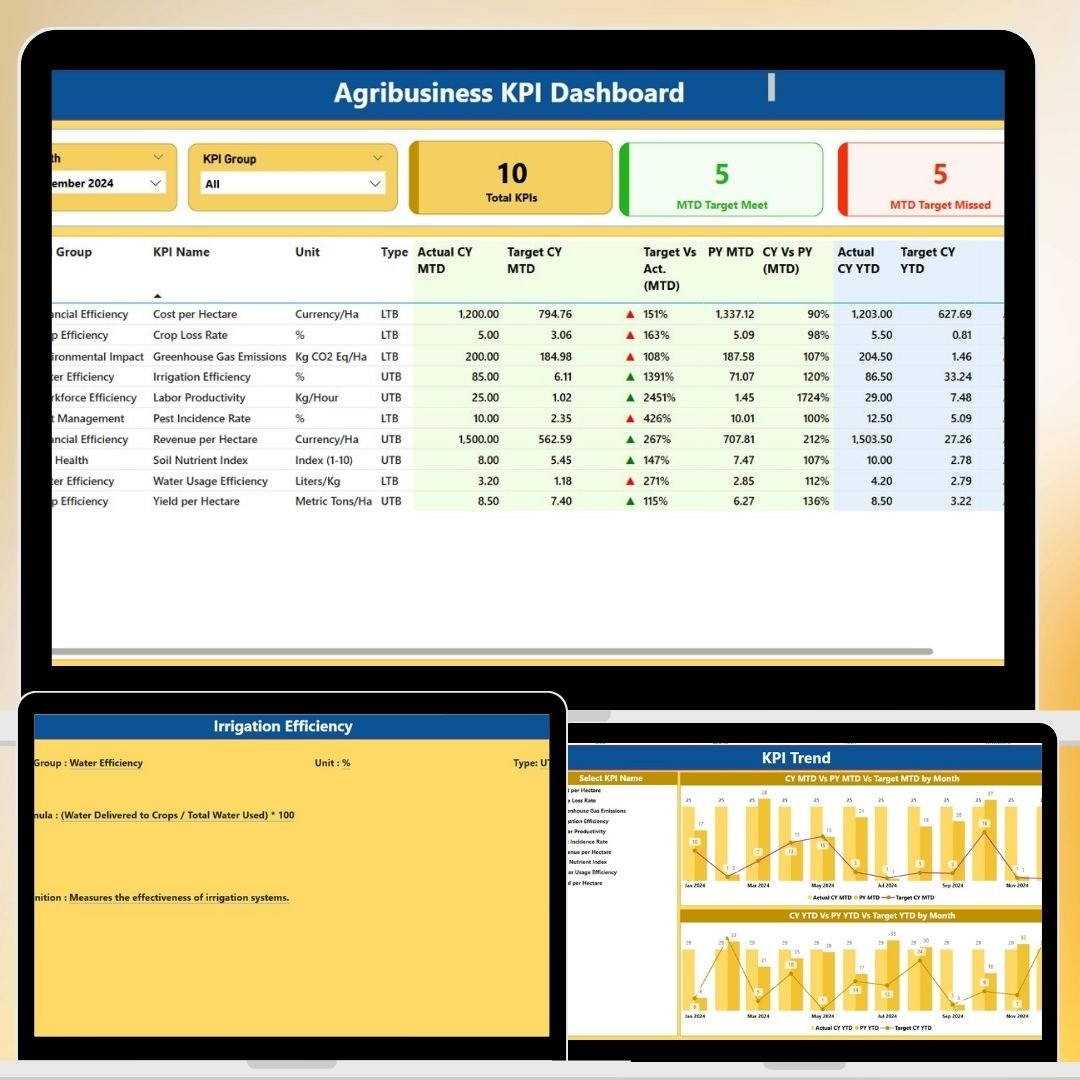


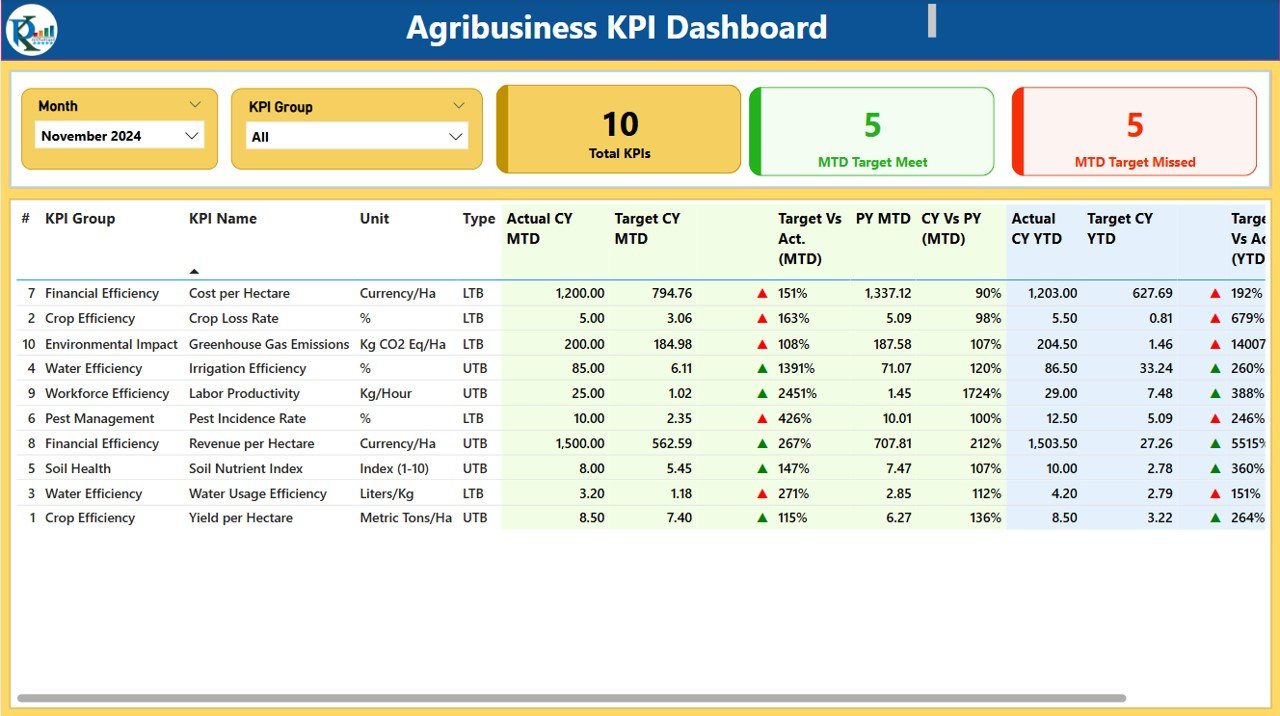
The Agribusiness KPI Dashboard in Power BI is an essential tool for agriculture businesses, farm managers, and agribusiness professionals looking to monitor and optimize their operations. This dynamic dashboard provides real-time insights into key performance indicators (KPIs) such as crop yield, revenue, cost per acre, inventory levels, and more. It enables you to track performance across various stages of the agricultural value chain, from production to distribution, ensuring efficiency and profitability.
Designed to integrate data from multiple sources, this Power BI dashboard helps you make data-driven decisions that enhance productivity, minimize costs, and improve overall business performance. With its customizable features, you can tailor the dashboard to your specific needs, whether you’re managing crops, livestock, or agribusiness finances.
Key Features of the Agribusiness KPI Dashboard in Power BI
📊 Comprehensive KPI Tracking
Track essential agribusiness KPIs such as crop yield, revenue, cost per acre, inventory levels, and resource usage. Monitor the overall health of your agricultural operations at a glance.
📈 Revenue & Cost Analysis
Analyze your agribusiness revenue, cost per unit, and profitability metrics. Get insights into your profit margins, helping you identify opportunities to increase profitability and reduce unnecessary costs.
🌱 Crop Yield Monitoring
Monitor crop performance and growth rates with detailed analysis. Track yields across different crop types and adjust strategies for optimal crop production.
🚜 Resource Usage Tracking
Track the usage of resources such as water, fertilizers, and pesticides. Monitor the efficiency of your resource consumption and optimize for sustainability and cost-efficiency.
📅 Time-Based Performance Analysis
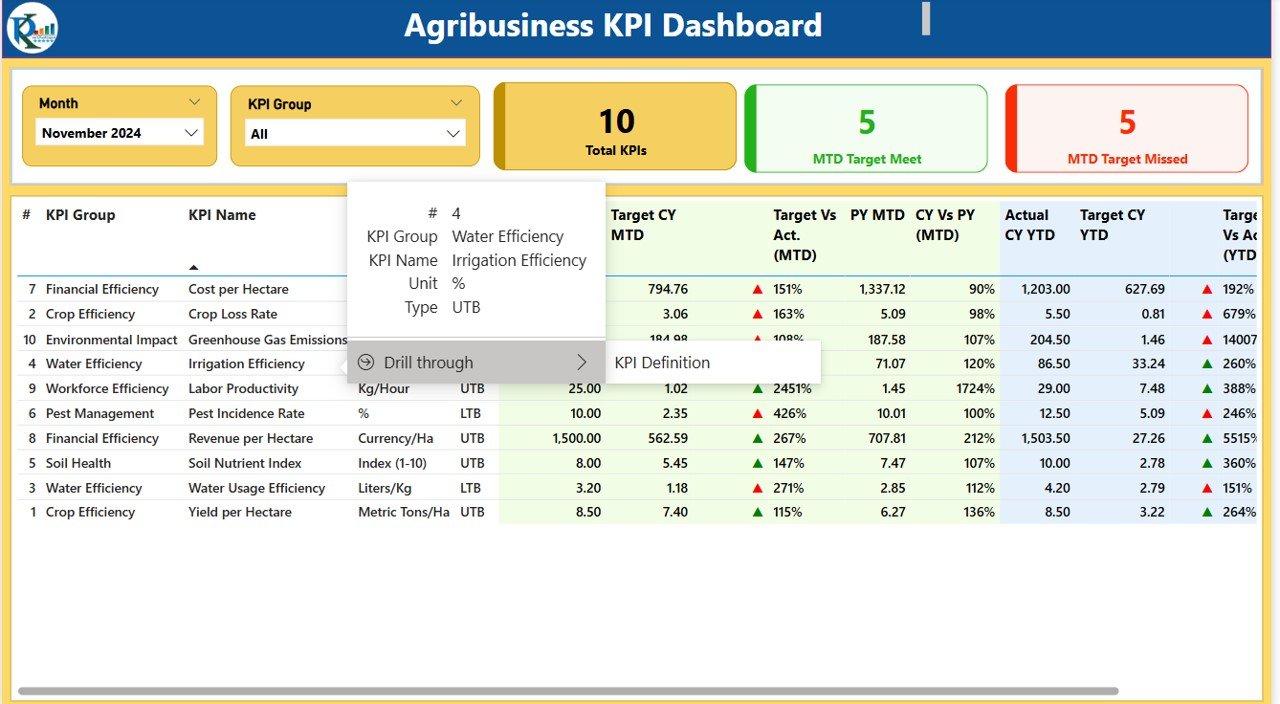
Analyze KPI trends over time, comparing performance on daily, weekly, monthly, and yearly scales. Identify seasonality patterns and trends in production, cost, and revenue.
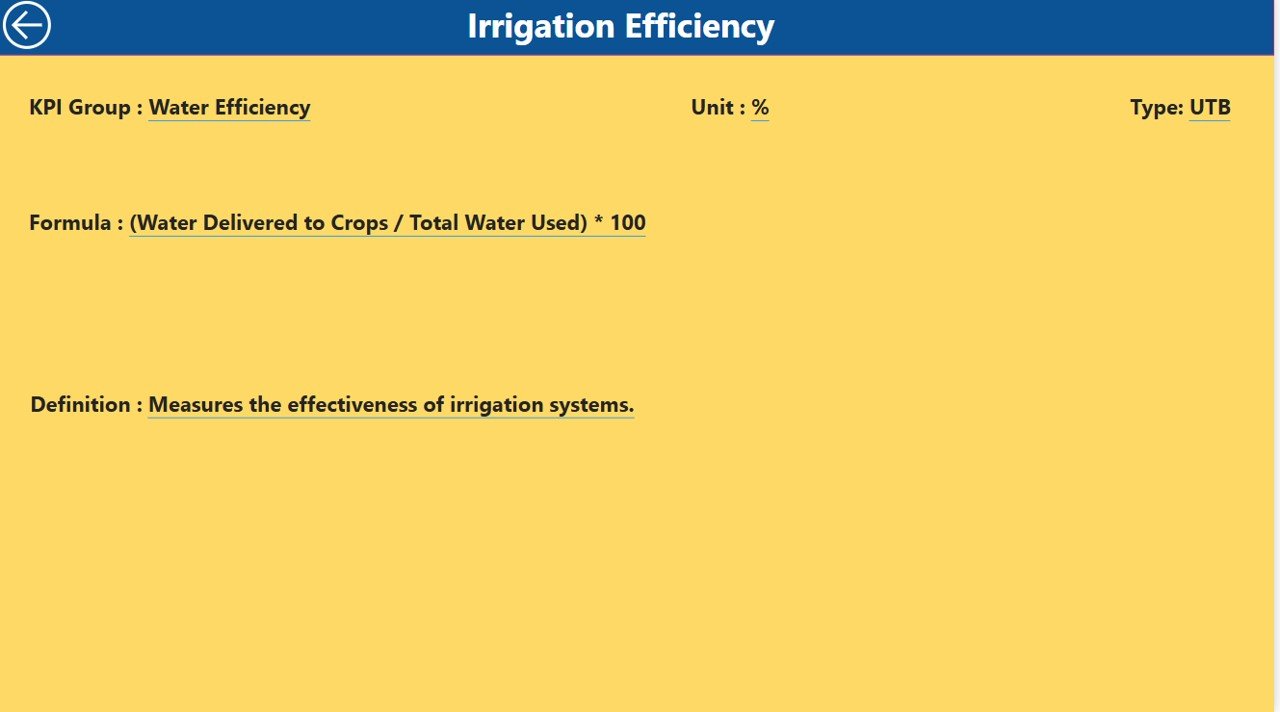
🔑 Customizable & Scalable Dashboard
The dashboard is highly customizable to suit your agribusiness needs. Add custom KPIs, adjust data sources, and scale the dashboard to monitor multiple farm locations or products.
Why You’ll Love the Agribusiness KPI Dashboard in Power BI
✅ All-in-One Monitoring Tool
Monitor key metrics such as crop yield, costs, and revenue in one place. Get real-time insights into every aspect of your agribusiness operations.
✅ Optimize Resource Allocation
Track your resource usage (water, fertilizers, etc.) and identify areas for improvement. Optimize your operations for better resource management and sustainability.
✅ Increase Profitability & Efficiency
By tracking your cost per acre and monitoring crop yield, you can adjust strategies to improve profitability and operational efficiency.
✅ Data-Driven Decisions
Use the insights from the dashboard to make data-driven decisions, from production planning to cost management. Optimize your agribusiness strategies for long-term growth.
✅ Customizable & Scalable
Adapt the dashboard to suit your specific agribusiness needs. Whether you’re managing a small farm or a large agribusiness operation, this dashboard can scale to meet your requirements.
What’s Inside the Agribusiness KPI Dashboard in Power BI?
-
Comprehensive KPI Tracking: Monitor crop yield, revenue, and cost per unit.
-
Revenue & Cost Analysis: Track profitability and margins to increase financial efficiency.
-
Crop Yield Monitoring: Evaluate crop performance and growth rates.
-
Resource Usage Tracking: Monitor water, fertilizers, and pesticide usage.
-
Time-Based Performance Analysis: Analyze data over different periods to identify trends.
-
Customizable Features: Tailor the dashboard to fit your agribusiness needs.
How to Use the Agribusiness KPI Dashboard in Power BI
1️⃣ Download the Template: Access the Agribusiness KPI Dashboard in Power BI instantly.
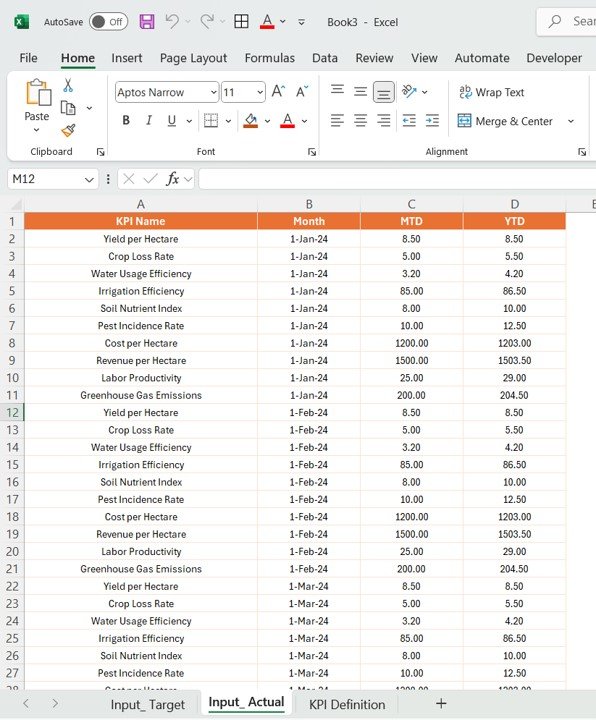
2️⃣ Integrate Your Data Sources: Link your agribusiness data sources (crop yield, revenue, resource usage) to the dashboard.
3️⃣ Track KPIs & Performance: Monitor key metrics such as revenue, costs, and crop performance.
4️⃣ Analyze Trends & Data: Use time-based analysis to track performance trends over various periods.
5️⃣ Optimize Your Agribusiness: Make data-driven decisions to improve profitability, reduce costs, and enhance efficiency.
Who Can Benefit from the Agribusiness KPI Dashboard in Power BI?
🔹 Agribusiness Owners & Managers
🔹 Farm Managers & Operators
🔹 Agricultural Economists & Analysts
🔹 Financial Analysts in Agriculture
🔹 Supply Chain Managers in Agriculture
🔹 Sustainability Officers & Resource Managers
🔹 Large-Scale Agricultural Enterprises
Optimize your agricultural operations with the Agribusiness KPI Dashboard in Power BI. Track crop yields, resource usage, profitability, and more to improve efficiency and drive sustainable growth.
Click here to read the Detailed blog post
Visit our YouTube channel to learn step-by-step video tutorials
Youtube.com/@PKAnExcelExpert


Reviews
There are no reviews yet.