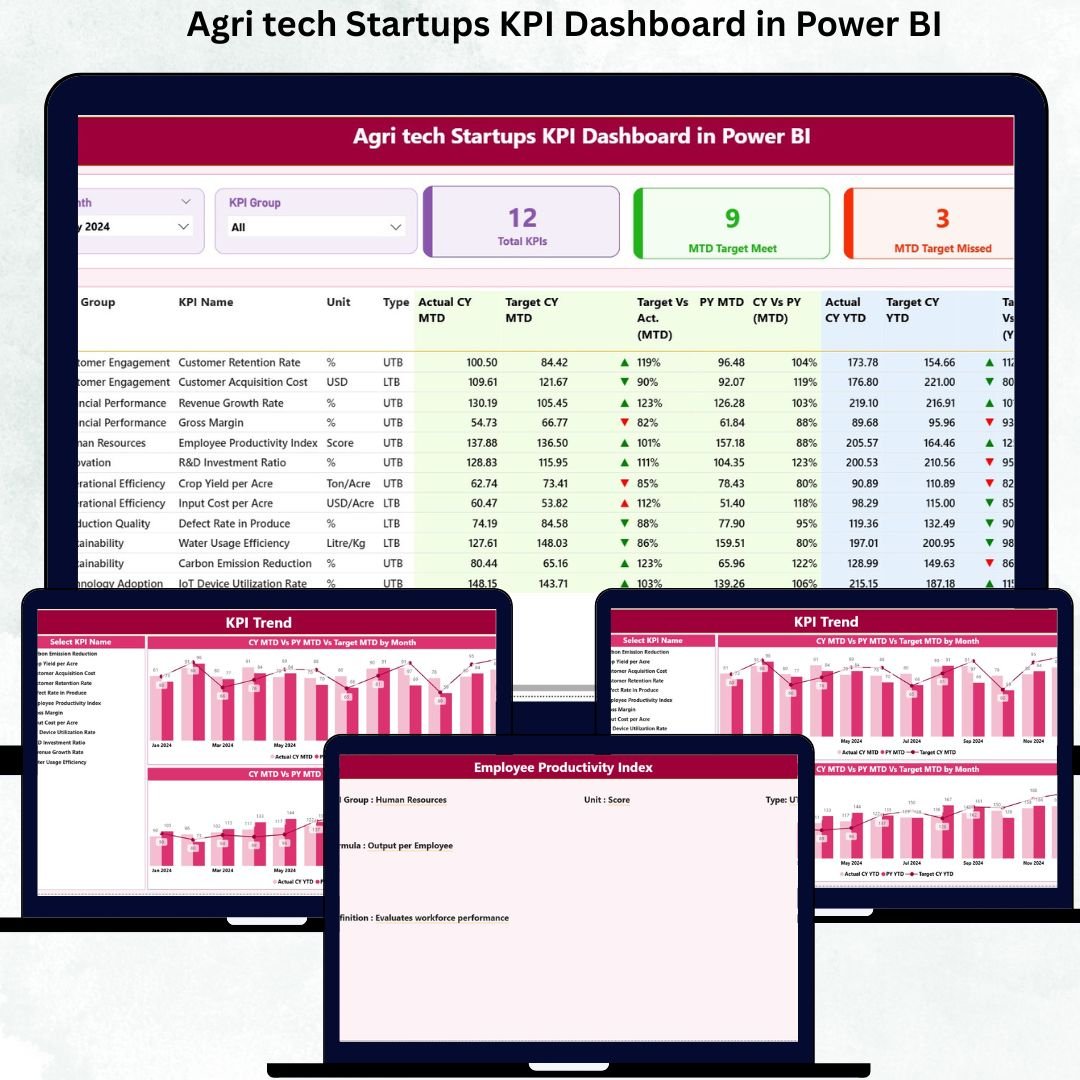
Agri Tech Startups KPI Dashboard in Power BI Running an Agri Tech startup is challenging 🌾. Agri Tech Startups KPI Dashboard in Power BI With seasonal changes, evolving technology, and multiple performance metrics to track, staying on top of operations can feel overwhelming. Agri Tech Startups KPI Dashboard in Power BI That’s where the Agri Tech Startups KPI Dashboard in Power BI comes in — a ready-to-use, powerful tool that brings clarity, accuracy, and speed to your business decisions. With this dashboard, founders, analysts, and operations teams can monitor key performance indicators (KPIs) in real time and make smarter, data-driven decisions.
Key Features of Agri Tech Startups KPI Dashboard in Power BI 💡
-
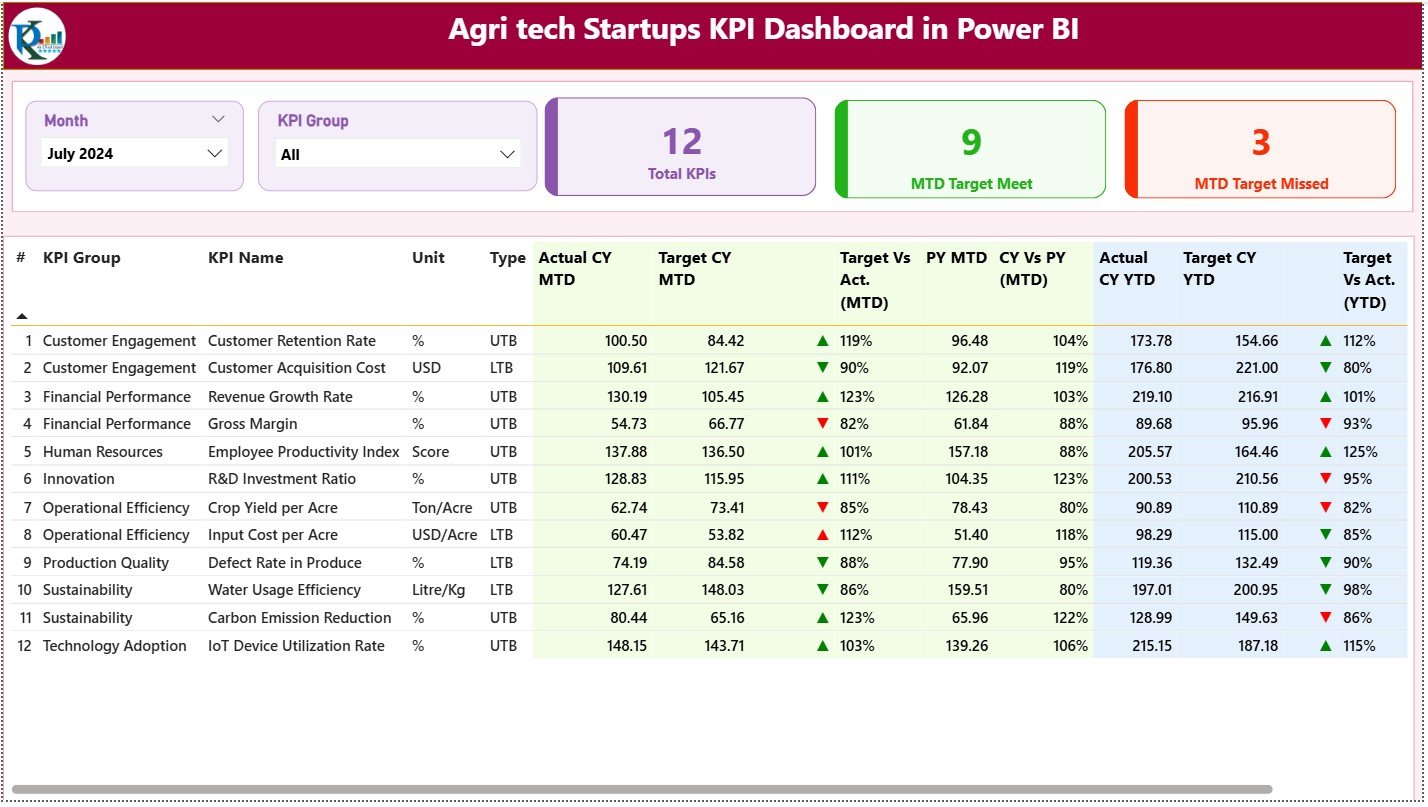
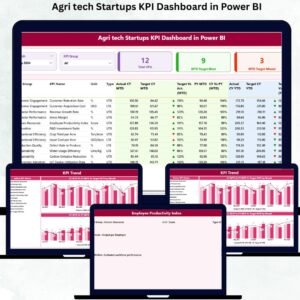
Summary Page – Your Performance Hub: Instantly see all essential KPIs in one place. Track total KPIs, targets met, and targets missed. Filter by month or KPI group and get a quick snapshot of your business health.
-
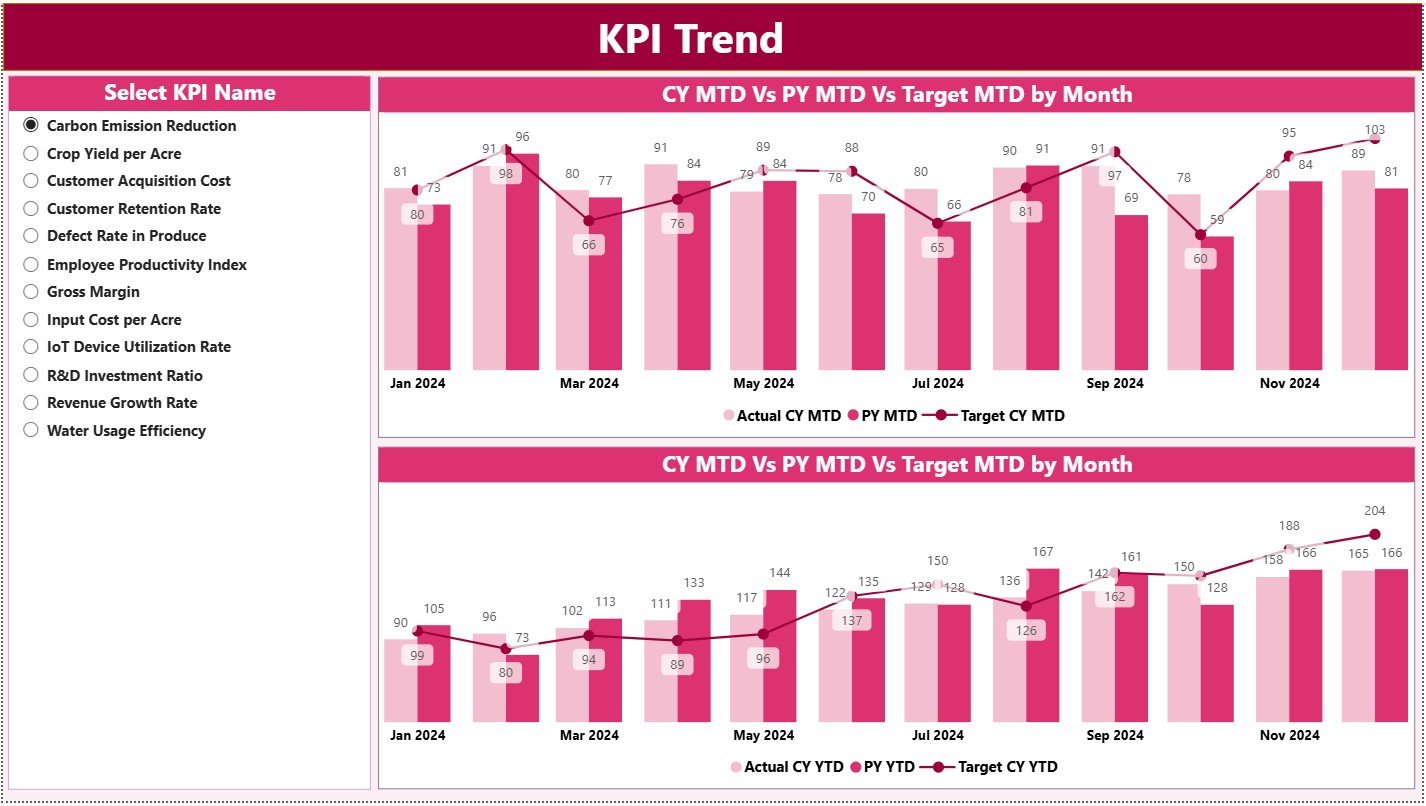
KPI Trend Page – Growth Insights 📈: Visualize your KPIs over time using combo charts for MTD and YTD values. Quickly spot improvements, drops, or inconsistencies in crop yield, delivery, farmer onboarding, and more.
-
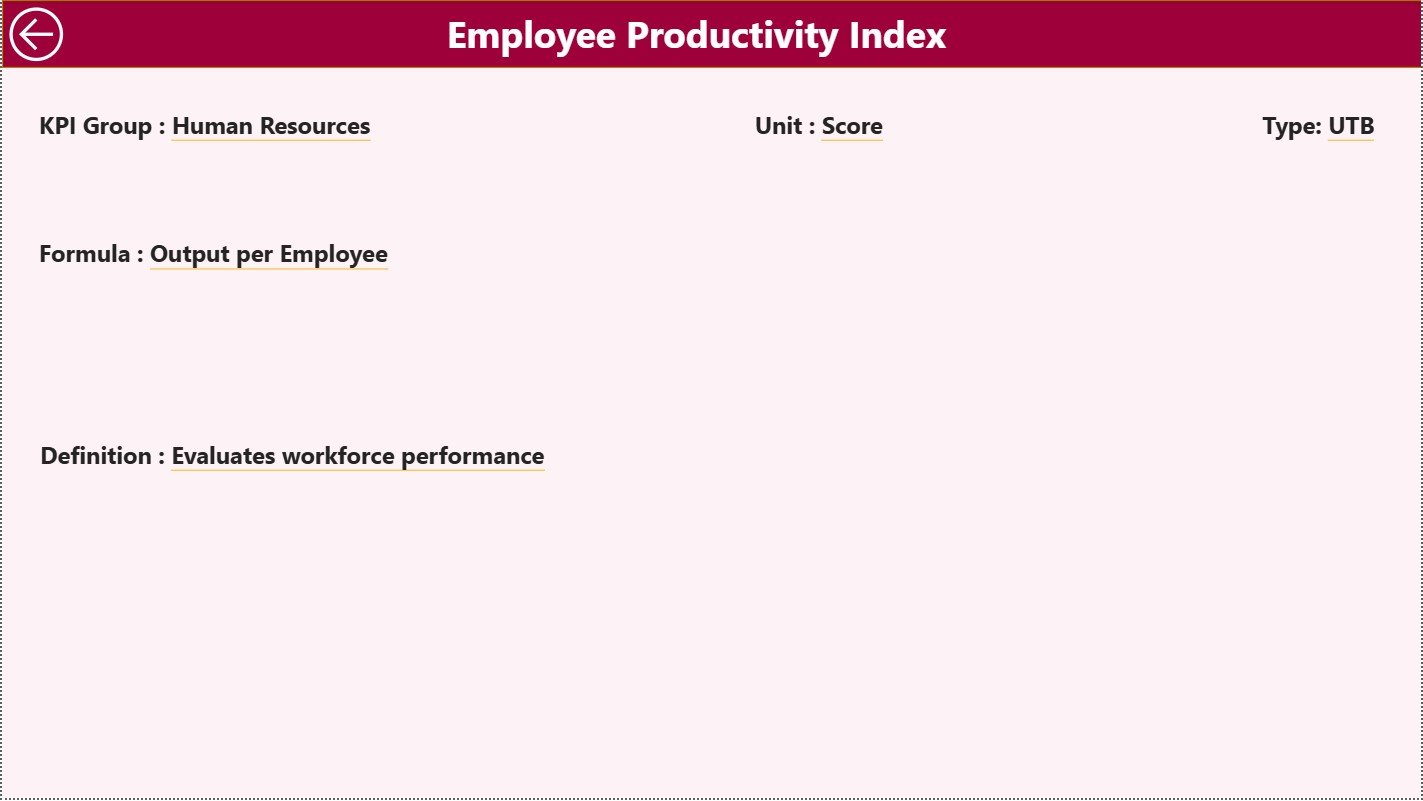
KPI Definition Page – Clear Understanding 🔍: Drill through each KPI for full definitions, formulas, units, and types. Ensure every team member understands metrics correctly, eliminating confusion.
-
Real-Time Updates ⚡: Connected to Excel, the dashboard updates instantly as new data is entered. Stay ahead of performance gaps and emerging opportunities.
-
Customizable KPIs 🛠️: Add or modify KPIs anytime to match your evolving business goals.
What’s Inside the Agri Tech Startups KPI Dashboard 📦
-
Excel Data Source: Three worksheets — Input Actual, Input Target, and KPI Definition — allow easy data entry and ensure Power BI visuals update flawlessly.
-
Summary Page: Cards and tables for MTD and YTD values with visual indicators (green ▲ for met, red ▼ for missed).
-
KPI Trend Page: Track KPIs over months and years with simple combo charts.
-
KPI Definition Page: Detailed KPI information for each metric to ensure clarity.
-
Best Practices Guide: Recommendations for data entry, KPI tracking, and dashboard management.
How to Use the Agri Tech Startups KPI Dashboard 🖥️
-
Update the Excel sheets weekly or monthly with actual and target KPI values.
-
Use the Summary Page to quickly review performance and spot gaps.
-
Check the KPI Trend Page to analyze monthly and yearly patterns.
-
Drill into the KPI Definition Page for explanations of metrics.
-
Apply filters like Month and KPI Group to focus on specific areas of operations.
-
Share visuals with your team for faster, more informed decision-making.
Who Can Benefit from This Agri Tech KPI Dashboard 👥
-
Startup Founders: Gain full visibility into operations and growth opportunities.
-
Operations Managers: Track logistics, crop yield, and service performance efficiently.
-
Analysts: Compare MTD and YTD data to generate actionable insights.
-
Investor Relations Teams: Present data in visually appealing, easy-to-understand dashboards.
-
Growth Teams: Monitor farmer onboarding, app adoption, and regional demand trends.
Whether your focus is improving crop yield, optimizing delivery, or enhancing farmer engagement, this dashboard equips your team to make smart, actionable decisions daily. It’s your all-in-one performance monitoring tool that drives efficiency, reduces wastage, and increases profits.


Reviews
There are no reviews yet.