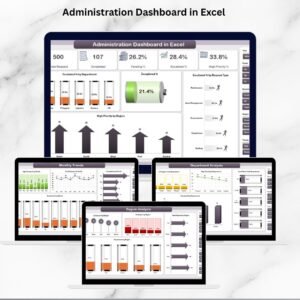
Managing administration tasks across multiple departments and regions can be overwhelming. Requests pile up, deadlines clash, and without a structured system, inefficiencies creep in. That’s why we built the Administration Dashboard in Excel—a ready-to-use, all-in-one tool that transforms how organizations track, analyze, and manage administrative performance.
Instead of juggling multiple spreadsheets, this dashboard centralizes everything into a single, interactive Excel file. With powerful KPIs, smart visuals, and real-time insights, it empowers administrators, managers, and decision-makers to act faster, work
✨ Key Features of Administration Dashboard in Excel
-
📊 Centralized Data View – One dashboard for all departments, regions, and request types.
-
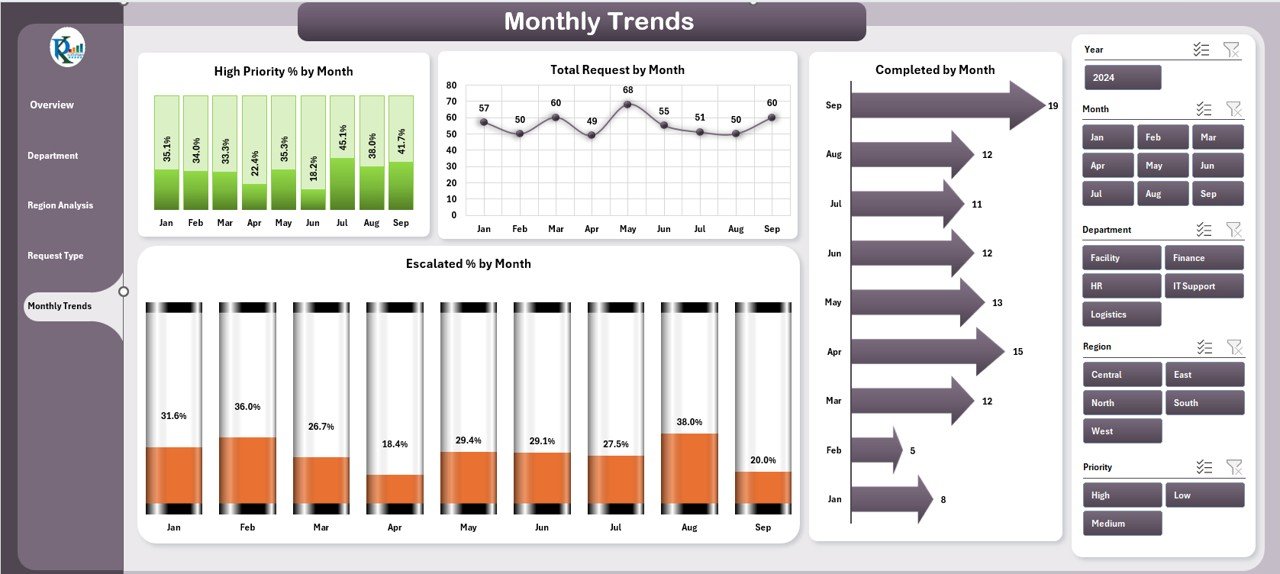
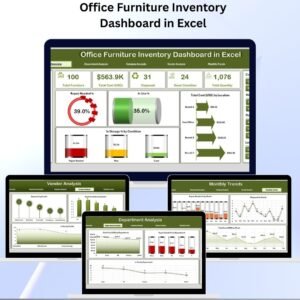
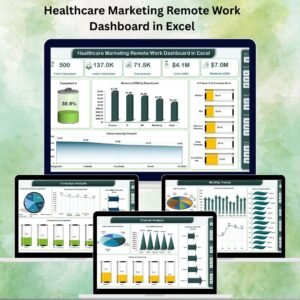
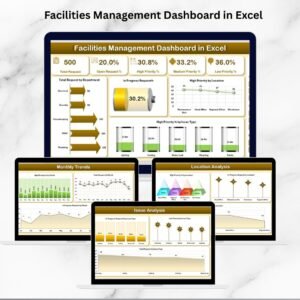
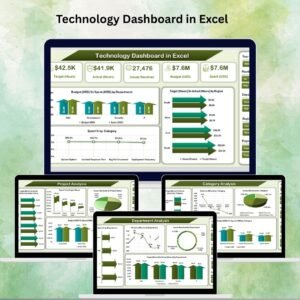
🎯 Five Analytical Pages – Overview, Department, Region, Request Type, and Monthly Trends.
-
⚡ Real-Time Monitoring – Automatic updates when new data is added.
-
🔍 Drill-Down Insights – Department and region-level performance at a glance.
-
🖥 User-Friendly Navigation – Left-side panel for quick movement between sections.
-
📈 Performance Cards & Charts – Visuals for escalated %, high-priority tasks, and monthly progress.
-
🛠 Customizable & Scalable – Add more KPIs or expand the backend as your organization grows.
-
💰 Cost-Effective – Built in Excel—no need for expensive tools or licenses.
📂 What’s Inside the Administration Dashboard
-
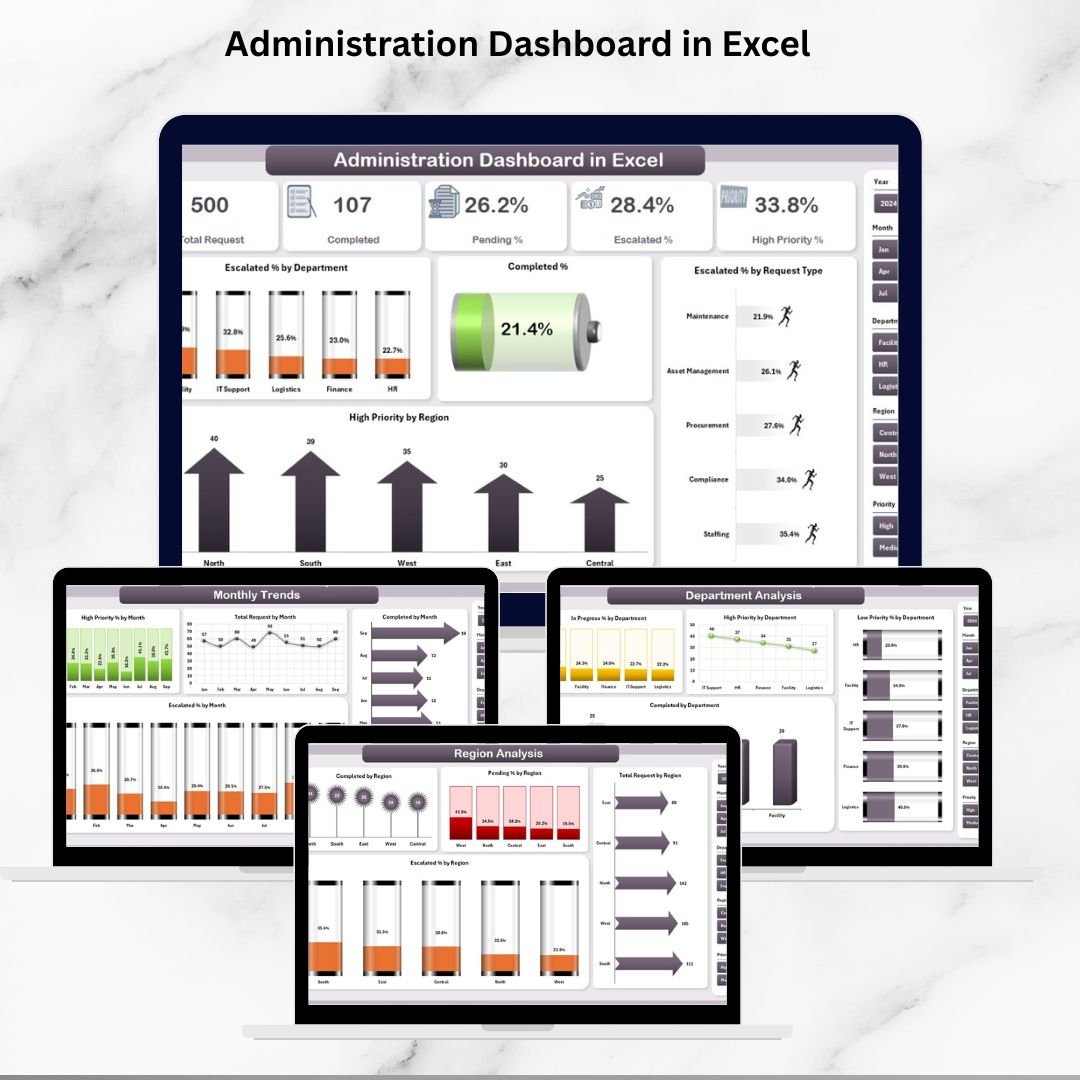
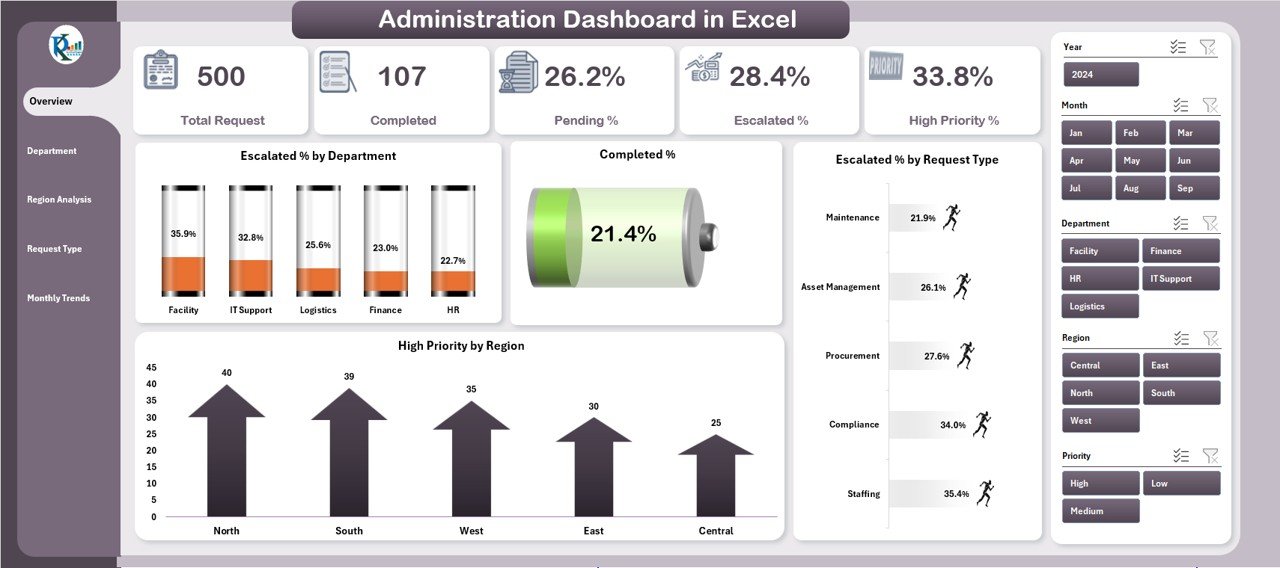
Overview Page – High-level insights with cards and charts (total requests, completed %, escalations, high-priority cases).
-
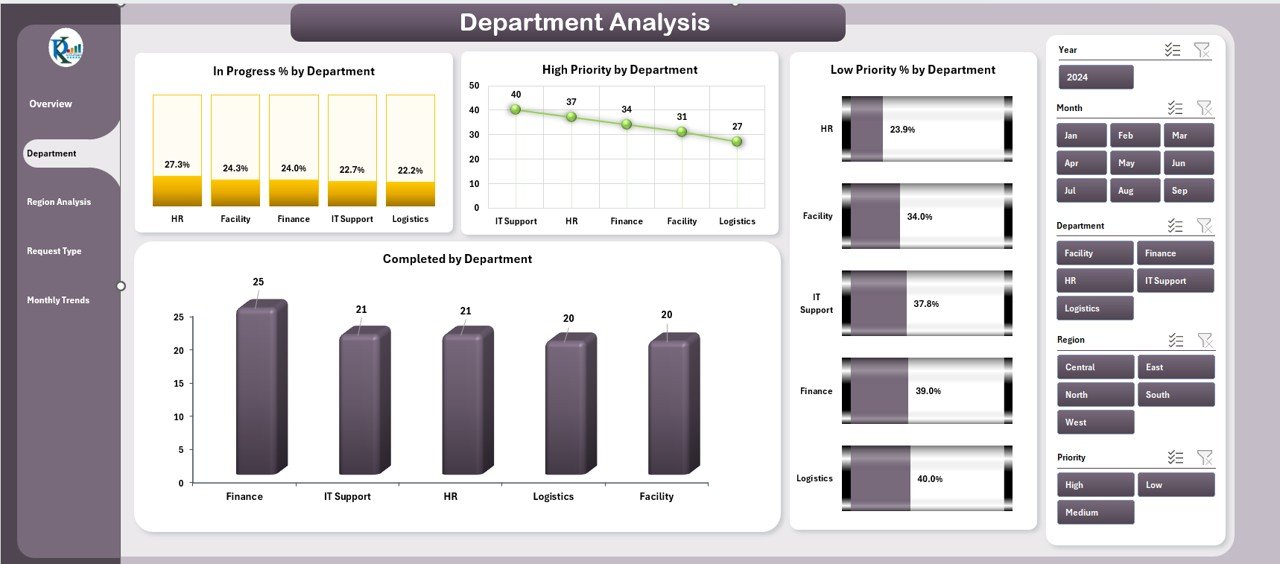
Department Analysis – Performance breakdown by department with in-progress %, high vs low priority, and completions.
-
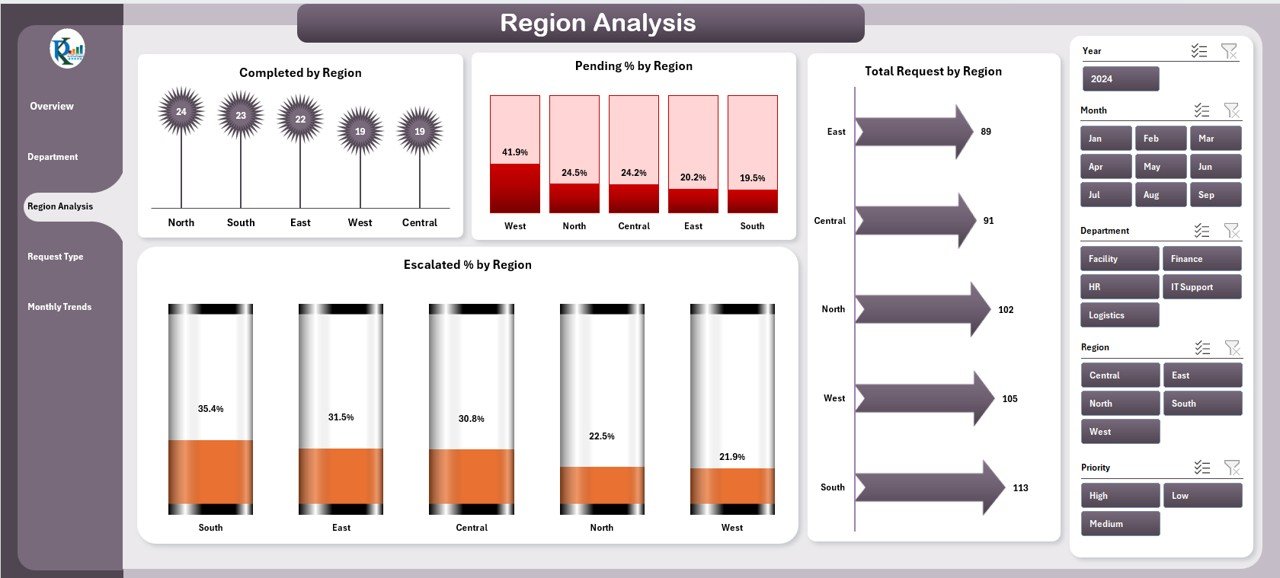
Region Analysis – Track geographical variations: completed %, pending %, escalations, and total requests.
-
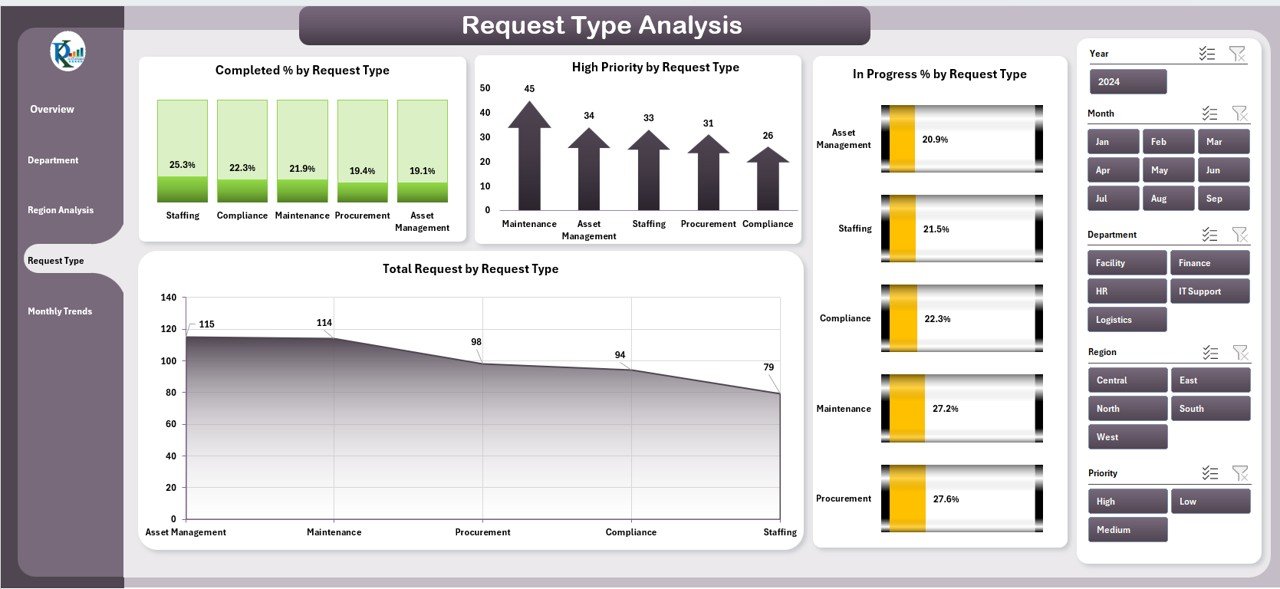
Request Type Analysis – Compare IT, HR, facilities, or compliance requests with visuals for completed, high-priority, and in-progress percentages.
-
Monthly Trends – Identify time-based patterns, seasonal peaks, and forecast workloads with trend charts.
-
Support Sheet – Backend data source powering the dashboard with requests, priorities, departments, and regions.
📖 How to Use the Administration Dashboard
-
Set Up Your Data – Input request details into the support sheet.
-
Update Regularly – Add daily or weekly records to keep the dashboard current.
-
Monitor Performance – Use the Overview page for a quick health check.
-
Drill Into Details – Explore departments, request types, and regional trends.
-
Forecast Trends – Use Monthly Trends to predict future workloads and allocate resources.
👥 Who Can Benefit from This Dashboard?
-
🏢 Corporate Offices – Track administrative requests across HR, IT, and operations.
-
🎓 Educational Institutions – Manage student, faculty, and facility-related tasks.
-
🏥 Healthcare Organizations – Monitor hospital and clinic administrative efficiency.
-
🌍 Non-Profits & NGOs – Ensure transparency and accountability in operations.
-
🏛 Government Departments – Handle public service requests efficiently.
If your team manages multiple requests daily, this dashboard will help you save time, reduce errors, and make smarter decisions.


Reviews
There are no reviews yet.