


In today’s fast-paced digital marketing environment, every advertising dollar counts. Businesses struggle to measure ad performance, optimize campaigns, and understand whether their marketing spend is generating real returns. That’s where the Ad Spend Efficiency KPI Dashboard in Google Sheets comes in—a fully automated, ready-to-use tool that transforms raw campaign data into actionable insights.Ad Spend Efficiency KPI Dashboard in Google Sheets
This Google Sheets dashboard allows marketing teams to track key performance indicators (KPIs) across multiple channels, measure ROI, control budgets, and make data-driven decisions that maximize results. With real-time analytics, interactive visuals, and clear KPI definitions, your campaigns become transparent, accountable, and efficient.Ad Spend Efficiency KPI Dashboard in Google Sheets

✨ Key Features of the Ad Spend Efficiency KPI Dashboard in Google Sheets
This dashboard is built with six fully automated worksheets, each designed to provide a specific layer of insight.
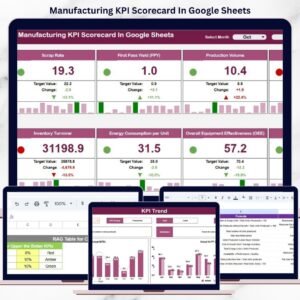
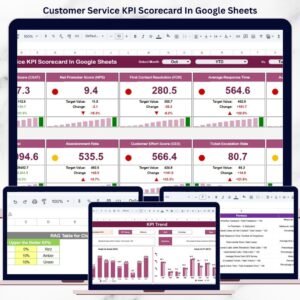
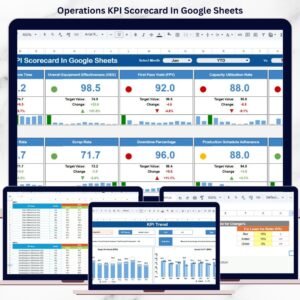
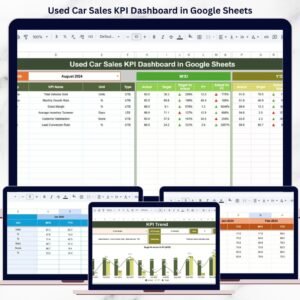
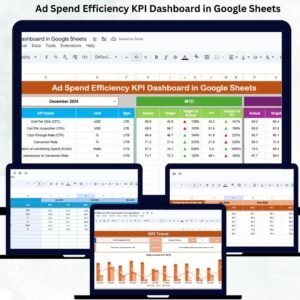
🔹 Dashboard Sheet – The Heart of Campaign Performance
The main page provides a 360° view of your marketing effectiveness. Features include:
-
Month Selector (D3) to view data for any period
-
Automated MTD (Month-to-Date) and YTD (Year-to-Date) calculations
-
Comparison with targets and previous year (PY) data
-
Conditional formatting arrows to highlight performance improvements or declines
This sheet ensures you immediately see which campaigns are performing and which need attention.
🔹 KPI Trend Sheet – Understand Every Metric
Know exactly how each KPI is calculated and defined. The sheet includes:
-
KPI Name and Group
-
Unit of Measurement
-
KPI Type (Lower-the-better or Upper-the-better)
-
Formula and definition
This provides transparency and helps stakeholders understand the logic behind every metric.
🔹 Actual Numbers Sheet – Capture Real Performance
Easily enter monthly MTD and YTD numbers for each KPI. Update the month in Cell E1 to refresh data automatically.
🔹 Target Sheet – Set Performance Benchmarks
Input monthly and yearly targets for all KPIs. The dashboard automatically compares actuals to these targets to highlight gaps.
🔹 Previous Year Number Sheet – Historical Analysis
Track YoY performance by entering last year’s data. This helps you understand trends, seasonality, and improvements.
🔹 KPI Definition Sheet – Master Metric Table
Store all KPI names, groups, units, formulas, and definitions in one place. This acts as a single source of truth for your marketing performance metrics.
📦 What’s Inside the Ad Spend Efficiency KPI Dashboard in Google Sheets
When you download this template, you receive:
-
6 interactive and automated worksheets
-
Built-in formulas and conditional formatting
-
Clear visualizations of actual vs target vs PY
-
Easy-to-understand KPI definitions
-
Trend charts for each KPI
-
Monthly and yearly analysis
-
Fully customizable structure for your marketing needs
With this structure, marketing teams can immediately start monitoring performance and optimizing ad spend without manual calculations.
🛠️ How to Use the Ad Spend Efficiency KPI Dashboard
-
Input Actual Performance Data – Enter MTD and YTD values in the Actual Numbers Sheet.
-
Set Targets – Add monthly and yearly targets for all KPIs.
-
Enter Previous Year Data – For YoY comparisons and trend analysis.
-
Select Month – Use the dropdown to automatically refresh all visuals.
-
Analyze Trends – Review KPI trends to spot high-performing and underperforming campaigns.
-
Optimize Budget – Shift resources to high-ROI channels, reduce waste, and improve marketing efficiency.
Even beginners can maintain this dashboard, thanks to its simple Google Sheets interface.
👥 Who Can Benefit from This Ad Spend Efficiency Dashboard
📈 Marketing Managers
Track campaign efficiency and ROI in real time to make informed decisions.
💼 Digital Agencies
Provide clients with transparent reporting and actionable insights.
📊 Finance Teams
Monitor advertising spend, budget allocation, and variance against targets.
🧩 Multi-Channel Marketers
Compare performance across multiple platforms in one place.
🧠 Marketing Analysts
Identify trends, reduce costs, and optimize ad campaigns using data-driven insights.
Click here to read the Detailed blog post
Visit our YouTube channel to learn step-by-step video tutorials
Watch the step-by-step video Demo:
Visit our YouTube channel to learn step-by-step video tutorials


Reviews
There are no reviews yet.