

The 12 real estate KPIs that matter most in 2026 are occupancy rate, vacancy rate, net operating income (NOI), operating expense ratio, cap rate, cash-on-cash return, debt service coverage ratio, gross rent multiplier, rent collection rate, tenant turnover, loan-to-value and internal rate of return. Track them together to judge income, value, financing risk and operations.
Last updated: September 2026
Key takeaways
- The core four investors are asked for first are NOI, cap rate, cash-on-cash return and DSCR — get these right before anything else.
- A healthy stabilised residential asset runs 90–95%+ occupancy, an operating expense ratio of 35–45%, and a DSCR of 1.25x or better.
- Every KPI here comes with an exact formula and a realistic benchmark range, so you can benchmark your own portfolio in minutes.
- The Rental Property Investment Dashboard in Excel ($17.99) calculates NOI, cap rate, cash-on-cash and GRM for you from a single input sheet.
- All 8 ready-made dashboards below span Excel, Power BI, Google Sheets and HTML, priced from $9.99 to $17.99.
Real estate KPI dashboard templates compared
| Template | Format | Best for | Price |
|---|---|---|---|
| Rental Property Investment Dashboard (Best overall) | Excel | NOI, cap rate, cash-on-cash, GRM in one file | $17.99 |
| Rental Property Investment Dashboard | Power BI | Multi-property portfolios & IRR trend | $17.99 |
| Tenant & Property Management Dashboard | Google Sheets | Occupancy, rent collection, turnover | $9.99 |
| Rental Property Investment Dashboard (Best value) | Google Sheets | Cloud-based investors on a budget | $9.99 |
| Rental Property Investment Dashboard | HTML | Web/no-software sharing with partners | $12.99 |
| Construction & Real Estate Risk Management KPI Dashboard | Excel | DSCR, LTV, risk scoring | $14.99 |
| Construction & Real Estate Process Improvement KPI Dashboard | Excel | Operational efficiency KPIs | $14.99 |
| Construction & Real Estate Market Expansion KPI Dashboard | Excel | Growth & market-entry metrics | $14.99 |
How we picked these KPIs and templates
We searched the full NextGenTemplates catalogue of 1,000+ business templates and shortlisted every product built specifically for property investors, landlords and real estate operators. We prioritised templates that calculate the industry-standard investment ratios — NOI, cap rate, cash-on-cash and DSCR — rather than generic finance sheets relabelled for property.
The 12 metrics themselves were chosen because they are the ones lenders, brokers and limited partners actually ask for. Definitions and benchmark ranges are aligned with standard commercial real estate practice; national vacancy benchmarks are cross-checked against the U.S. Census Bureau Housing Vacancies and Homeownership survey. We excluded vanity metrics like raw website leads that do not tie to asset performance.
The 12 real estate KPIs to track in 2026
Use this table as your quick-reference card, then read the detail below each metric for the formula, a realistic benchmark, and the mistake teams most often make.
| Metric | Formula | Benchmark | Where to see it |
|---|---|---|---|
| 1. Occupancy Rate | Occupied units ÷ Total units × 100 | 90–95%+ | Tenant & Property Management Dashboard |
| 2. Vacancy Rate | Vacant unit-days ÷ Total available unit-days × 100 | <5–8% | Tenant & Property Management Dashboard |
| 3. Net Operating Income (NOI) | Gross Operating Income − Operating Expenses | Positive & rising YoY | Rental Property Investment Dashboard |
| 4. Operating Expense Ratio (OER) | Operating Expenses ÷ Gross Operating Income × 100 | 35–45% | Rental Property Investment Dashboard |
| 5. Capitalization Rate (Cap Rate) | NOI ÷ Current Market Value × 100 | 4–10% | Rental Property Investment Dashboard |
| 6. Cash-on-Cash Return | Annual Pre-Tax Cash Flow ÷ Total Cash Invested × 100 | 8–12% | Rental Property Investment Dashboard |
| 7. Debt Service Coverage Ratio (DSCR) | NOI ÷ Total Debt Service | ≥1.25x | Risk Management KPI Dashboard |
| 8. Gross Rent Multiplier (GRM) | Property Price ÷ Gross Annual Rent | 4–7 | Rental Property Investment Dashboard |
| 9. Rent Collection Rate | Rent Collected ÷ Rent Billed × 100 | ≥98% | Tenant & Property Management Dashboard |
| 10. Tenant Turnover Rate | Move-outs in period ÷ Total units × 100 | 10–20%/yr | Tenant & Property Management Dashboard |
| 11. Loan-to-Value (LTV) | Loan Balance ÷ Property Value × 100 | 65–80% | Risk Management KPI Dashboard |
| 12. Internal Rate of Return (IRR) | Discount rate where NPV of all cash flows = 0 | 12–20% (value-add) | Rental Property Investment Dashboard (Power BI) |
1. Occupancy Rate
Occupancy rate is the share of your rentable units that are currently leased and generating income. Formula: Occupied units ÷ Total units × 100. Benchmark: 90–95%+ for a stabilised residential asset; class-A multifamily often targets 95%+. The mistake teams make: reporting physical occupancy (a unit is “occupied”) while ignoring economic occupancy — a unit with a non-paying tenant or a deep concession is occupied on paper but earning little. Track both.
2. Vacancy Rate
Vacancy rate is the mirror of occupancy: the share of available capacity that sat empty over a period. Formula: Vacant unit-days ÷ Total available unit-days × 100. Benchmark: below 5–8% is healthy for most markets. The mistake teams make: measuring vacancy at a single snapshot date instead of across the whole period, which hides units that turned over twice. Use unit-days, not a month-end count.
3. Net Operating Income (NOI)
NOI is the property’s income after operating costs but before mortgage payments and taxes — the single most important number in real estate. Formula: Gross Operating Income − Operating Expenses. Benchmark: there is no universal figure; it should be positive and growing year over year. The mistake teams make: subtracting debt service or capital expenditure inside NOI. Loan payments and roof replacements are below the NOI line — putting them in makes every property look worse than the market thinks it is.
4. Operating Expense Ratio (OER)
OER shows how much of your income is eaten by running the property. Formula: Operating Expenses ÷ Gross Operating Income × 100. Benchmark: 35–45% for well-run residential; older or amenity-heavy assets run higher. The mistake teams make: celebrating a falling OER without checking why — a ratio that drops because maintenance was deferred is borrowing from next year’s NOI.
5. Capitalization Rate (Cap Rate)
Cap rate expresses NOI as a yield on the property’s value, letting you compare deals of different sizes. Formula: NOI ÷ Current Market Value × 100. Benchmark: 4–10% depending on market and asset class — prime metros compress toward 4–5%, secondary markets sit higher. The mistake teams make: using the purchase price forever. Cap rate must be recalculated against current value to be meaningful.
6. Cash-on-Cash Return
Cash-on-cash return measures the annual cash yield on the actual cash you put in, after financing. Formula: Annual Pre-Tax Cash Flow ÷ Total Cash Invested × 100. Benchmark: 8–12% is a common target for leveraged residential deals. The mistake teams make: forgetting closing costs, lender fees and initial capital reserves in the denominator, which flatters the return.
7. Debt Service Coverage Ratio (DSCR)
DSCR tells a lender whether the property earns enough to cover its loan payments. Formula: NOI ÷ Total Debt Service. Benchmark: 1.25x is the typical minimum lenders want; below 1.0x the property cannot cover its own debt. The mistake teams make: using in-place rents at signing but ignoring that a single large move-out can push DSCR under covenant and trigger a default clause. Stress-test it.
8. Gross Rent Multiplier (GRM)
GRM is a fast back-of-envelope valuation screen based on gross rent alone. Formula: Property Price ÷ Gross Annual Rent. Benchmark: 4–7 in many rental markets — lower is generally cheaper relative to rent. The mistake teams make: treating GRM as a decision metric. It ignores expenses entirely, so it is a screening tool only, never a substitute for NOI and cap rate.
9. Rent Collection Rate
Rent collection rate is the share of billed rent you actually collected in the period. Formula: Rent Collected ÷ Rent Billed × 100. Benchmark: 98%+ for a well-managed residential portfolio. The mistake teams make: reporting collections against expected rent rather than billed rent, which quietly writes off delinquency instead of surfacing it.
10. Tenant Turnover Rate
Turnover rate captures how often tenants leave, each move-out costing you make-ready, downtime and re-leasing fees. Formula: Move-outs in period ÷ Total units × 100. Benchmark: 10–20% per year is typical for residential; commercial leases turn far less. The mistake teams make: chasing top-of-market rent increases that push turnover up — the vacancy and make-ready cost of a lost tenant often exceeds the extra rent.
11. Loan-to-Value (LTV)
LTV measures how leveraged a property is against its market value. Formula: Loan Balance ÷ Property Value × 100. Benchmark: 65–80% for most income-property lending; lower LTV means more equity cushion. The mistake teams make: tracking LTV against the original appraisal only. In a soft market, falling values raise LTV even as you pay the loan down — refresh the value input.
12. Internal Rate of Return (IRR)
IRR is the annualised return across the whole hold, accounting for the timing of every cash flow including the eventual sale. Formula: the discount rate at which the net present value of all cash flows equals zero. Benchmark: 12–20% is a common target for value-add strategies. The mistake teams make: quoting IRR without the hold period or the exit assumption — a 20% IRR over two years and over ten years are wildly different bets.
Skip the formula-building. The Rental Property Investment Dashboard in Excel calculates NOI, cap rate, cash-on-cash return and GRM automatically from one input sheet — just $17.99, instant download.
The 8 real estate KPI dashboards that already calculate these metrics
Each template below is mapped to the KPIs it computes for you, so you can match the dashboard to the metrics you actually report. Prices are current at the time of writing.
1. Rental Property Investment Dashboard in Excel — best overall
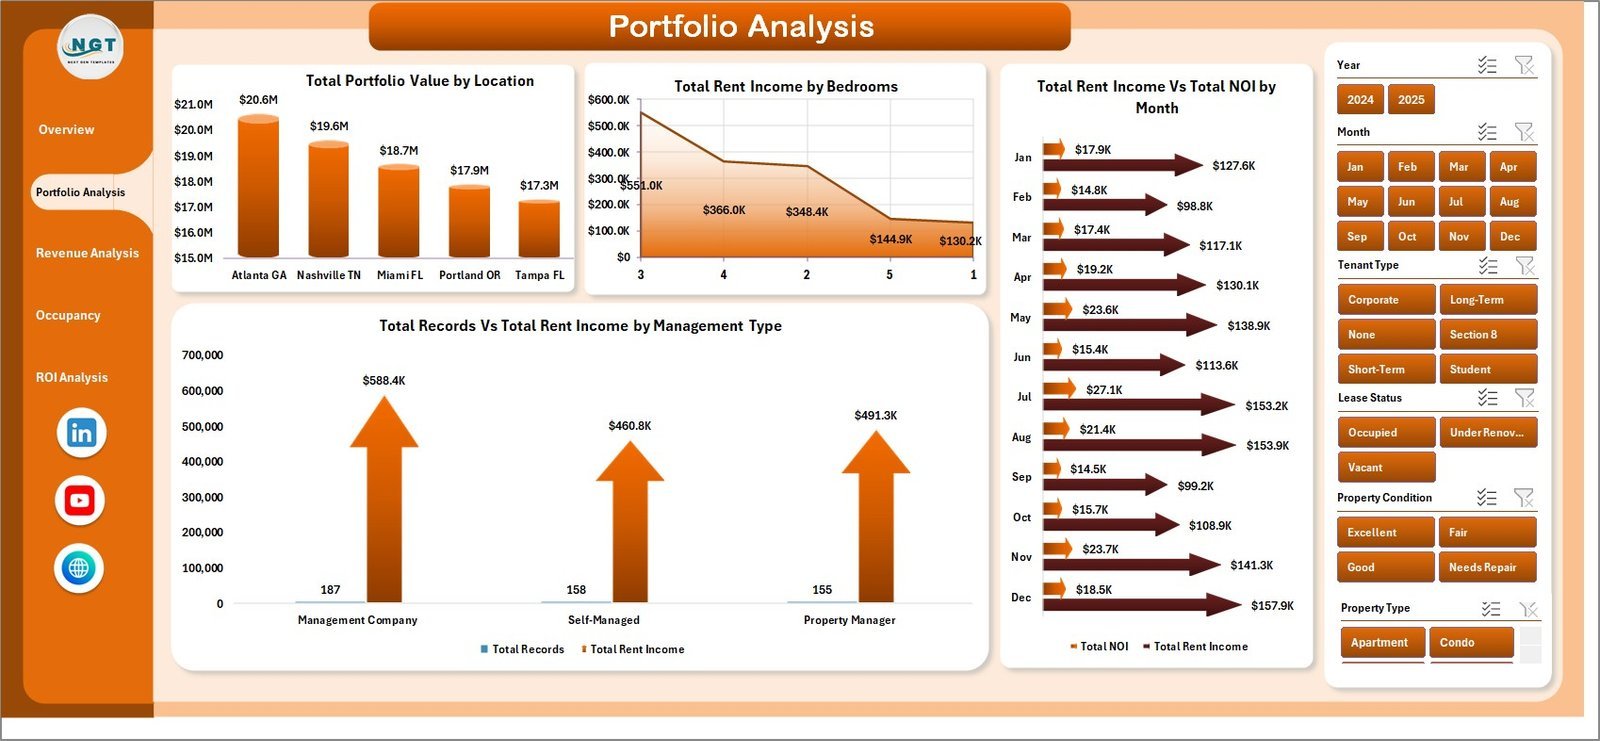
What it is: a single-file Excel dashboard that turns rent, expense and financing inputs into every core investment ratio. Who it is for: individual landlords and small investors who live in Excel.
- Auto-calculates NOI, cap rate, cash-on-cash return, OER and GRM
- Per-property and portfolio roll-up views
- Income and expense breakdowns with charts
- No add-ins — works in any modern Excel
Use cases with numbers: a 6-unit building at $18,700/mo gross rent and 40% OER shows NOI, then its 6.2% cap rate against a $1.35M value; model a rent bump and watch cash-on-cash move from 9% to 11%. Price: $17.99. Buy the Excel dashboard →
Best for: the fastest way to get every investment KPI in one place.
2. Rental Property Investment Dashboard in Power BI — best for portfolios
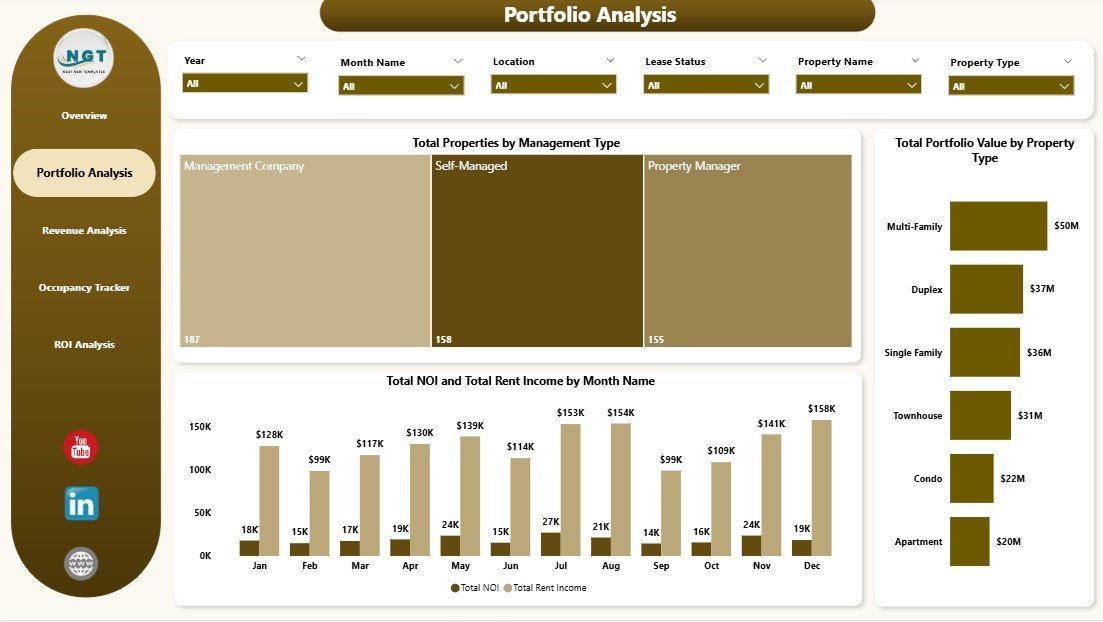
What it is: the same investment model rebuilt as an interactive Power BI report. Who it is for: investors with several properties who want slicers, drill-down and an IRR trend line.
- Cross-filter NOI and cap rate by location, asset class or year
- Portfolio-level cash-on-cash and IRR trend
- Refreshable from an Excel or CSV source
Use cases with numbers: compare a 5.1% cap-rate metro asset against a 7.8% secondary-market one on one canvas; filter to a single owner entity and read blended DSCR. Price: $17.99. Buy the Power BI dashboard →
Best for: multi-property portfolios and interactive reporting.
3. Tenant & Property Management Dashboard in Google Sheets
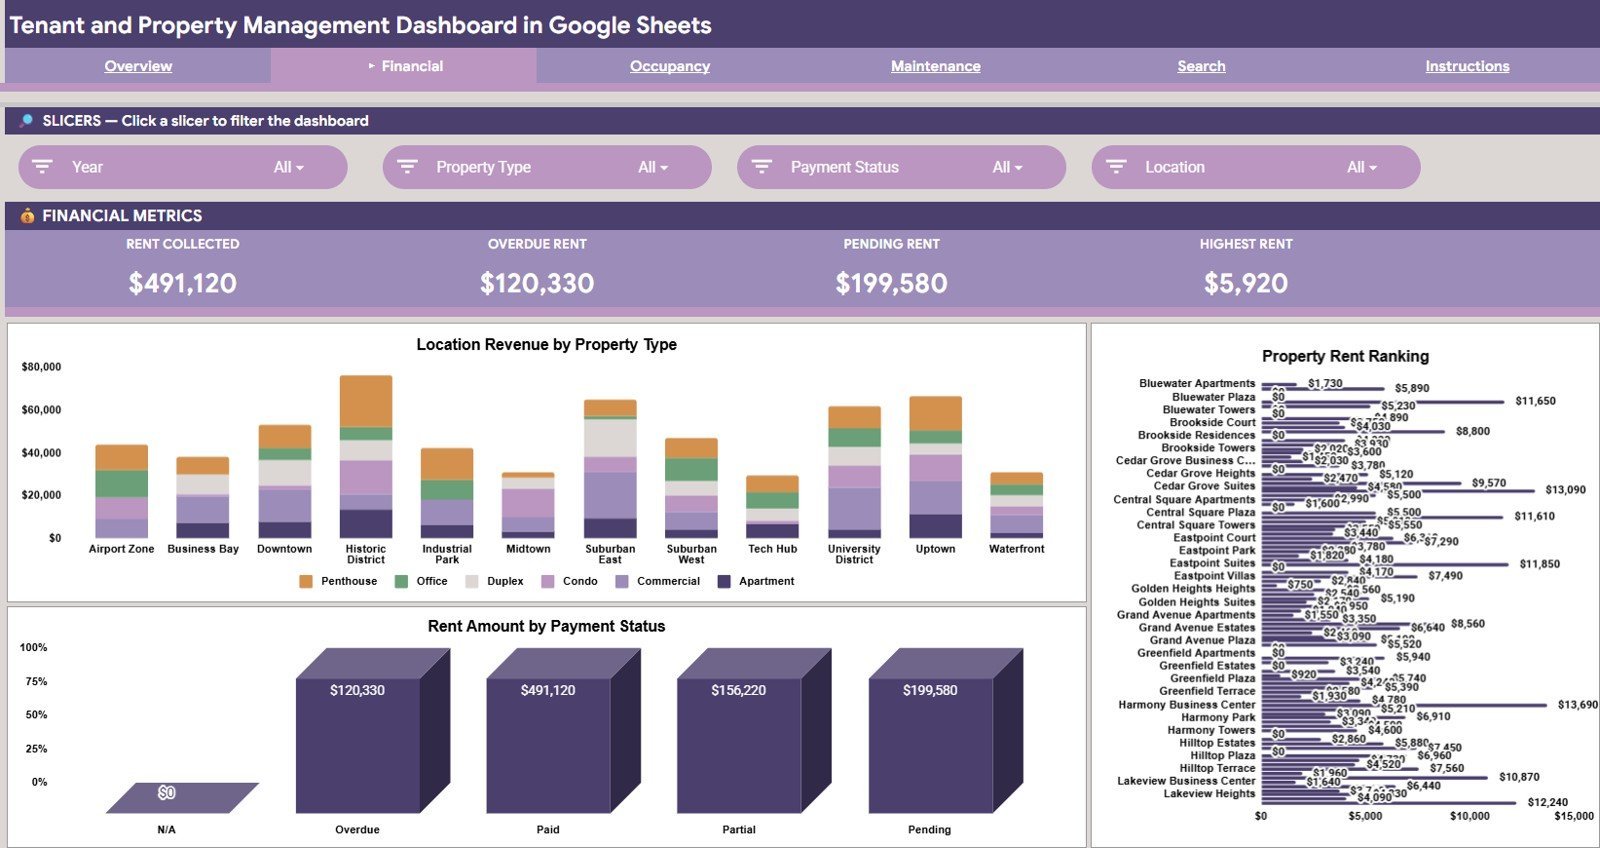
What it is: the operations counterpart, focused on the day-to-day management KPIs. Who it is for: landlords and property managers who need occupancy, rent collection and turnover at a glance.
- Occupancy and vacancy rate tracking
- Rent collection and delinquency monitoring
- Tenant turnover and lease-expiry views
- Cloud-based, shareable with a co-manager
Use cases with numbers: flag a property that slipped from 96% to 89% occupancy; spot a 94% collection rate that signals rising delinquency. Price: $9.99. Buy the tenant management dashboard →
Best for: operations-side occupancy, collection and turnover KPIs.
4. Rental Property Investment Dashboard in Google Sheets — best value
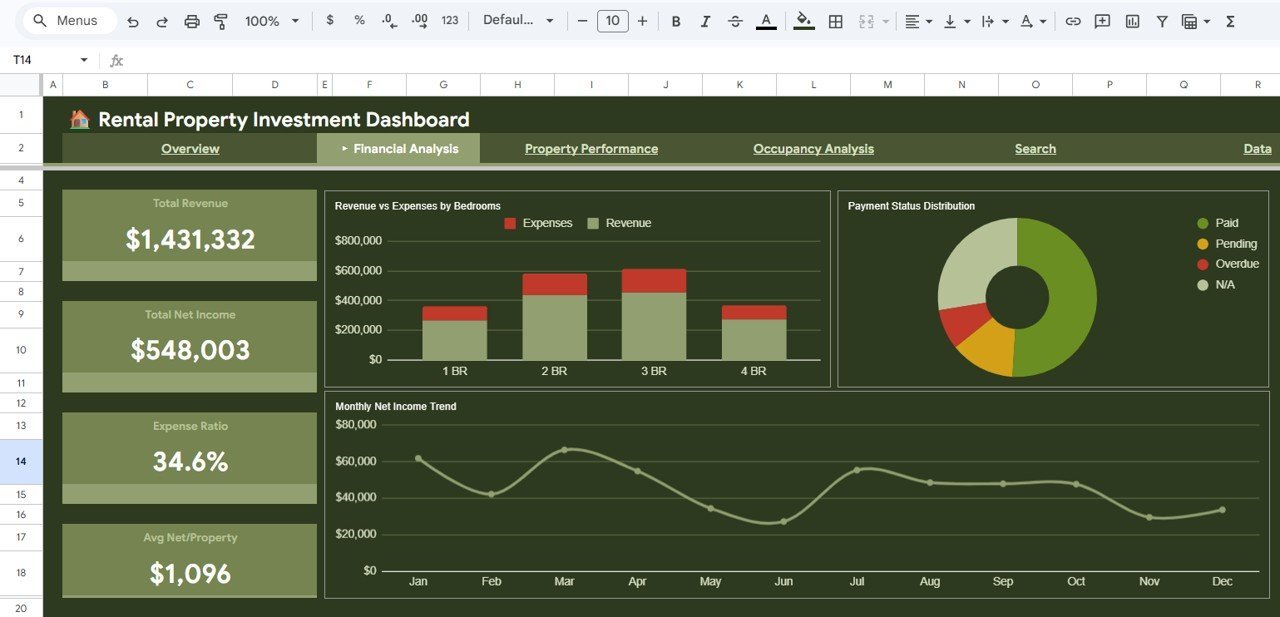
What it is: the full investment model in Google Sheets at the lowest price point. Who it is for: cloud-first investors who want the core KPIs without buying Excel or Power BI.
- NOI, cap rate, cash-on-cash and GRM in the browser
- Real-time collaboration and version history
- Works on any device
Use cases with numbers: share a live deal model with a partner and update rent assumptions together; screen five listings by GRM in an afternoon. Price: $9.99. Buy the Google Sheets dashboard →
Best for: the best price-to-capability ratio in the list.
5. Rental Property Investment Dashboard in HTML
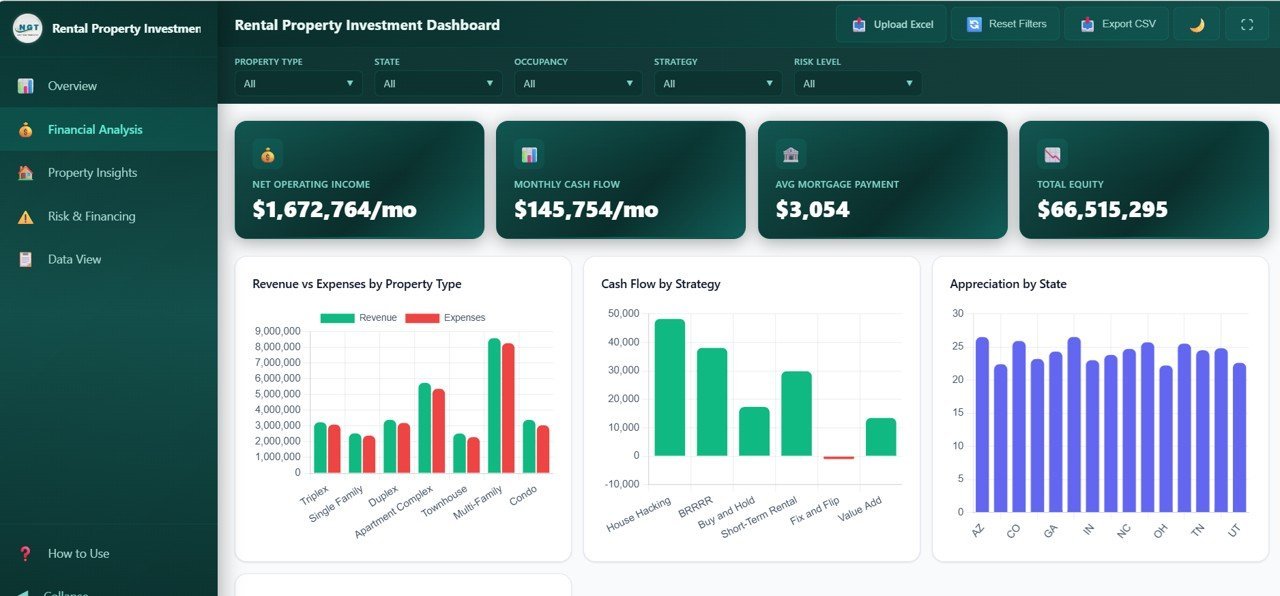
What it is: a browser-based version you can open with no spreadsheet software at all. Who it is for: investors sharing figures with partners or clients who do not use Excel.
- Opens in any web browser
- Presents NOI, cap rate and cash-flow visually
- Easy to embed or hand off
Use cases with numbers: send a clean web view of a $1.2M deal’s 6.5% cap rate to an LP who never opens spreadsheets. Price: $12.99. Buy the HTML dashboard →
Best for: no-software sharing with non-spreadsheet partners.
6. Construction & Real Estate Risk Management KPI Dashboard in Excel

What it is: a risk-focused KPI dashboard for the financing and exposure side of real estate. Who it is for: developers and investors who report DSCR, LTV and risk scores to lenders.
- DSCR and LTV monitoring against covenants
- Risk scoring and exposure views
- Excel-native, easy to extend
Use cases with numbers: catch a property whose DSCR slipped to 1.18x before the covenant test; track a portfolio LTV creeping past 78%. Price: $14.99. Buy the risk management dashboard →
Best for: financing-risk KPIs — DSCR and LTV.
7. Construction & Real Estate Process Improvement KPI Dashboard in Excel
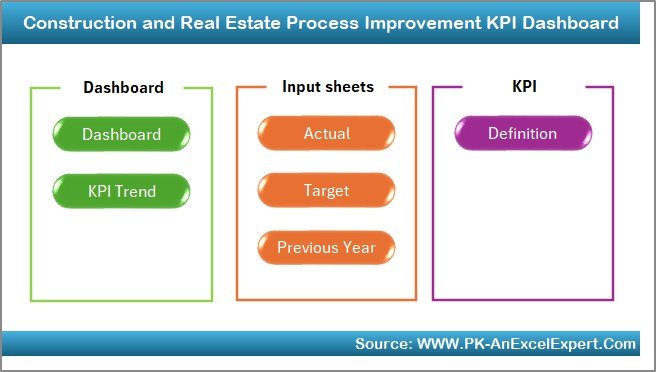
What it is: an operations-efficiency KPI dashboard for teams improving delivery and turnaround. Who it is for: operators tracking make-ready times, cost variance and process cycle times.
- Cycle-time and turnaround KPIs
- Cost and schedule variance tracking
- Trend charts for continuous improvement
Use cases with numbers: reduce average unit make-ready from 21 to 14 days and see the vacancy-cost impact; track cost variance against budget by project. Price: $14.99. Buy the process improvement dashboard →
Best for: operational efficiency and turnaround KPIs.
8. Construction & Real Estate Market Expansion KPI Dashboard in Excel
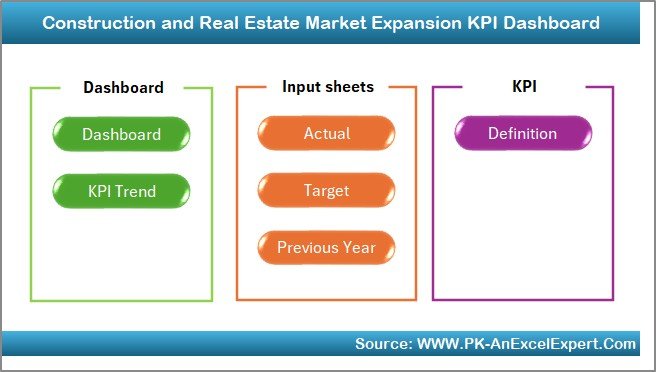
What it is: a growth-focused KPI dashboard for firms entering new markets or scaling a portfolio. Who it is for: teams tracking pipeline, market-entry and expansion metrics.
- Market-entry and pipeline KPIs
- Growth and acquisition tracking
- Comparison views across markets
Use cases with numbers: compare projected cap rates across three target metros before committing capital; track units acquired against an annual growth target. Price: $14.99. Buy the market expansion dashboard →
Best for: growth and market-entry KPIs.
How to choose between them
| If you need… | Choose | Price |
|---|---|---|
| Every investment ratio in one Excel file | Rental Property Investment Dashboard (Excel) | $17.99 |
| Interactive multi-property reporting | Rental Property Investment Dashboard (Power BI) | $17.99 |
| Occupancy, collection & turnover ops | Tenant & Property Management Dashboard | $9.99 |
| The lowest-cost full investment model | Rental Property Investment Dashboard (Google Sheets) | $9.99 |
| Financing-risk KPIs (DSCR, LTV) | Risk Management KPI Dashboard | $14.99 |
Quick rule: if you invest, start with the Rental Property Investment Dashboard in the format you already use. If you manage units day to day, add the Tenant & Property Management Dashboard. If a lender is involved, add the Risk Management dashboard for DSCR and LTV. Deciding between buying several singles or a full set? Our guide to template bundles vs single templates runs the maths.
When a KPI dashboard is NOT the right answer
A spreadsheet dashboard is the right tool for a portfolio you can reasonably manage in a file — up to a few dozen units, or a handful of deals under evaluation. It is honestly not the right answer in three cases:
- Hundreds of units with live accounting. If you need automated rent ledgers, bank reconciliation and maintenance workflows, buy dedicated property-management software (AppFolio, Buildium, Yardi) — a template cannot replace a transactional system.
- Audited institutional reporting. Fund-level reporting to LPs with GAAP requirements needs accounting software plus a controller, not a dashboard.
- Real-time data feeds. If your KPIs must update from live bank and PMS APIs every hour, you need an integrated BI pipeline, not a manually refreshed file.
For everyone else — individual landlords, small investors, and analysts modelling deals — a well-built dashboard is faster, cheaper and more transparent than software you have to configure for weeks.
Frequently asked questions
What are the most important real estate KPIs?
The four most requested real estate KPIs are net operating income (NOI), capitalization rate, cash-on-cash return and debt service coverage ratio. Together they answer whether a property earns money, what it is worth, what it yields on your cash, and whether it can safely cover its loan — the questions every lender and investor asks first.
How do you calculate NOI?
Net operating income is gross operating income minus operating expenses. Include rent and other property income; include property management, taxes, insurance, utilities and maintenance in expenses. Do not subtract mortgage payments, depreciation or capital expenditure — those sit below the NOI line and belong to separate cash-flow and financing calculations.
What is a good cap rate in 2026?
A good cap rate depends entirely on market and asset class. Prime metropolitan multifamily can trade at 4–5%, while secondary markets and higher-risk assets often sit at 7–10%. A higher cap rate means more income per dollar of value but usually more risk. Always compare cap rates within the same market and property type.
What is a healthy occupancy rate?
For a stabilised residential rental, 90–95%+ occupancy is healthy, and class-A multifamily often targets 95% or higher. Below 90% for an extended period signals a pricing, condition or management problem. Track economic occupancy, not just physical occupancy, so non-paying units do not inflate the figure.
What DSCR do lenders require?
Most commercial real estate lenders want a debt service coverage ratio of at least 1.25x, meaning NOI covers loan payments 1.25 times over. Some agency and low-risk programs accept 1.20x; value-add or construction lending may demand 1.30x or more. A DSCR below 1.0x means the property cannot cover its own debt.
What is the difference between cap rate and cash-on-cash return?
Cap rate measures NOI against the property’s full value and ignores financing, so it compares assets on an unlevered basis. Cash-on-cash return measures annual pre-tax cash flow against the actual cash you invested, after the mortgage. Cap rate judges the asset; cash-on-cash judges your specific, leveraged position in it.
How often should I update my real estate KPIs?
Review operational KPIs — occupancy, rent collection and turnover — monthly, because they change fast and drive cash flow. Review investment KPIs — cap rate, DSCR and LTV — at least quarterly and whenever value or debt changes materially. A dashboard that recalculates from one input sheet makes this a few minutes’ work.
Can I track these KPIs in Google Sheets instead of Excel?
Yes. The Rental Property Investment Dashboard in Google Sheets ($9.99) and the Tenant & Property Management Dashboard ($9.99) calculate the same metrics in the browser, with real-time collaboration and version history, so you never need a desktop spreadsheet app.
What is the difference between GRM and cap rate?
Gross rent multiplier uses gross rent only and ignores expenses, so it is a fast screening tool: property price divided by gross annual rent. Cap rate uses NOI, which is income after operating expenses, so it reflects true profitability. Use GRM to shortlist listings quickly, then confirm with cap rate and cash-on-cash before you buy.
Do these dashboards work for commercial as well as residential property?
The investment ratios — NOI, cap rate, cash-on-cash, DSCR and IRR — apply to both residential and commercial real estate, so the Rental Property Investment and Risk Management dashboards work for either. Some operational benchmarks, such as tenant turnover, differ between the two, since commercial leases run far longer than residential ones.
Get more real estate templates
Ready to track every real estate KPI without building a single formula? Start with the Rental Property Investment Dashboard in Excel at $17.99, or grab the Google Sheets edition for just $9.99. Browse the full real estate and rental property templates collection for landlords and investors.
Prefer a walkthrough first? Watch our template demos on the NextGenTemplates YouTube channel.
Building out your wider reporting stack? See our companion guides to sales KPIs, retail KPIs, social media KPIs and logistics & OTIF KPIs — each pairs the metric formulas with ready-made dashboard templates the same way this guide does.