

Ecommerce KPIs are the metrics that tell you whether your store actually makes money, not just noise. The 15 that matter most in 2026 are AOV, CAC, LTV, LTV:CAC ratio, conversion rate, cart abandonment, gross margin, repeat purchase rate, retention, churn, ROAS, return rate, revenue per visitor, purchase frequency and fulfillment cycle time. Each has a simple formula and a benchmark range you can act on today.
Last updated: September 2026
Key takeaways
- Track profit-side ecommerce KPIs (CAC, LTV, gross margin) alongside traffic metrics — a rising Average Order Value funded by discounts can quietly destroy margin.
- The single healthiest ratio in ecommerce is LTV:CAC ≥ 3:1; below 1:1 every new customer loses money.
- The average online cart abandonment rate is roughly 70% (Baymard Institute), so recovery emails and one-click checkout are worth more than most ad tests.
- You do not need a $2,000/month analytics stack: the E-commerce KPI Dashboard in Excel calculates most of these 15 metrics for $14.99.
- Eight ready-made NGT dashboards below map directly to these KPIs across Excel, Google Sheets and Power BI, priced from $5.99 to $39.99.
Ecommerce KPI dashboard templates compared
| Template | Format | Best for | Price |
|---|---|---|---|
| E-commerce KPI Dashboard in Excel (Best overall) | Excel | One-page view of AOV, conversion, revenue and margin | $14.99 |
| E-commerce KPI Dashboard in Power BI (Best value) | Power BI | Interactive, filterable KPI reporting | $11.99 |
| E-commerce Order Fulfillment Tracking System Web App | Google Sheets / Web App | Order status & fulfillment cycle time | $39.99 |
| Shopify Store Dashboard in Excel | Excel | Shopify sellers who export to spreadsheets | $17.99 |
| Shopify Store Dashboard in Power BI | Power BI | Shopify sellers who want live visuals | $17.99 |
| Sales Dashboard For Online Store in Excel | Excel | Product-wise and monthly sales tracking | $17.99 |
| Online Marketplaces KPI Dashboard in Excel | Excel | Amazon / eBay / Etsy multi-channel sellers | $14.99 |
| Online Order Tracker Data Entry System in Excel | Excel | Cheapest entry point for order tracking | $5.99 |
How we picked these
We searched the full NextGenTemplates catalogue of 150+ published dashboards and selected the eight whose calculated fields map most directly onto the 15 ecommerce KPIs below — AOV, conversion rate, revenue, margin, order status and channel sales. We prioritised paid, sellable templates that already contain the formulas (so you paste in data and read the answer), covered Excel, Google Sheets and Power BI so you can self-select your tool, and excluded loosely related sales templates that do not break results down by ecommerce channel. Prices shown are the current store prices in USD.
The 15 ecommerce KPIs to track in 2026
Every metric below follows the same four-part structure: a one-sentence definition, the exact formula, a realistic benchmark range, and the mistake most teams make. Start with the summary table, then read the detail for the three or four KPIs you are weakest on.
| # | Metric | Formula | Benchmark range | Where to see it |
|---|---|---|---|---|
| 1 | Average Order Value (AOV) | Total Revenue ÷ Number of Orders | $60–$120 | E-commerce KPI Dashboard |
| 2 | Customer Acquisition Cost (CAC) | Sales & Marketing Spend ÷ New Customers | $25–$65 (DTC) | Sales Dashboard |
| 3 | Customer Lifetime Value (LTV) | AOV × Purchase Frequency × Gross Margin % × Lifespan | ≥ 3× CAC | E-commerce KPI Dashboard |
| 4 | LTV:CAC Ratio | LTV ÷ CAC | 3:1 (healthy) | E-commerce KPI Dashboard |
| 5 | Conversion Rate (CVR) | (Orders ÷ Sessions) × 100 | 1.5%–3% | Shopify Store Dashboard |
| 6 | Cart Abandonment Rate | (1 − Purchases ÷ Carts) × 100 | ~70% | Shopify Store Dashboard |
| 7 | Gross Profit Margin | ((Revenue − COGS) ÷ Revenue) × 100 | 30%–50% | Sales Dashboard |
| 8 | Repeat Purchase Rate | (Customers with 2+ orders ÷ Total customers) × 100 | 20%–40% | E-commerce KPI Dashboard |
| 9 | Customer Retention Rate | ((End − New) ÷ Start) × 100 | 30%–50% | E-commerce KPI Dashboard |
| 10 | Churn Rate | (Customers lost ÷ Customers at start) × 100 | <5%/month | E-commerce KPI Dashboard |
| 11 | Return on Ad Spend (ROAS) | Revenue from Ads ÷ Ad Spend | 4:1 (400%) | Sales Dashboard |
| 12 | Return / Refund Rate | (Returned Orders ÷ Total Orders) × 100 | 5%–10% (20%+ apparel) | Online Marketplaces Dashboard |
| 13 | Revenue per Visitor (RPV) | Total Revenue ÷ Total Visitors | $1–$4 | Shopify Store Dashboard |
| 14 | Purchase Frequency | Total Orders ÷ Unique Customers | 1.2–2.5 / year | E-commerce KPI Dashboard |
| 15 | Order Fulfillment Cycle Time | Avg time from order placed to delivered | 2–5 days (domestic) | Order Fulfillment Web App |
1. Average Order Value (AOV)
Definition: the average amount a customer spends per order. Formula: Total Revenue ÷ Number of Orders. Benchmark: $60–$120 for most retail stores, though category swings this widely. The mistake teams make: chasing a higher AOV with blanket discounts and bundles that lift the headline number while cutting gross margin per order. Always read AOV next to margin, and segment it by channel — paid social buyers often have a very different AOV from email buyers.
2. Customer Acquisition Cost (CAC)
Definition: what it costs to win one new customer. Formula: total Sales & Marketing Spend ÷ New Customers Acquired. Benchmark: only meaningful against LTV, but $25–$65 is common for direct-to-consumer brands. The mistake teams make: counting only ad spend. True CAC includes agency fees, creative, software, discounts and the salaries of the people running acquisition — leave those out and you will happily scale an unprofitable channel.
3. Customer Lifetime Value (LTV)
Definition: the total gross profit a customer generates across their whole relationship with you. Formula: AOV × Purchase Frequency × Gross Margin % × Average Customer Lifespan. Benchmark: there is no universal number — the target is LTV ≥ 3× CAC. The mistake teams make: using revenue-based LTV instead of margin-based LTV, which inflates the figure and hides the fact that acquisition is under water.
4. LTV:CAC Ratio
Definition: how many dollars of lifetime value each acquisition dollar buys. Formula: LTV ÷ CAC. Benchmark: 3:1 is healthy, below 1:1 is unprofitable, and above 5:1 often means you are under-investing in growth. The mistake teams make: reading the ratio without a payback-period check — a 4:1 ratio that takes 14 months to recover CAC can still starve your cash flow.
5. Conversion Rate (CVR)
Definition: the share of visits that end in a purchase. Formula: (Orders ÷ Sessions) × 100. Benchmark: 1.5%–3% is typical; 3%+ is strong. The mistake teams make: reporting one blended conversion rate. Mobile and desktop, and paid and organic, convert very differently — a healthy desktop number can mask a broken mobile checkout that is losing you most of your traffic.
6. Cart Abandonment Rate
Definition: the share of shoppers who add to cart but never buy. Formula: (1 − Completed Purchases ÷ Carts Created) × 100. Benchmark: the documented average is around 70% (Baymard Institute). The mistake teams make: treating abandonment as lost forever. Most of it is recoverable with abandoned-cart emails, guest checkout and transparent shipping costs shown before the final step.
7. Gross Profit Margin
Definition: the percentage of revenue left after the cost of the goods sold. Formula: ((Revenue − COGS) ÷ Revenue) × 100. Benchmark: 30%–50% for retail ecommerce. The mistake teams make: leaving shipping, payment-processing fees and returns out of COGS, which flatters margin and leads to underpriced products that lose money at scale.
8. Repeat Purchase Rate
Definition: the share of customers who buy more than once. Formula: (Customers with 2+ orders ÷ Total customers) × 100. Benchmark: 20%–40%. The mistake teams make: measuring it over a window shorter than the natural buying cycle — if your product is repurchased every four months, a 30-day window will always look terrible.
9. Customer Retention Rate
Definition: the percentage of existing customers you keep over a period. Formula: ((Customers at end − New customers) ÷ Customers at start) × 100. Benchmark: 30%–50% depending on category. The mistake teams make: confusing retention with repeat purchase rate. Retention is about not losing the customers you already had; repeat rate is about how many buy again.
10. Churn Rate
Definition: the rate at which customers stop buying. Formula: (Customers lost ÷ Customers at start) × 100. Benchmark: under 5% per month is strong for subscription ecommerce. The mistake teams make: failing to define “churned” for a non-subscription store — decide the inactivity window (say, 90 or 180 days) up front, or the number is meaningless.
11. Return on Ad Spend (ROAS)
Definition: revenue generated per dollar of advertising. Formula: Revenue from Ads ÷ Ad Spend. Benchmark: 4:1 (400%) is a common target, but your break-even ROAS is set by your gross margin. The mistake teams make: optimising last-click ROAS inside the ad platform while blended ROAS and true CAC quietly deteriorate.
12. Return / Refund Rate
Definition: the share of orders that come back. Formula: (Returned Orders ÷ Total Orders) × 100. Benchmark: 5%–10% for most stores, 20%–30% for apparel and footwear. The mistake teams make: tracking one store-wide number instead of breaking returns down by product, size and channel, which is where the fixable causes actually live.
13. Revenue per Visitor (RPV)
Definition: the average revenue each visitor generates, combining conversion and AOV. Formula: Total Revenue ÷ Total Visitors. Benchmark: $1–$4 for many stores. The mistake teams make: celebrating traffic growth while RPV falls — more low-intent visitors can raise sessions and lower the value of the average visit at the same time.
14. Purchase Frequency
Definition: how often the average customer buys in a period. Formula: Total Orders ÷ Unique Customers. Benchmark: 1.2–2.5 per year for many stores. The mistake teams make: calculating purchase frequency and LTV over mismatched time windows, which makes the LTV figure wrong without anyone noticing.
15. Order Fulfillment Cycle Time
Definition: the average elapsed time from an order being placed to it being delivered. Formula: average of (Delivery date − Order date) across orders. Benchmark: 2–5 days for domestic ecommerce. The mistake teams make: measuring only warehouse ship time and ignoring the carrier leg — customers experience the full order-to-door time, and that is what drives repeat purchase and reviews.
Stop calculating these by hand. The E-commerce KPI Dashboard in Excel ships with the formulas for AOV, conversion, margin and repeat rate already built — paste your monthly numbers and read the answers. $14.99, one-time. Get the dashboard →
The 8 ready-made dashboards that already calculate these KPIs
Below, each template is mapped to the ecommerce KPIs it computes, with its real price and a direct link. #1 is our best overall because it is the fastest way to see the core profit metrics on one page.
1. E-commerce KPI Dashboard in Excel — best overall
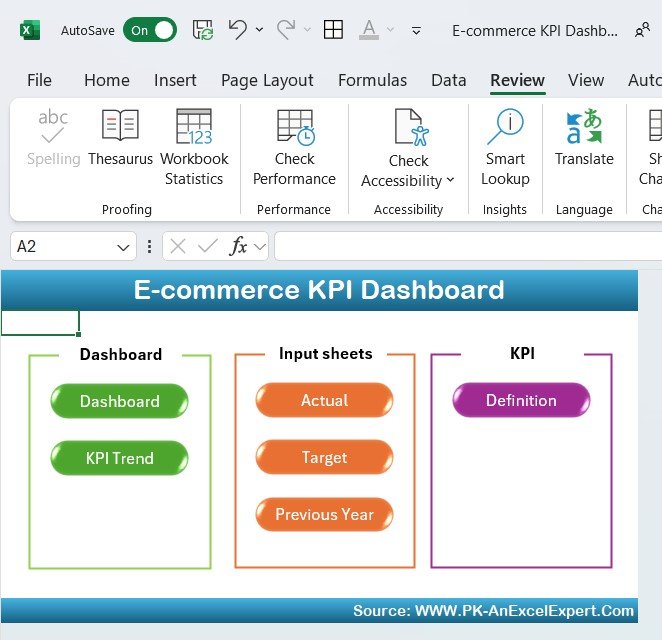
What it is: a single-page Excel dashboard that turns raw order and traffic data into the core ecommerce KPIs. Who it is for: store owners and analysts who live in Excel and want answers without building formulas.
- Calculates AOV, conversion rate, revenue and gross margin automatically
- Repeat purchase and retention views built in
- Input sheets separated from the dashboard so data entry is clean
- Works offline — no subscription, no connectors
Use it to run a monthly KPI review, to spot a channel where AOV is high but margin is thin, or to prove to a partner that repeat rate is climbing. Price: $14.99. View the E-commerce KPI Dashboard in Excel.
Best for: the fastest one-page view of your core ecommerce KPIs.
2. E-commerce KPI Dashboard in Power BI — best value
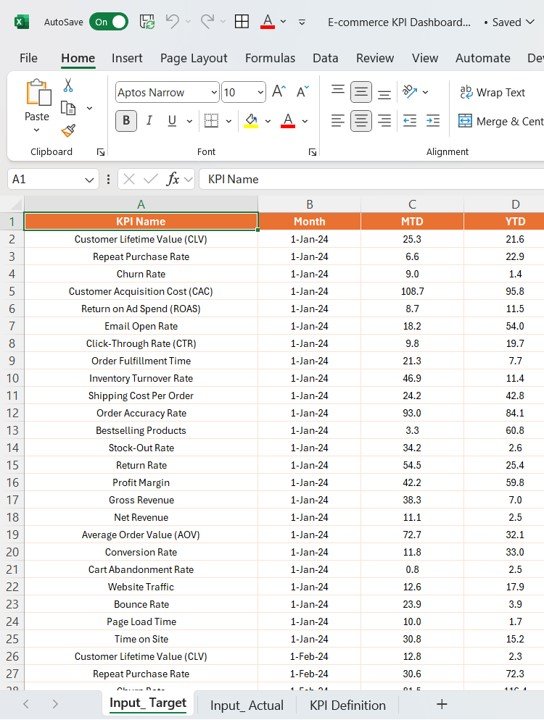
What it is: the same KPI logic as #1, rebuilt in Power BI so every chart is filterable. Who it is for: teams that want to slice KPIs by month, channel or product without editing formulas.
- Interactive AOV, conversion, ROAS and revenue visuals
- Drill from a whole-store view down to a single product line
- Refreshable — point it at an updated export and the report redraws
At $11.99 it is the cheapest way to get a full interactive KPI report, which is why it is our best value pick. View the E-commerce KPI Dashboard in Power BI.
Best for: interactive, filterable KPI reporting on a budget.
3. E-commerce Order Fulfillment Tracking System Web App
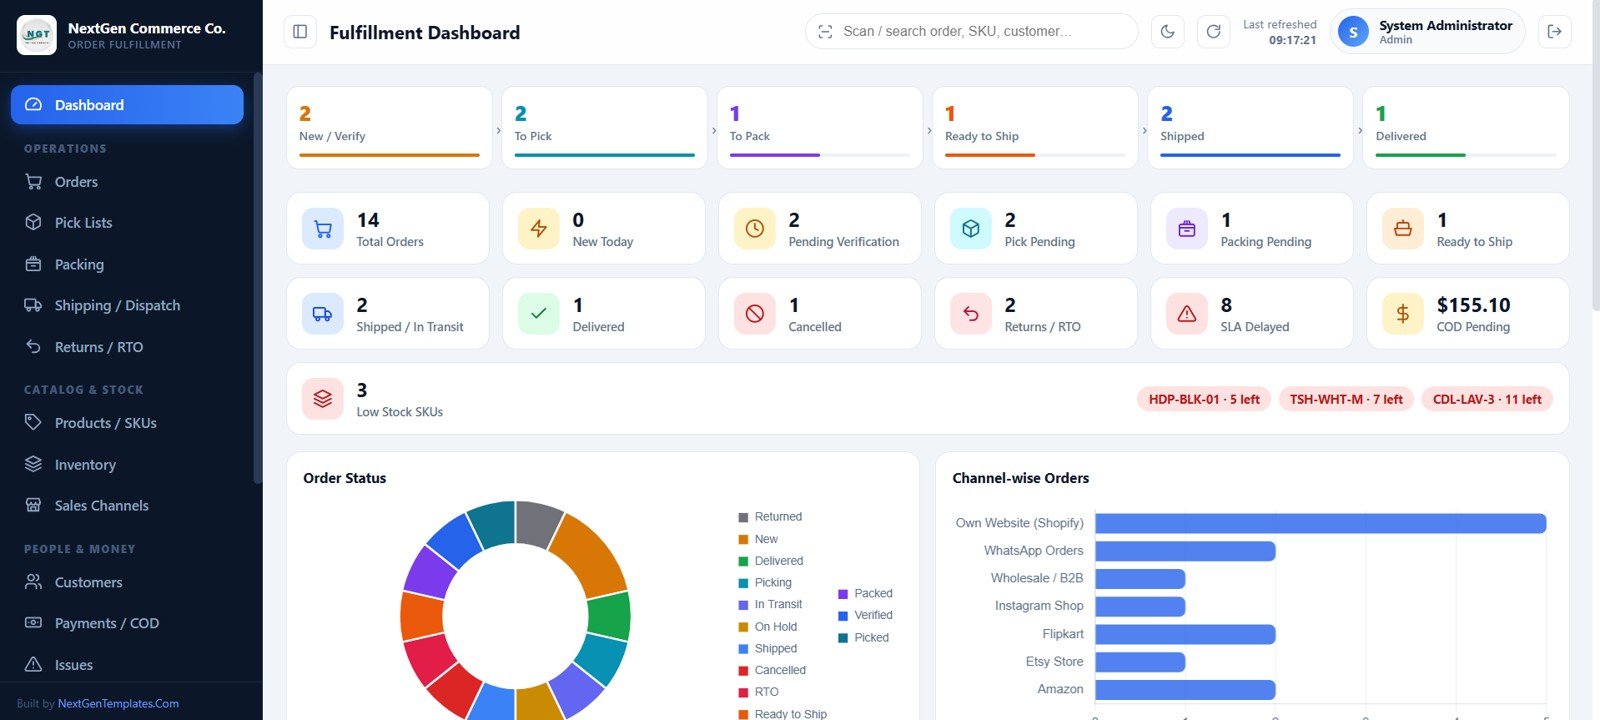
What it is: a Google Sheets–powered web app for logging and tracking orders through every fulfillment stage. Who it is for: stores that need to measure and cut order fulfillment cycle time (KPI #15).
- Records order status from placed to delivered
- Surfaces partially fulfilled and delayed orders
- Multi-user web front end — no spreadsheet skills needed for staff
This is the most complete tool in the list and the natural home for fulfillment-cycle and order-status KPIs. Price: $39.99. View the Order Fulfillment web app.
Best for: operations teams tracking fulfillment speed and order status.
4. Shopify Store Dashboard in Excel
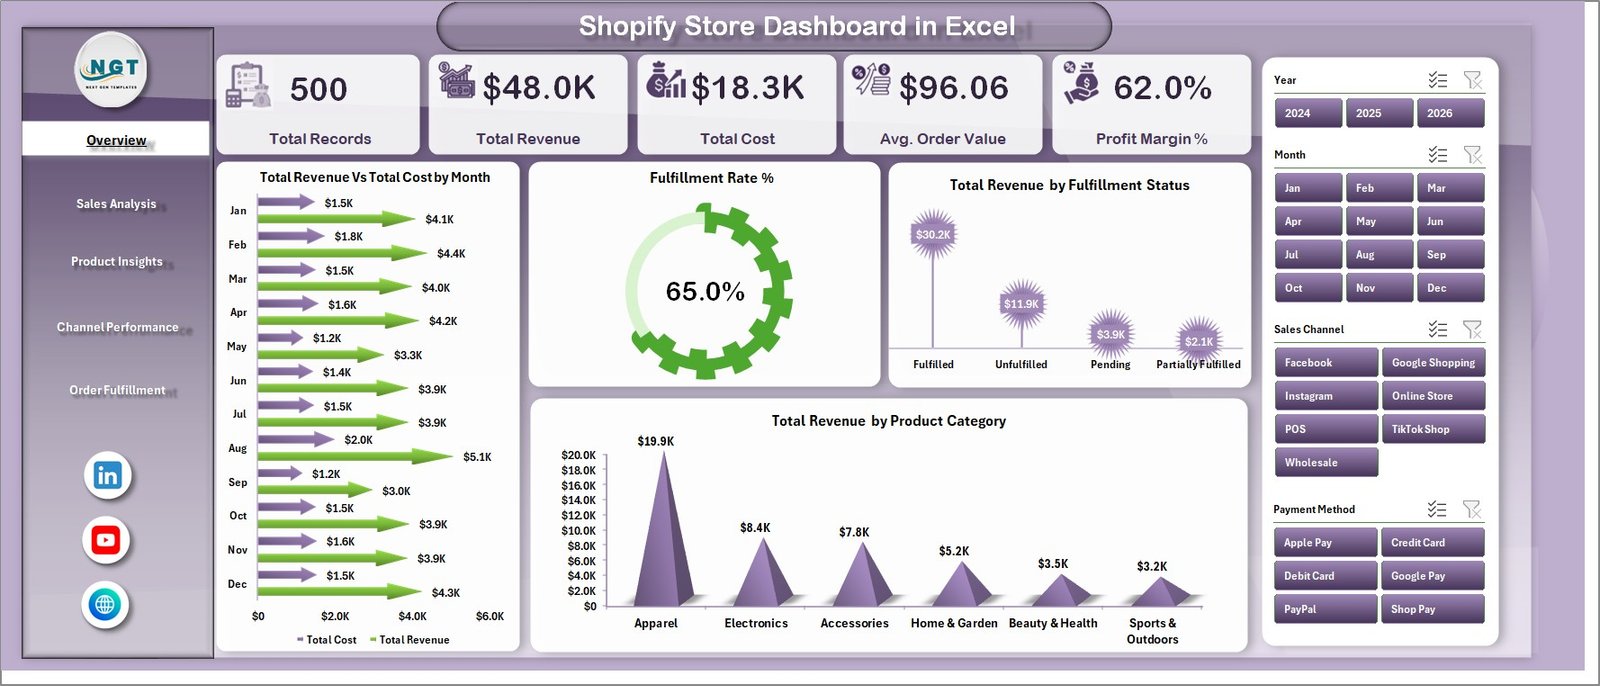
What it is: a purpose-built Excel dashboard for Shopify sellers who export their data. Who it is for: Shopify merchants who want KPIs their admin does not surface cleanly.
- Tracks conversion rate, AOV, RPV and revenue trends
- Product- and month-level breakdowns
- Drop your Shopify export in and refresh
Price: $17.99. View the Shopify Store Dashboard in Excel.
Best for: Shopify sellers who work in spreadsheets.
5. Shopify Store Dashboard in Power BI
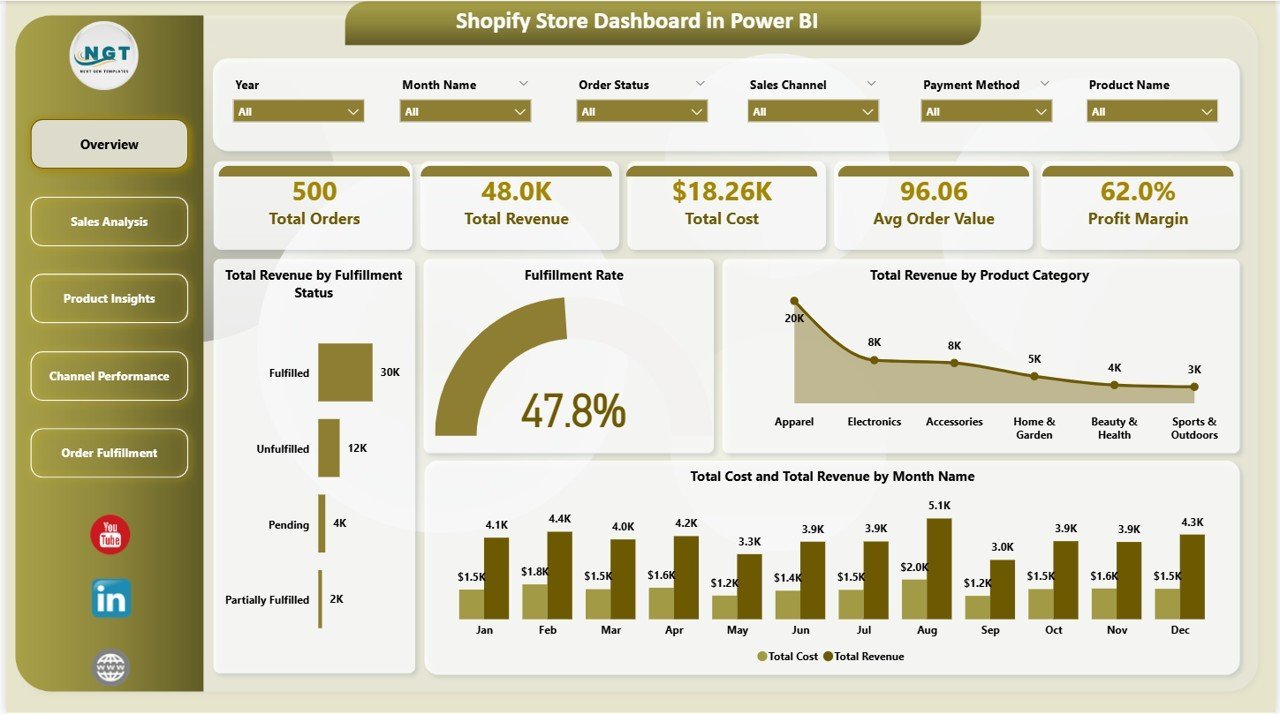
What it is: the Shopify dashboard as an interactive Power BI report. Who it is for: Shopify sellers who prefer live visuals to spreadsheet grids.
- Filterable conversion, AOV and revenue-per-visitor visuals
- Time-series trends for every core KPI
- Refresh from an updated export in seconds
Price: $17.99. View the Shopify Store Dashboard in Power BI.
Best for: Shopify sellers who want interactive dashboards.
6. Sales Dashboard For Online Store in Excel
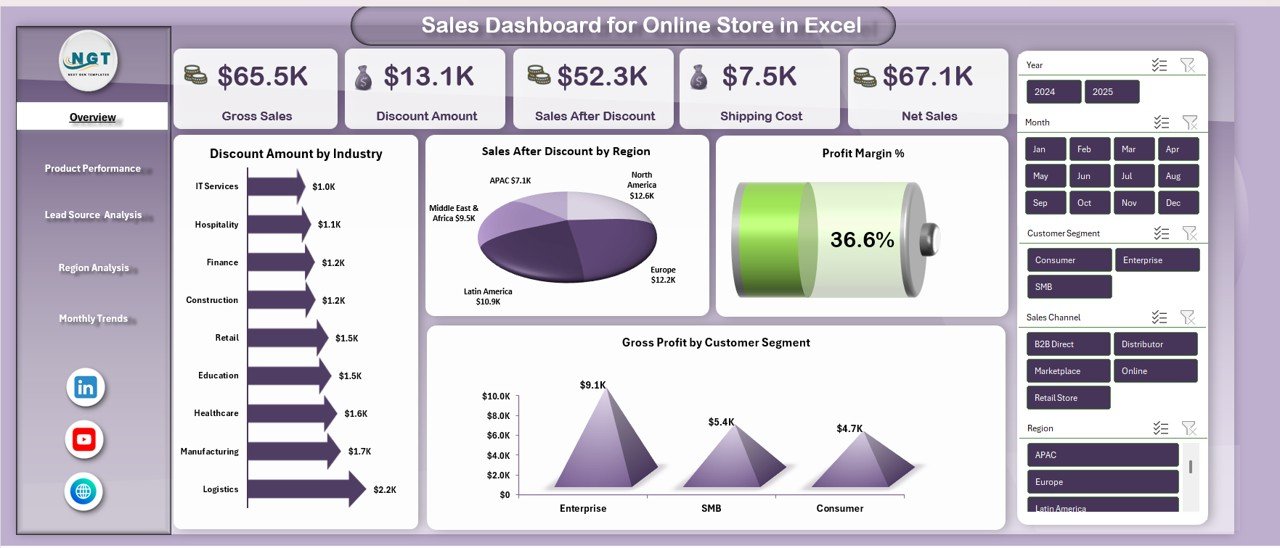
What it is: a focused sales-and-revenue dashboard for any online store. Who it is for: owners who want gross margin, ROAS and product-wise sales in one place.
- Revenue, gross margin and cost tracking
- Product-wise and monthly sales breakdowns
- Clean summary for a weekly sales stand-up
Price: $17.99. View the Sales Dashboard For Online Store.
Best for: revenue, margin and product-wise sales tracking.
7. Online Marketplaces KPI Dashboard in Excel
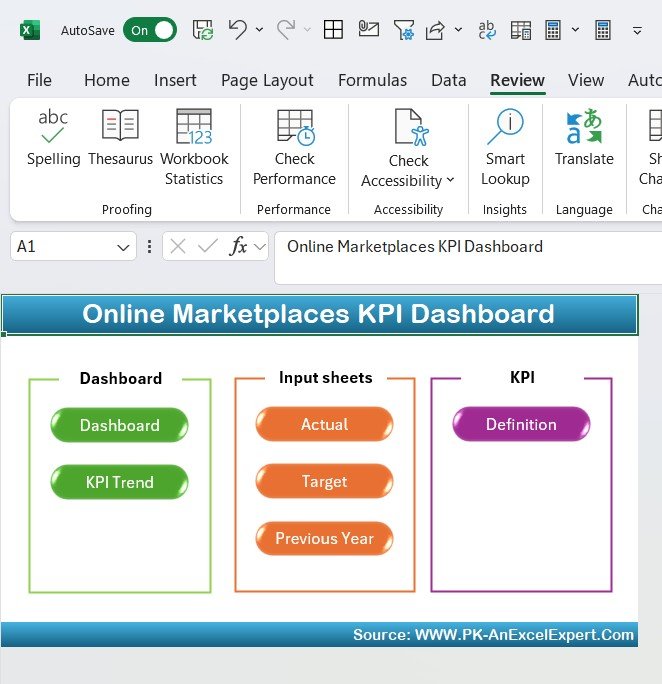
What it is: a KPI dashboard built for sellers operating across Amazon, eBay, Etsy and similar marketplaces. Who it is for: multi-channel sellers who need to compare performance and return rates by marketplace.
- Channel-by-channel revenue and order views
- Return / refund rate by marketplace
- Consolidated KPI summary across platforms
Price: $14.99. View the Online Marketplaces KPI Dashboard.
Best for: multi-marketplace sellers comparing channels.
8. Online Order Tracker Data Entry System in Excel
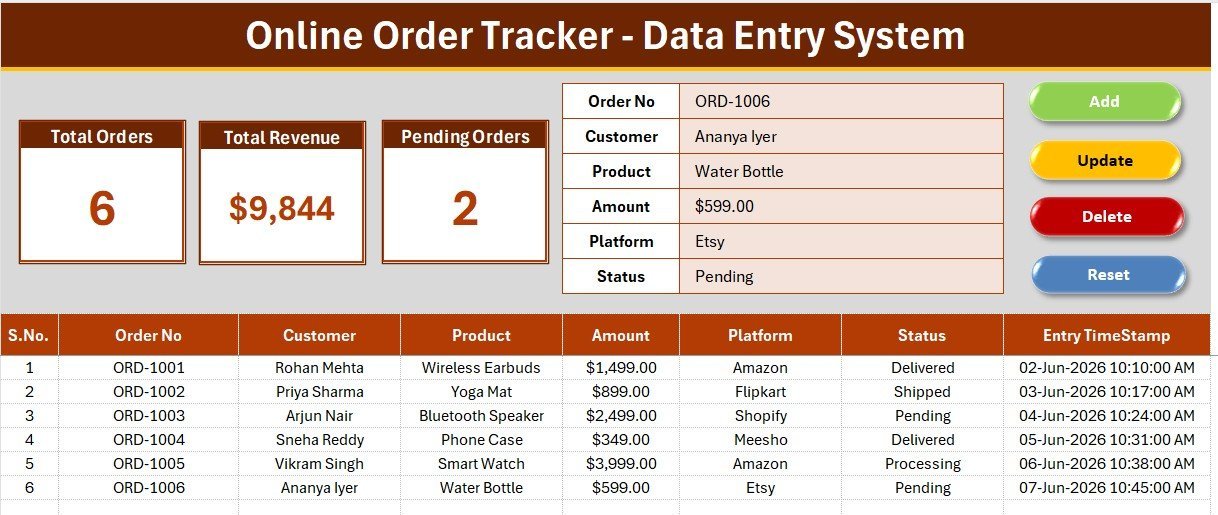
What it is: a lightweight Excel data-entry system for logging and tracking online orders. Who it is for: small or new stores that need clean order data before they build KPI dashboards.
- Add, update and track orders with a simple form
- Order status and basic fulfillment tracking
- The cheapest way to start collecting the data these KPIs need
At $5.99 it is the lowest-cost entry point in the list — get your order data clean here, then graduate to a full KPI dashboard. View the Online Order Tracker.
Best for: the cheapest start to structured order tracking.
How to choose between them
| If you… | Choose | Price |
|---|---|---|
| Want one page of core profit KPIs in Excel | E-commerce KPI Dashboard in Excel | $14.99 |
| Want interactive, filterable KPIs cheaply | E-commerce KPI Dashboard in Power BI | $11.99 |
| Need to track fulfillment speed & order status | Order Fulfillment Web App | $39.99 |
| Sell on Shopify | Shopify Store Dashboard (Excel or Power BI) | $17.99 |
| Sell across Amazon / eBay / Etsy | Online Marketplaces KPI Dashboard | $14.99 |
| Are just starting and need clean order data | Online Order Tracker | $5.99 |
The quick rule: buy the E-commerce KPI Dashboard in Excel if you want profit KPIs today, add the Order Fulfillment web app when operations become the bottleneck, and pick the Shopify Power BI dashboard if your data already lives in Shopify.
When a template is NOT the right answer
A spreadsheet KPI dashboard is the right tool for most stores up to a few thousand orders a month. It is not the right answer when you need real-time metrics that update every minute — a manual export cannot do that, and you should connect a BI tool directly to your store database or use your platform’s native analytics. It is also the wrong choice if you have millions of order rows (Excel will struggle past ~1 million), or if multiple staff need to edit live at once without version conflicts — that is where the web-app format or a proper database earns its keep. Finally, if you cannot yet export clean order and traffic data, no dashboard will save you; fix data collection first with a simple order tracker.
Frequently asked questions
What are the most important ecommerce KPIs?
The most important ecommerce KPIs are the profit-side ones: Customer Acquisition Cost, Customer Lifetime Value and the LTV:CAC ratio, plus conversion rate, Average Order Value and gross margin. Together they tell you whether you can acquire customers profitably and grow — traffic and follower counts cannot.
How do you calculate AOV, CAC and LTV?
AOV is Total Revenue ÷ Number of Orders. CAC is total Sales & Marketing Spend ÷ New Customers Acquired. LTV is AOV × Purchase Frequency × Gross Margin % × Average Customer Lifespan. Keep LTV margin-based, not revenue-based, so it reflects real profit rather than headline sales.
What is a good LTV to CAC ratio for ecommerce?
A ratio of 3:1 is widely considered healthy — three dollars of lifetime value for every dollar spent acquiring the customer. Below 1:1 you lose money on each new customer. Above 5:1 usually signals you are under-investing in growth and could scale acquisition faster.
What is the average cart abandonment rate?
The documented average online cart abandonment rate is roughly 70%, per the Baymard Institute’s aggregation of dozens of studies. Most abandonment is recoverable through abandoned-cart emails, guest checkout, transparent shipping costs and reducing the number of checkout steps.
What is a good conversion rate for an online store?
A typical ecommerce conversion rate is 1.5%–3%, and anything above 3% is strong. Always split it by device and traffic source, because a healthy desktop number can hide a mobile checkout problem that is costing you the majority of your visitors.
Can I track ecommerce KPIs in Excel or Google Sheets?
Yes. For most stores up to a few thousand orders a month, an Excel or Google Sheets dashboard is ideal — you paste in exported data and the formulas calculate every KPI. The E-commerce KPI Dashboard in Excel does this for $14.99 with no subscription.
How often should I review my ecommerce KPIs?
Review core KPIs monthly for trend decisions, and watch conversion rate, ROAS and CAC weekly when you are actively spending on ads. Fulfillment cycle time and order status are worth checking daily during peak season, which is where an order fulfillment web app helps.
What is the difference between retention rate and repeat purchase rate?
Retention rate measures how many of your existing customers you keep over a period, calculated as ((Customers at end − New) ÷ Customers at start) × 100. Repeat purchase rate measures how many customers buy more than once. Retention is about not losing customers; repeat rate is about them buying again.
Which ecommerce KPI dashboard should I buy first?
Start with the E-commerce KPI Dashboard in Excel at $14.99 for the core profit metrics, or the Power BI version at $11.99 if you want interactivity. If your order data is still messy, buy the $5.99 Online Order Tracker first and clean the data before dashboarding it.
Do these KPIs apply to marketplace sellers on Amazon and Etsy?
Yes — AOV, conversion, return rate and margin all apply on marketplaces, though acquisition cost works differently because the platform owns much of the traffic. The Online Marketplaces KPI Dashboard breaks these metrics down channel by channel.
Related KPI guides
Building a full reporting stack? These sister guides cover the metrics next door to ecommerce: 15 Sales KPIs to track in 2026, 15 Finance KPIs to track in 2026, 12 Inventory KPIs to track in 2026, 10 Warehouse KPIs to track in 2026, 12 Customer Service KPIs to track in 2026 and 12 Social Media KPIs to track in 2026.
Get more ecommerce KPI templates
Ready to measure what matters? Grab the E-commerce KPI Dashboard in Excel for $14.99 and have AOV, conversion, margin and repeat rate on one page in minutes — or start at $5.99 with the Online Order Tracker. Every template is a one-time purchase, no subscription.
See them in action on our channel: YouTube.com/@NextGenTemplates.