


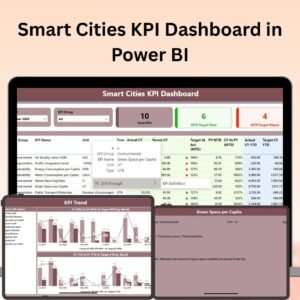
The Smart Cities KPI Dashboard in Power BI is a powerful tool designed to help city planners, government officials, and urban developers track and analyze key performance indicators (KPIs) to improve the effectiveness and sustainability of urban services. This interactive and visually appealing Power BI dashboard allows users to monitor critical metrics such as infrastructure performance, environmental impact, transportation efficiency, and public services, enabling data-driven decision-making for smarter cities.
This dashboard integrates multiple data sources to provide a comprehensive view of city performance, with features such as real-time data monitoring, customizable filters, and actionable insights. Whether you’re tracking energy consumption, traffic flow, waste management, or public health, this dashboard provides real-time visibility and helps optimize resource allocation for sustainable urban growth.

Key Features of the Smart Cities KPI Dashboard in Power BI:
🏙️ Comprehensive KPI Tracking
Track essential KPIs for smart cities, including traffic management, waste disposal, air quality, public safety, and energy consumption. Gain a clear understanding of how well city services are performing.
📈 Real-Time Data Monitoring
Monitor live data feeds and get real-time insights on various urban services, such as water supply, public transportation, and energy usage, to make timely decisions.
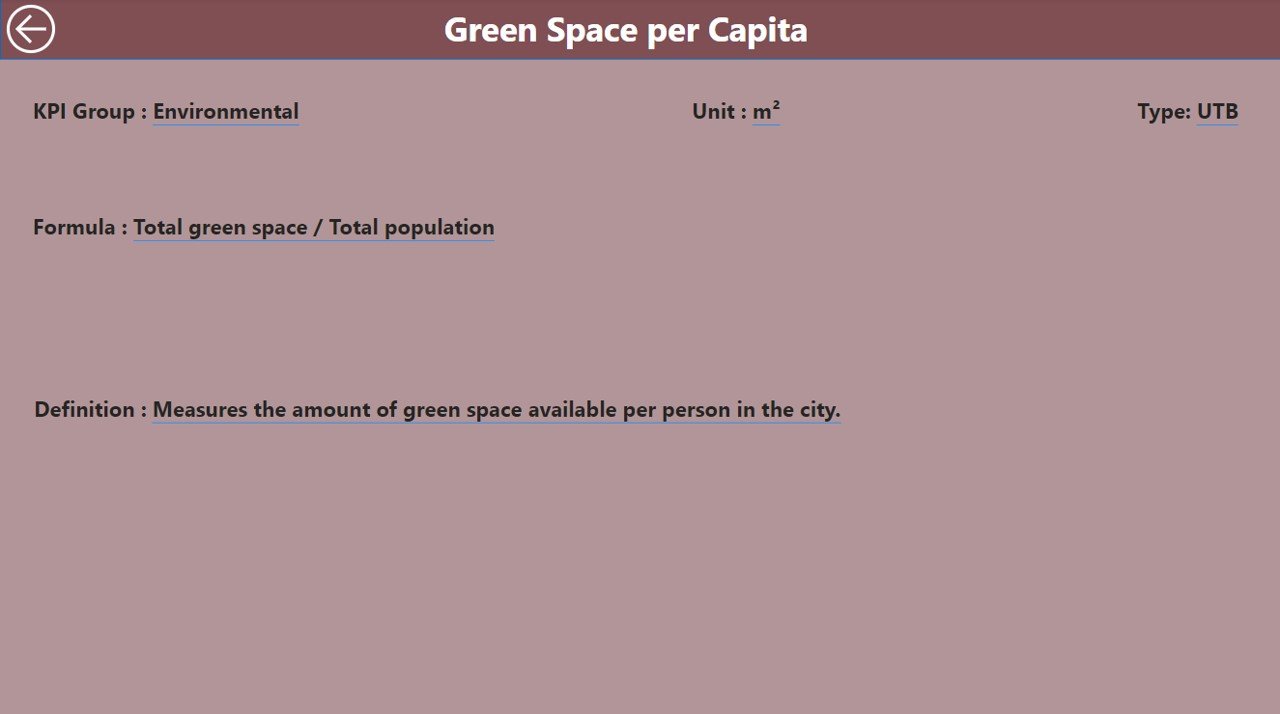
🌱 Sustainability Metrics
Measure the environmental impact of various city services, including carbon emissions, waste recycling rates, and energy usage, to promote sustainable urban development.
🚗 Traffic and Transportation Efficiency
Track traffic patterns, public transport usage, and congestion levels to improve the efficiency of transportation networks and reduce urban traffic-related issues.
🛠️ Infrastructure and Utilities Performance
Monitor the performance of key city infrastructure and utilities, including electricity, water, and waste management, to ensure that services are delivered efficiently.
📊 Interactive and Customizable Dashboards
With Power BI’s interactive and customizable capabilities, tailor the dashboard to your specific needs by filtering data, drilling down into detailed metrics, and visualizing trends over time.
🚀 Why You’ll Love the Smart Cities KPI Dashboard in Power BI:
✅ Data-Driven Urban Management – Make informed decisions by analyzing real-time data and KPIs to improve city operations and services.
✅ Enhance Sustainability Efforts – Track environmental KPIs and sustainability metrics to promote greener and more sustainable cities.
✅ Improve Infrastructure and Services – Monitor infrastructure performance to optimize services like water, electricity, and waste management for better urban living.
✅ Optimize Traffic and Transportation – Use traffic data and public transport KPIs to reduce congestion and improve transportation efficiency.
✅ Tailored Insights for Decision Makers – Provide clear and actionable insights to city planners, officials, and managers for strategic urban planning.
✅ Interactive and Easy to Use – The user-friendly Power BI interface allows you to interact with and customize the dashboard according to your city’s unique needs.
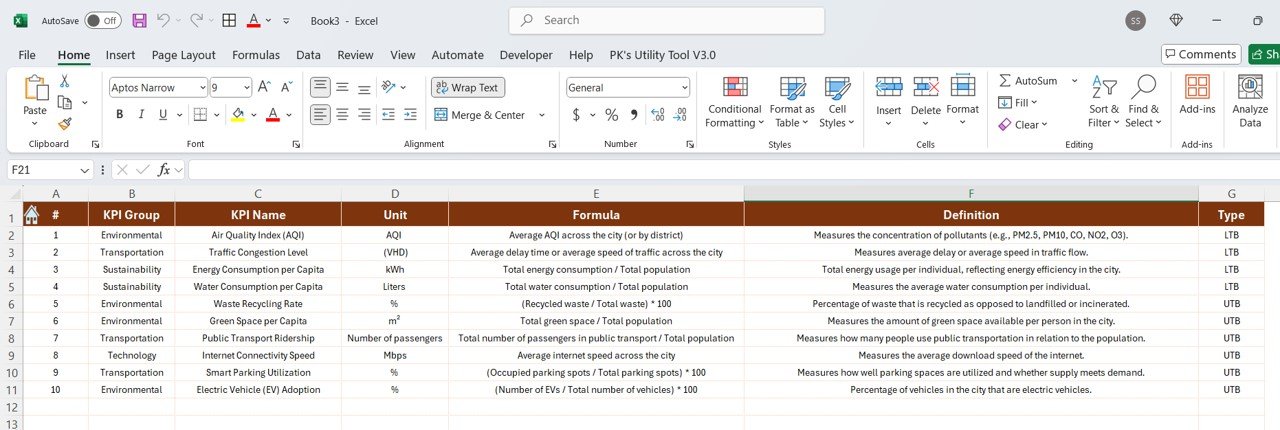
What’s Inside the Smart Cities KPI Dashboard in Power BI:
- Real-Time KPI Monitoring: Track KPIs such as energy consumption, traffic congestion, waste management, and public safety in real-time.
- Sustainability Metrics: Analyze environmental impact metrics like carbon footprint, recycling rates, and energy efficiency.
- Traffic and Transportation Data: Visualize traffic flow, public transport efficiency, and commuter patterns to optimize urban mobility.
- Infrastructure Monitoring: Keep track of essential city infrastructure services, including electricity, water, and waste disposal.
- Customizable Views: Tailor the dashboard to your city’s specific needs, filtering data and visualizing trends to make informed decisions.
- Interactive Reports: Generate detailed reports and presentations to share with stakeholders, city planners, or government officials.
How to Use the Smart Cities KPI Dashboard in Power BI:
1️⃣ Download the Template – Access your Power BI file instantly upon purchase.
2️⃣ Import Data – Import data from various city systems (e.g., traffic, utilities, public services) to populate the dashboard.
3️⃣ Track Real-Time KPIs – Monitor real-time data for key performance indicators related to smart city services.
4️⃣ Analyze and Filter – Use Power BI’s filtering capabilities to dive deeper into specific metrics and identify trends.
5️⃣ Generate Insights – Customize the dashboard and generate reports to share with stakeholders for better decision-making.
Who Can Benefit from the Smart Cities KPI Dashboard in Power BI:
- City Planners and Urban Developers
- Government Officials
- Public Infrastructure Managers
- Environmental and Sustainability Experts
- Traffic and Transportation Authorities
- Utility Providers (Water, Electricity, etc.)
- Data Analysts and Urban Researchers
The Smart Cities KPI Dashboard in Power BI is a must-have tool for anyone involved in the management or development of modern cities. It helps city officials and urban planners make informed decisions based on real-time data, ensuring better management of resources, improving the quality of life for residents, and supporting sustainable urban growth.
Click here to read the Detailed blog post
https://www.pk-anexcelexpert.com/smart-cities-kpi-dashboard-in-power-bi/
Visit our YouTube channel to learn step-by-step video tutorials
Youtube.com/@PKAnExcelExpert


Reviews
There are no reviews yet.