

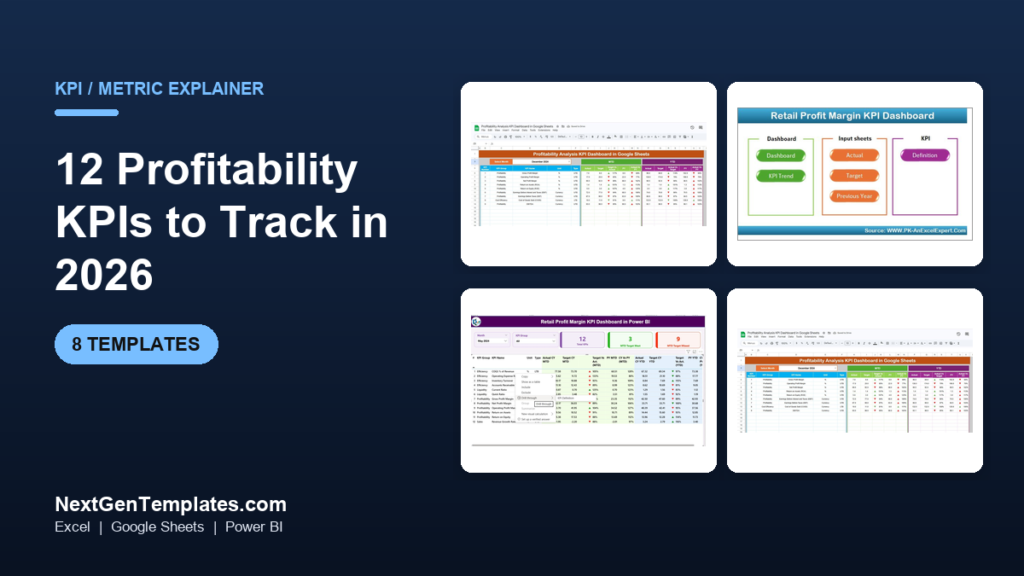
The profitability KPIs worth tracking in 2026 are gross, operating, net, EBITDA and contribution margin, plus ROA, ROE, ROIC, GMROI, break-even point, LTV:CAC and the operating expense ratio. Together they show whether each sale, product line and dollar of capital actually earns money.
Last updated: September 2026
Key takeaways
- Track profitability at three depths: margin (gross, operating, net), return on capital (ROA, ROE, ROIC) and unit economics (contribution margin, GMROI, LTV:CAC).
- A healthy net profit margin is roughly 10%+, but a 3% grocery business can still beat a 15% software business once you compare ROIC against cost of capital.
- The single most misread number is ROE: a high figure driven by debt hides risk, so always read it beside leverage.
- The healthy LTV:CAC ratio is 3:1 — below 1:1 you lose money on every customer you win.
- All 12 metrics are pre-built into the Profitability Analysis KPI Dashboard and seven sister templates, priced $9.99–$14.99.
Profitability KPI dashboard templates compared
| Template | Format | Best for | Price |
|---|---|---|---|
| Profitability Analysis KPI Dashboard (Best overall) | Google Sheets | Tracking margin, ROS and contribution across product lines | $12.99 |
| Retail Profit Margin KPI Dashboard | Google Sheets (Best value) | Store and e-commerce margin tracking on a budget | $9.99 |
| Retail Profit Margin KPI Dashboard | Excel | Offline margin analysis with full formula control | $14.99 |
| Retail Profit Margin KPI Dashboard | Power BI | Interactive margin drill-down for larger catalogues | $11.99 |
| Healthcare Cost Efficiency KPI Dashboard | Excel | Cost-to-serve and margin in clinics and providers | $14.99 |
| Logistics Cost Optimization KPI Dashboard | Power BI | Freight, warehousing and cost-per-order margin | $11.99 |
| Nonprofit Organizations KPI Dashboard | Excel | Program efficiency and surplus tracking | $14.99 |
| Educational Nonprofits KPI Dashboard | Excel | Cost-per-student and funding efficiency | $14.99 |
How we picked these profitability KPIs and templates
We reviewed the full NextGenTemplates catalogue of 900+ spreadsheet and BI products and shortlisted the eight dashboards that already calculate the profitability KPIs in this guide out of the box, rather than generic trackers you have to wire up yourself. The 12 metrics were chosen because they appear in almost every finance textbook, lender scorecard and board pack, and because each has a formula precise enough to reproduce in a single cell.
We excluded pure liquidity and growth metrics (current ratio, revenue growth) — they matter, but they are not profitability KPIs. We also excluded free templates: a profitability dashboard that no one maintains is worse than none. Prices shown are the live store prices at the time of writing ($9.99–$14.99). For adjacent scorecards see our finance KPIs guide and sales KPIs guide.
The 12 profitability KPIs to track in 2026 (formulas + benchmarks)
Every metric below follows the same four-part pattern: a one-line definition, the exact formula, a realistic benchmark range, and the mistake teams most often make. Start with the metric table, then read the detail underneath.
| Metric | Formula | Benchmark range | Where to see it |
|---|---|---|---|
| 1. Gross Profit Margin | (Revenue − COGS) / Revenue | 20–40% goods; 60%+ software | Retail Profit Margin dashboard |
| 2. Operating Profit Margin | Operating Income (EBIT) / Revenue | 10–15% healthy | Profitability Analysis dashboard |
| 3. Net Profit Margin | Net Income / Revenue | 10%+ good; ~5% average | Profitability Analysis dashboard |
| 4. EBITDA Margin | EBITDA / Revenue | 15–25% mature firms | Profitability Analysis dashboard |
| 5. Contribution Margin | (Revenue − Variable Costs) / Revenue | 30–60% by model | Retail Profit Margin dashboard |
| 6. Return on Assets (ROA) | Net Income / Total Assets | 5%+ good; 20%+ excellent | Profitability Analysis dashboard |
| 7. Return on Equity (ROE) | Net Income / Shareholder Equity | 15–20% strong | Profitability Analysis dashboard |
| 8. Return on Invested Capital (ROIC) | NOPAT / Invested Capital | Above WACC (8–10%); 15%+ great | Profitability Analysis dashboard |
| 9. Gross Margin Return on Investment (GMROI) | Gross Margin $ / Avg Inventory Cost | 2.0–3.0+ retail | Retail Profit Margin dashboard |
| 10. Break-Even Point | Fixed Costs / Contribution Margin per unit | Sales 20%+ above it | Retail Profit Margin dashboard |
| 11. LTV:CAC Ratio | Customer Lifetime Value / CAC | 3:1 target | Profitability Analysis dashboard |
| 12. Operating Expense Ratio | Operating Expenses / Revenue | 60–80% common; watch trend | Logistics & Healthcare dashboards |
1. Gross Profit Margin
Definition: the share of revenue left after subtracting the direct cost of the goods or services you sold. Formula: (Revenue − COGS) / Revenue × 100. Benchmark: 20–40% for retail and manufacturing, 60%+ for software and digital products, 50%+ for many service firms. The mistake teams make: loading indirect overhead — rent, admin salaries, marketing — into COGS. That understates gross margin and hides whether your pricing actually works before overhead even enters the picture. Keep COGS to truly direct costs.
2. Operating Profit Margin
Definition: profit from your core operations before interest and tax, as a percentage of revenue. Formula: Operating Income (EBIT) / Revenue × 100. Benchmark: 10–15% is healthy across most industries; below 5% is thin and leaves little room for error. The mistake teams make: counting one-off gains such as an asset sale or an insurance payout as operating income, which flatters the margin and masks weak underlying operations. Operating margin should reflect the business you run every day, not lucky windfalls.
3. Net Profit Margin
Definition: the percentage of revenue that survives as profit after every expense, interest and tax. Formula: Net Income / Revenue × 100. Benchmark: 10%+ is good, around 5% is average, under 5% is low — but it varies enormously by sector. The mistake teams make: comparing net margin across industries with different capital structures. A 3% supermarket margin can create more value than a 15% software margin once you look at how fast capital turns over. Read net margin beside ROIC, never alone.
4. EBITDA Margin
Definition: earnings before interest, tax, depreciation and amortisation, as a share of revenue — a proxy for cash operating profitability. Formula: EBITDA / Revenue × 100. Benchmark: 15–25% is healthy for mature companies. The mistake teams make: treating EBITDA as if it were free cash flow. It deliberately ignores capital expenditure, working-capital swings and debt service — three things that can quietly consume every dollar of “EBITDA profit.” Use it to compare operating performance, not to judge whether cash is actually piling up.
5. Contribution Margin
Definition: the revenue left after variable costs, available to cover fixed costs and then profit. Formula: (Revenue − Variable Costs) / Revenue × 100, or per unit. Benchmark: 30–60% depending on the model; the heavier your fixed-cost base, the higher this must be to survive. The mistake teams make: misclassifying fixed costs as variable or the reverse. Get that wrong and your break-even point, pricing floors and product-mix decisions are all built on sand. Classify each cost once, carefully, and reuse it.
6. Return on Assets (ROA)
Definition: how much profit the business squeezes out of every dollar of assets it owns. Formula: Net Income / Total Assets × 100. Benchmark: 5%+ is good, 20%+ is excellent; asset-heavy industries such as manufacturing and logistics naturally run lower. The mistake teams make: comparing ROA between an asset-light agency and an asset-heavy factory as if the number meant the same thing. Always compare ROA within the same industry, or you will draw the wrong conclusion about efficiency.
7. Return on Equity (ROE)
Definition: the return generated on the money shareholders have invested. Formula: Net Income / Shareholder Equity × 100. Benchmark: 15–20% is strong for most sectors. The mistake teams make: celebrating a high ROE that is really produced by leverage. Piling on debt shrinks equity and inflates ROE while quietly raising risk. Always read ROE next to the debt-to-equity ratio; a DuPont breakdown shows whether the return comes from margin, asset turnover or borrowing.
8. Return on Invested Capital (ROIC)
Definition: the after-tax operating return on all capital — debt and equity — put to work in the business. Formula: NOPAT / Invested Capital × 100. Benchmark: it must beat your weighted average cost of capital (WACC, typically 8–10%); 15%+ is excellent. The mistake teams make: ignoring WACC entirely. An ROIC of 6% looks positive but actively destroys value if capital costs 9%. According to Investopedia’s ROIC definition, value is only created when ROIC exceeds the cost of capital.
9. Gross Margin Return on Investment (GMROI)
Definition: how many gross-margin dollars you earn for every dollar tied up in inventory. Formula: Gross Margin $ / Average Inventory Cost. Benchmark: above 1.0 means inventory earns more than it costs; retailers target 2.0–3.0 and higher. The mistake teams make: chasing high margin on slow-moving SKUs. GMROI rewards margin multiplied by turnover, so a 25% margin that sells six times a year beats a 45% margin that sells once. Manage the two together, not margin alone.
10. Break-Even Point
Definition: the sales volume at which total revenue exactly covers total costs — no profit, no loss. Formula: Fixed Costs / (Price per unit − Variable Cost per unit). Benchmark: there is no universal target; you want actual sales sitting comfortably above it, ideally with a 20%+ margin of safety. The mistake teams make: calculating break-even once and filing it away. It moves every time fixed costs, pricing or variable costs shift, so recompute it whenever you re-price or take on new overhead.
11. LTV:CAC Ratio
Definition: the lifetime gross-margin value of a customer divided by what it costs to acquire them. Formula: Customer Lifetime Value / Customer Acquisition Cost. Benchmark: 3:1 is the healthy target; below 1:1 you lose money on every customer, and above 5:1 you may be under-investing in growth. The mistake teams make: calculating LTV on revenue instead of gross margin, which massively overstates it. Always build LTV on margin, and see our marketing KPIs guide for the full acquisition picture.
12. Operating Expense Ratio
Definition: operating costs as a share of revenue — a direct read on cost discipline. Formula: Operating Expenses / Revenue × 100. Benchmark: 60–80% is common, but the trend matters more than the absolute number. The mistake teams make: hacking away at the OpEx that actually drives revenue — sales headcount, R&D, customer success — just to hit a ratio target this quarter. That improves the number today and damages profitability for years. Cut waste, not growth engines. Our procurement KPIs guide covers the cost side in depth.
Get every profitability KPI in one dashboard — from $9.99
You do not have to build these 12 formulas from scratch. The Profitability Analysis KPI Dashboard in Google Sheets ($12.99) already calculates margin, returns and unit economics with traffic-light targets. Prefer the lowest price? The Retail Profit Margin dashboard is just $9.99.
The 8 best profitability KPI dashboard templates for 2026
Each dashboard below already computes several of the 12 metrics above, so you enter your numbers and read the answer. They are ranked by how completely they cover profitability, then by value.
1. Profitability Analysis KPI Dashboard in Google Sheets — best overall
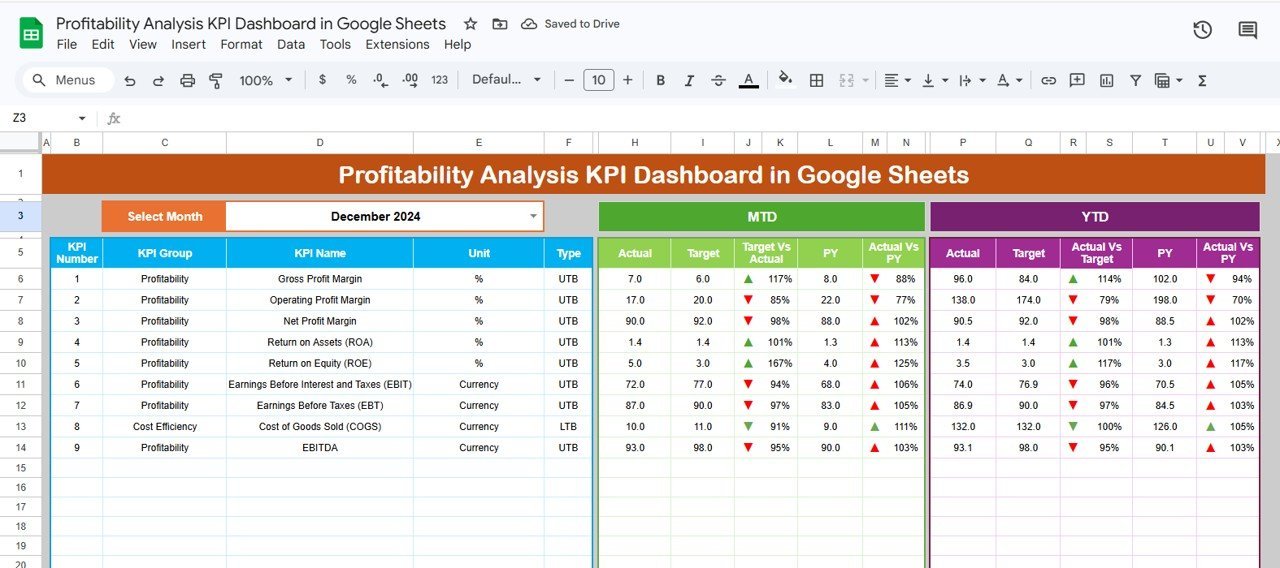
What it is: a purpose-built profitability scorecard that tracks margin, return-on-capital and contribution across product lines in one view. Who it is for: founders, finance leads and analysts who want the whole profitability picture without building it. #1 because it is the only template here designed specifically to calculate operating, net and EBITDA margin alongside ROA, ROE and contribution margin in a single, shareable file.
- MTD and YTD margin tracking with target vs actual
- Return-on-capital section (ROA, ROE, ROIC) with traffic lights
- Contribution margin by product line
- Cloud-native — share and collaborate instantly
Use it to spot a product line whose gross margin looks fine but whose contribution margin is quietly negative after variable costs, or to prove ROIC beats your cost of capital before a funding round. Price: $12.99. Get the Profitability Analysis dashboard. Best for: anyone who wants all 12 profitability KPIs in one place.
2. Retail Profit Margin KPI Dashboard in Google Sheets — best value

What it is: a focused margin tracker for stores and e-commerce, covering gross margin, contribution margin, GMROI and break-even. Who it is for: retailers and online sellers who want margin discipline at the lowest price. At $9.99 it is the cheapest way to get real profitability KPIs into your week.
- Gross and contribution margin by SKU or category
- GMROI to balance margin against inventory turnover
- Break-even calculator built in
- Runs free in any browser
Price: $9.99. Get the Retail Profit Margin Google Sheets dashboard. Best for: budget-conscious retail and e-commerce margin tracking.
3. Retail Profit Margin KPI Dashboard in Excel
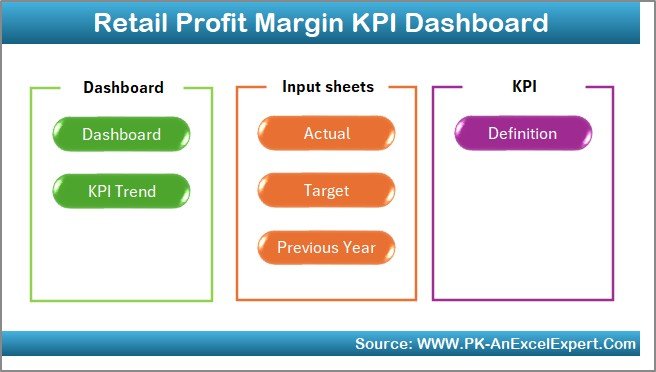
What it is: the same retail margin engine in a fully offline Excel workbook, with every formula visible and editable. Who it is for: finance teams that live in Excel and want total control over the calculations. Ideal when you must customise the margin logic or work without a network.
- Editable formulas for gross, contribution and net margin
- GMROI and break-even worked examples
- Print-ready monthly margin report
Price: $14.99. Get the Retail Profit Margin Excel dashboard. Best for: offline, formula-level margin analysis.
4. Retail Profit Margin KPI Dashboard in Power BI
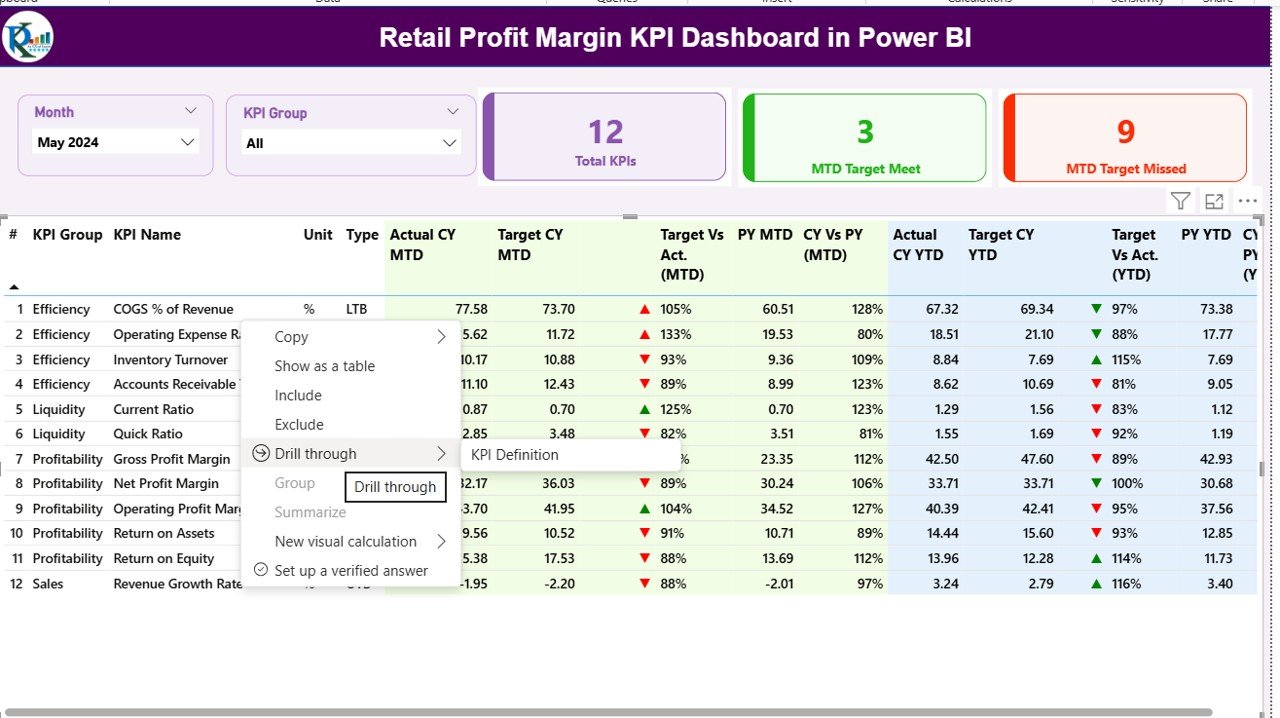
What it is: an interactive Power BI version with slicers for drilling into margin by store, category and period. Who it is for: larger retailers with big catalogues who need to filter and drill rather than scroll. Best for: visual, interactive margin drill-down across many products.
- Slice margin by store, category, month
- DAX measures for gross, contribution and net margin
- Refreshable from your data source
Price: $11.99. Get the Retail Profit Margin Power BI dashboard.
5. Healthcare Cost Efficiency KPI Dashboard in Excel
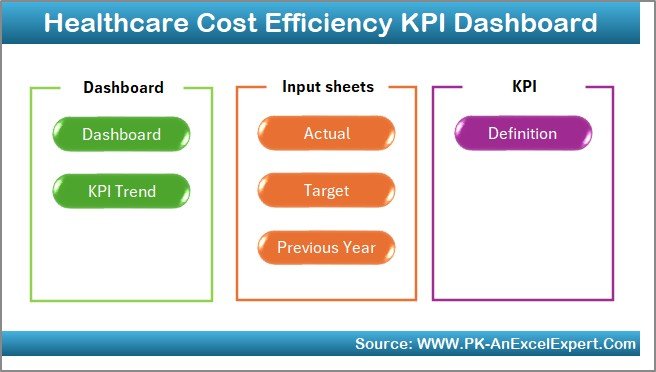
What it is: a cost-to-serve and margin dashboard tuned for clinics, practices and providers. Who it is for: healthcare operators who track profitability as cost efficiency and operating-expense ratio rather than retail margin. Best for: margin and cost control in healthcare settings.
- Cost-per-case and cost-per-patient tracking
- Operating expense ratio by department
- Surplus/margin trend charts
Price: $14.99. Get the Healthcare Cost Efficiency dashboard.
6. Logistics Cost Optimization KPI Dashboard in Power BI
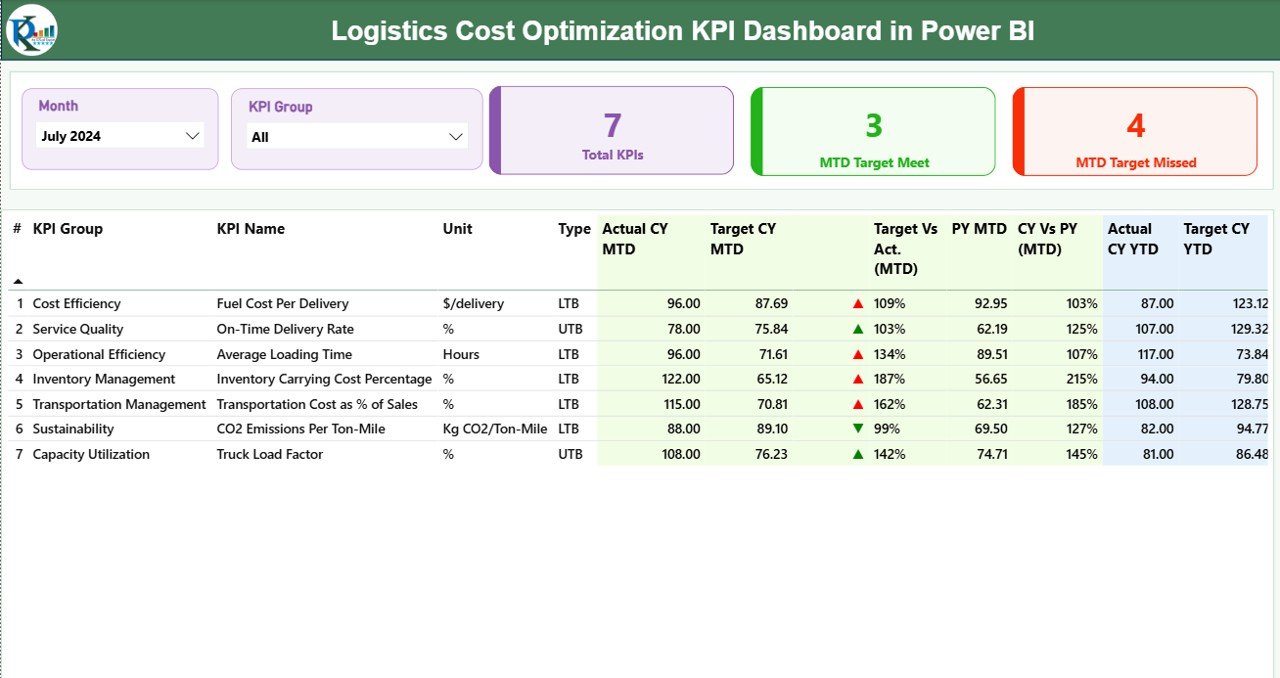
What it is: a Power BI dashboard for freight, warehousing and cost-per-order profitability. Who it is for: operations and supply-chain leaders who protect margin by controlling logistics cost. Best for: cost-per-order and operating expense ratio in logistics.
- Cost-per-order and cost-per-mile tracking
- Operating expense ratio by lane
- Interactive slicers by carrier and route
Price: $11.99. Get the Logistics Cost Optimization dashboard. Pair it with our warehouse KPIs guide.
7. Nonprofit Organizations KPI Dashboard in Excel
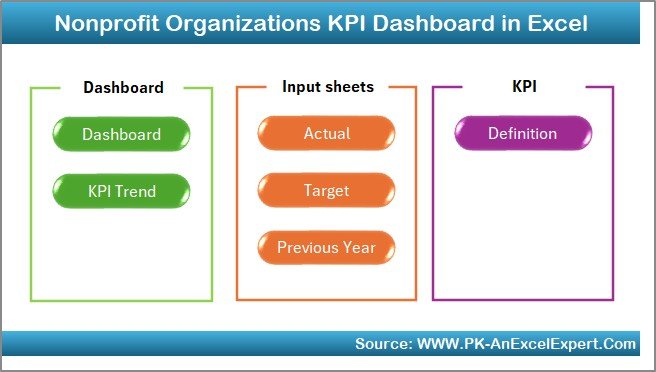
What it is: a program-efficiency and surplus dashboard for mission-driven organisations. Who it is for: nonprofit finance teams that track operating surplus and program ratios instead of shareholder return. Best for: program efficiency and surplus tracking.
- Program vs overhead expense ratio
- Operating surplus/deficit trend
- Funding-source efficiency
Price: $14.99. Get the Nonprofit Organizations dashboard.
8. Educational Nonprofits KPI Dashboard in Excel
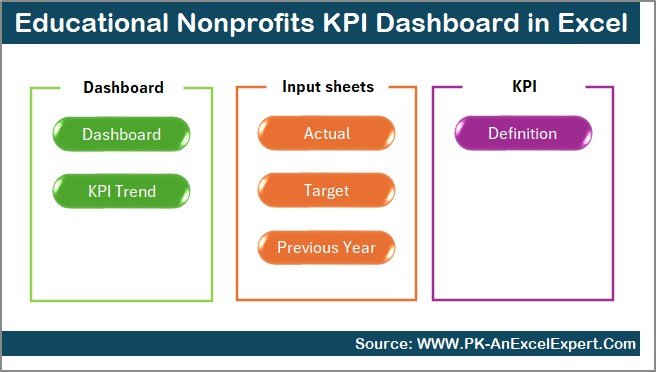
What it is: a cost-per-student and funding-efficiency dashboard for schools and education nonprofits. Who it is for: education administrators measuring financial sustainability. Best for: cost-per-student and funding efficiency.
- Cost-per-student and cost-per-program
- Funding vs expenditure ratio
- Surplus and reserve tracking
Price: $14.99. Get the Educational Nonprofits dashboard.
How to choose between them
| If you… | Choose | Format |
|---|---|---|
| Want all 12 profitability KPIs in one file | Profitability Analysis KPI Dashboard | Google Sheets |
| Run a store or online shop on a budget | Retail Profit Margin ($9.99) | Google Sheets |
| Need to edit every formula offline | Retail Profit Margin | Excel |
| Have a big catalogue to slice and drill | Retail Profit Margin | Power BI |
| Manage a clinic or provider | Healthcare Cost Efficiency | Excel |
| Optimise freight and warehousing cost | Logistics Cost Optimization | Power BI |
| Run a nonprofit or school | Nonprofit / Educational Nonprofits | Excel |
Rule of thumb: pick the format your team already opens daily. A dashboard people never open tracks nothing. For a broader menu see our payroll KPIs guide and recruitment KPIs guide.
When a profitability dashboard is NOT the right answer
Templates are the right tool for tracking and reporting profitability KPIs, but they are not always the answer. Skip a spreadsheet dashboard and buy dedicated software when:
- Your data lives in many systems. If revenue, cost and inventory sit in an ERP, a POS and a CRM that never talk to each other, a connected BI platform or accounting suite will save more than it costs.
- You need real-time, audited numbers. Manual entry introduces lag and error; regulated finance functions need a system of record, not a monthly copy-paste.
- Dozens of people edit at once. Beyond a small team, a spreadsheet becomes a version-control problem. A database-backed tool is safer.
- You have no clean cost data yet. No dashboard fixes missing or wrong COGS. Fix the bookkeeping first, then track the KPIs.
For a small or mid-size team with clean numbers, though, a $9.99–$14.99 dashboard delivers 90% of the value at a fraction of software cost.
For charities, profitability becomes fundraising efficiency — cost to raise a dollar and pledge fulfillment. Our ranked guide to the best nonprofit dashboard templates covers eight Excel, Google Sheets, Power BI and HTML options built for that.
Frequently asked questions
What are the most important profitability KPIs?
The core profitability KPIs are gross, operating and net profit margin, because they show how much of each sales dollar you keep at three levels. Add contribution margin for pricing decisions and ROIC to check whether your capital earns more than it costs. Those five cover most decisions.
What is a good net profit margin?
A net profit margin above 10% is generally considered good, around 5% is average, and under 5% is low — but it varies widely by industry. Supermarkets thrive on 2–3%, while software firms often exceed 20%. Always compare your margin to direct competitors, not to unrelated sectors.
How is gross profit margin different from net profit margin?
Gross profit margin subtracts only the direct cost of goods sold, showing whether your pricing works. Net profit margin subtracts every expense — overhead, interest and tax — showing what you actually keep. A healthy gross margin with a thin net margin usually points to bloated overhead, not a pricing problem.
What is the difference between ROE and ROIC?
ROE measures return on shareholder equity only, so it can be inflated by debt. ROIC measures the after-tax return on all invested capital — debt and equity together — so it is harder to game with leverage. ROIC is the better profitability KPI for judging whether the business genuinely creates value.
What is a healthy LTV:CAC ratio?
A 3:1 LTV:CAC ratio is the widely accepted healthy target: you earn three dollars of lifetime margin for every dollar spent acquiring a customer. Below 1:1 you lose money on each customer, while above 5:1 you may be under-spending on growth. Always calculate LTV on gross margin, not revenue.
How often should I review profitability KPIs?
Review margin KPIs monthly, alongside your management accounts, and return-on-capital metrics such as ROIC and ROE quarterly. Break-even and contribution margin should be recalculated any time you change pricing, cost structure or product mix, because those metrics move the moment your inputs do.
Can I track profitability KPIs in Excel or Google Sheets?
Yes. Every metric in this guide reduces to a simple formula, so Excel and Google Sheets handle profitability KPIs perfectly for small and mid-size teams. Pre-built templates like the Profitability Analysis or Retail Profit Margin dashboards ($9.99–$14.99) save you building the formulas, targets and charts yourself.
What is GMROI and why does it matter for retail?
GMROI (Gross Margin Return on Investment) shows how many gross-margin dollars you earn per dollar tied up in inventory. It matters because it rewards margin and turnover together — a modest-margin product that sells quickly can be far more profitable than a high-margin item that sits on the shelf. Aim for 2.0 or higher.
Why is my ROIC below my cost of capital a problem?
If ROIC sits below your weighted average cost of capital (typically 8–10%), the business destroys value with every dollar it invests — it earns less than the capital costs. Positive net profit can still mean value destruction. Raising ROIC above WACC is the clearest sign profitability is genuinely improving.
Which profitability dashboard should a small business start with?
Start with the Profitability Analysis KPI Dashboard in Google Sheets ($12.99) if you want the full margin-plus-returns picture, or the Retail Profit Margin dashboard ($9.99) if you mainly need margin control. Both work in a browser, need no setup, and cover the KPIs most small businesses actually act on.
Running a store as well? Our companion guide to the 12 retail KPIs to track in 2026 breaks down each metric with its formula, benchmark range and 8 ready-made dashboard templates.
Get more profitability KPI templates
Ready to stop guessing and start measuring? The Profitability Analysis KPI Dashboard ($12.99) gives you all 12 metrics with targets and traffic lights, or grab the Retail Profit Margin dashboard for just $9.99. Browse the full range of finance and KPI dashboards to build your complete reporting stack, and subscribe to NextGenTemplates on YouTube for step-by-step dashboard tutorials.
Quality is the other half of a healthy operation: see our companion guide to the 12 quality KPIs to track in 2026 — including DPMO, First Pass Yield and Cost of Quality with formulas and benchmarks.