

The 12 SEO KPIs worth tracking in 2026 are organic traffic, organic CTR, average position, keyword rankings, impressions, organic conversion rate, engagement rate, average engagement time, referring domains, domain rating, index coverage and Core Web Vitals. A ready-made SEO KPIs dashboard calculates every one of them straight from your Search Console and GA4 exports, so you stop copy-pasting numbers and start reading trends.
Last updated: September 2026
Key takeaways
- Track 12 SEO KPIs in four groups: visibility (impressions, average position, rankings), traffic (organic sessions, CTR), engagement (engagement rate, engagement time, conversion rate) and health (referring domains, domain rating, index coverage, Core Web Vitals).
- Organic CTR at position 1 averages 27–32%; by position 5 it falls to roughly 6–9%, so a page can gain rankings and still lose clicks.
- A good GA4 engagement rate sits around 55–70%, and Core Web Vitals should pass on 75%+ of your URLs.
- The best-value option is the SEO Content Performance KPI Dashboard in Google Sheets at $9.99; the most complete is the Excel edition at $14.99.
- These six ready-made templates ($6.99–$14.99) already calculate the formulas below—no add-ons, no monthly SaaS fee.
SEO KPIs dashboard templates compared
| Template | Format | Best for | Price |
|---|---|---|---|
| SEO Content Performance KPI Dashboard (Best overall) | Excel | Content and organic teams tracking rankings, CTR and conversions in one workbook | $14.99 |
| SEO Content Performance KPI Dashboard (Best value) | Google Sheets | Remote teams that want a shareable, always-online SEO KPIs dashboard | $9.99 |
| Website Traffic KPI Dashboard | Excel | Traffic-first tracking of sessions, channels and engagement | $12.99 |
| Website Traffic KPI Dashboard | Power BI | Analysts who want interactive, refreshable traffic reporting | $11.99 |
| Digital Marketing KPI Dashboard | Excel | Marketers reporting SEO alongside paid, social and email | $14.99 |
| Digital Marketing KPI Scorecard (Best budget) | HTML | A lightweight scorecard to embed or present without Excel | $6.99 |
The 12 SEO KPIs to track in 2026
Every metric below comes with a plain-English definition, the exact formula, a realistic benchmark range and the mistake most teams make. Pull the raw numbers from Google Search Console (visibility) and GA4 (behaviour), then let your SEO KPIs dashboard do the maths. Here is the whole set at a glance:
| # | Metric | Formula | Benchmark range | Where to see it |
|---|---|---|---|---|
| 1 | Organic traffic (sessions) | Sessions where channel = Organic Search | +10–20% MoM (young sites) | GA4 → Acquisition |
| 2 | Organic CTR | Clicks ÷ Impressions × 100 | Pos 1: 27–32%; page-1 avg 2–5% | Search Console → Performance |
| 3 | Average position | Σ(position × impressions) ÷ Σ impressions | < 10 (page 1); aim < 5 | Search Console → Performance |
| 4 | Keyword rankings (top 3) | Keywords in top 3 ÷ tracked keywords × 100 | 15–30% for mature sites | Rank tracker / Search Console |
| 5 | Impressions | Count of SERP appearances | Should trend up with content | Search Console → Performance |
| 6 | Organic conversion rate | Organic conversions ÷ organic sessions × 100 | 1–3% ecommerce; 2–5% lead-gen | GA4 → Conversions |
| 7 | Engagement rate | Engaged sessions ÷ total sessions × 100 | 55–70% good | GA4 → Engagement |
| 8 | Average engagement time | Total engagement time ÷ sessions | 45s–2 min+ (content-dependent) | GA4 → Engagement |
| 9 | Referring domains | Count of unique linking domains | Steady net growth | Ahrefs / Moz / Semrush |
| 10 | Domain rating / authority | Log-scaled score of link profile (0–100) | 30–50 mid; 50+ strong | Ahrefs DR / Moz DA |
| 11 | Index coverage | Indexed pages ÷ submitted pages × 100 | > 90% healthy | Search Console → Pages |
| 12 | Core Web Vitals pass rate | URLs rated “Good” ÷ total URLs × 100 | 75%+ of URLs “Good” | Search Console → Core Web Vitals |
1. Organic traffic (organic sessions)
Definition: the number of sessions that arrive from unpaid search results. Formula: count sessions where the default channel grouping equals Organic Search. Benchmark: a young site should add 10–20% month over month; a mature site aims for steady year-over-year growth against seasonality. The mistake teams make: watching total sessions instead of segmenting organic, and never splitting branded from non-branded queries—branded traffic flatters the number and hides whether your SEO is actually winning new demand.
2. Organic click-through rate (CTR)
Definition: the share of searchers who click your result after seeing it. Formula: clicks ÷ impressions × 100. Benchmark: position 1 pulls roughly 27–32%, position 3 around 10–13%, and by position 5 it is often 6–9%; a page-1 average of 2–5% is normal across a whole site. The mistake teams make: comparing a page’s CTR to a sitewide figure without adjusting for its position—a #8 ranking with 4% CTR is over-performing, not under.
3. Average position
Definition: the mean SERP rank of your pages across all queries. Formula: impression-weighted average, Σ(position × impressions) ÷ Σ impressions. Benchmark: under 10 puts you on page one; aim to move core money terms under 5. The mistake teams make: reading one blended number for the whole site. Thousands of low-impression long-tail terms drag the average down and mask real progress on the 20 queries that pay the bills—always segment by query group.
4. Keyword rankings (share in top 3 / top 10)
Definition: the proportion of your tracked keywords sitting in the top 3 or top 10 results. Formula: keywords in top 3 ÷ total tracked keywords × 100. Benchmark: mature sites typically hold 15–30% of tracked terms in the top 3. The mistake teams make: padding the tracked list with vanity or zero-intent keywords, which inflates the count while none of it converts. Track commercial and problem-aware terms, not head words you will never rank for.
5. Impressions
Definition: how many times your URLs appeared in search results, whether or not they were clicked. Formula: the raw impression count from Search Console. Benchmark: impressions should climb as you publish and get indexed; a sudden drop signals a ranking or indexing problem. The mistake teams make: celebrating rising impressions while clicks stay flat—that gap means you are surfacing for terms your title and meta description do not deserve the click on.
6. Organic conversion rate
Definition: the share of organic visitors who complete a goal—a purchase, a lead, a signup. Formula: organic conversions ÷ organic sessions × 100. Benchmark: 1–3% is typical for ecommerce and 2–5% for B2B lead generation. The mistake teams make: never configuring GA4 key events, so SEO looks like it drives traffic but no revenue—or relying on last-click only and starving organic of assisted-conversion credit.
7. Engagement rate
Definition: GA4’s replacement for bounce rate—the share of sessions that lasted 10+ seconds, fired a key event, or had 2+ pageviews. Formula: engaged sessions ÷ total sessions × 100. Benchmark: 55–70% is healthy for content pages. The mistake teams make: still quoting the old Universal Analytics bounce rate, which is defined completely differently and is not comparable to anything GA4 reports today.
8. Average engagement time
Definition: the average time your page was actually in focus in the browser. Formula: total engagement time ÷ number of sessions. Benchmark: 45 seconds to 2+ minutes depending on content length and intent. The mistake teams make: reading the number without context—a 40-second average is excellent for a quick-answer page and poor for a 3,000-word guide, so always judge it against the job the page is doing.
9. Referring domains
Definition: the count of unique websites that link to you at least once. Formula: distinct linking root domains from a backlink tool. Benchmark: steady net positive growth matters more than any absolute number. The mistake teams make: reporting total backlinks instead of referring domains—10,000 links from one site is one vote—or chasing volume with bought links that risk a manual action instead of earning relevant, authoritative ones.
10. Domain rating / domain authority
Definition: a third-party 0–100 score estimating the strength of your backlink profile (Ahrefs Domain Rating, Moz Domain Authority). Formula: a proprietary, log-scaled model of referring domains and their own authority. Benchmark: 30–50 is a solid mid-market site; 50+ is strong. The mistake teams make: treating it as a Google ranking factor. It is a useful competitive yardstick, not a metric Google uses—do not optimise for the score itself.
11. Index coverage
Definition: the share of your important pages Google has actually indexed. Formula: indexed pages ÷ submitted (or total valuable) pages × 100. Benchmark: above 90% for the URLs you care about. The mistake teams make: ignoring the “Crawled – currently not indexed” and “Discovered – not indexed” buckets, which is where thin or duplicate pages quietly pile up and drag site quality down.
12. Core Web Vitals pass rate
Definition: the share of your URLs with “Good” real-user scores for LCP (loading), INP (interactivity) and CLS (visual stability). Formula: URLs rated Good ÷ total URLs × 100, using field data. Benchmark: pass thresholds are LCP < 2.5s, INP < 200ms and CLS < 0.1, and you want 75%+ of URLs in the Good bucket. The mistake teams make: optimising lab scores from Lighthouse instead of the field Core Web Vitals data Google actually uses from the Chrome UX Report.
How we picked these dashboards
We searched the full NextGenTemplates catalogue of KPI dashboards across Excel, Google Sheets, Power BI and HTML, and shortlisted only those that calculate the 12 metrics above from standard Search Console and GA4 exports. We prioritised templates with pre-built formulas, editable targets and clear month-over-month trends, and we excluded generic marketing planners that track activity but not outcomes. Prices shown are the current published USD prices; every product is a one-time purchase, not a subscription.
The 6 best SEO KPIs dashboard templates for 2026
1. SEO Content Performance KPI Dashboard in Excel — best overall

What it is: a complete Excel workbook that turns raw Search Console and GA4 exports into a ranked SEO scorecard. Who it is for: content and organic-search teams that live in Excel and want every metric in one file.
- Tracks rankings, impressions, CTR, sessions and conversions side by side
- Editable targets with red/amber/green status on every KPI
- Month-over-month and cumulative trend charts built in
- Per-URL and per-keyword tabs so you can drill into winners and losers
Use it to spot the page that jumped from position 8 to 4 but lost CTR, the cluster where impressions rose 40% with flat clicks, or the 20 posts driving 80% of organic conversions. Price: $14.99. Get the SEO Content Performance KPI Dashboard in Excel.
Best for: the team that wants one authoritative SEO KPIs dashboard and already works in Excel.
2. SEO Content Performance KPI Dashboard in Google Sheets — best value
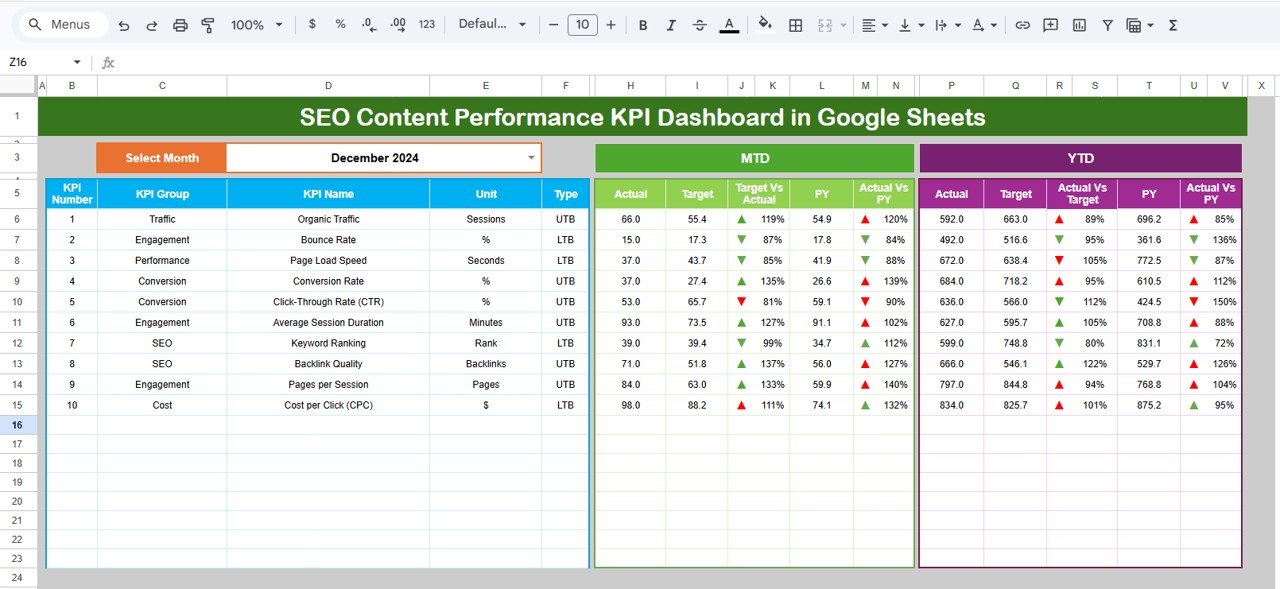
What it is: the same SEO scorecard, rebuilt natively in Google Sheets. Who it is for: distributed teams that want a live, shareable dashboard without a paid seat for everyone.
- Always online—share a link, control edit vs view access
- Connects cleanly to Search Console and GA4 CSV exports
- Same KPI logic, targets and trend charts as the Excel edition
- Works on any device with a browser, no install needed
At $9.99 it is the cheapest way to give a whole team a shared SEO KPIs dashboard they can all read in real time. Price: $9.99. Get the Google Sheets edition.
Best for: remote and agency teams that value sharing over offline power.
3. Website Traffic KPI Dashboard in Excel
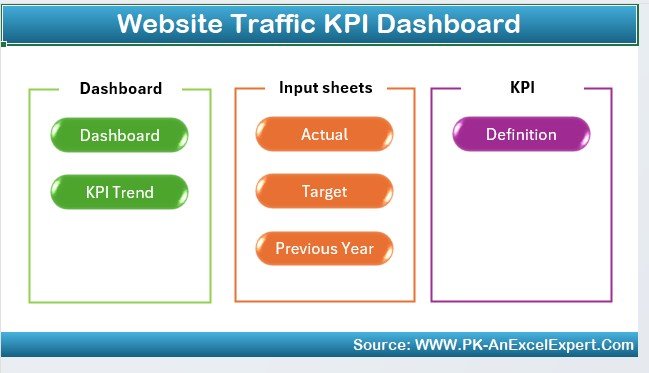
What it is: a traffic-first workbook centred on sessions, channels, engagement and conversions. Who it is for: teams whose first question is “where is traffic coming from and is it engaging?”
- Channel breakdown so organic sits next to direct, social and referral
- Engagement rate and average engagement time tracked over time
- Session, user and conversion trends with editable monthly targets
Pair it with the SEO edition when you want traffic context around your ranking data. Price: $12.99. Get the Website Traffic KPI Dashboard in Excel.
Best for: traffic and channel reporting alongside SEO.
4. Website Traffic KPI Dashboard in Power BI
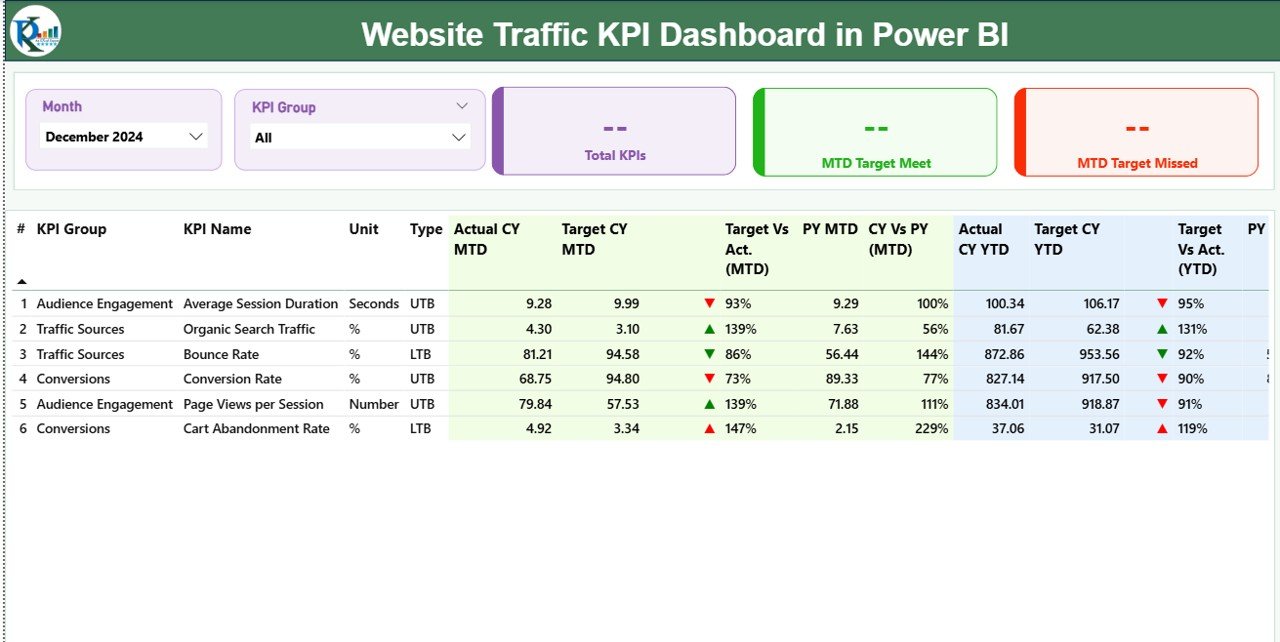
What it is: the traffic dashboard rebuilt in Power BI for interactive, refreshable reporting. Who it is for: analysts and stakeholders who want to slice data by date, channel and page on click.
- Interactive filters and drill-through instead of static tables
- Refreshable data model—update the source and the whole report updates
- Presentation-ready visuals for monthly stakeholder reviews
Price: $11.99. Get the Power BI edition.
Best for: interactive reporting and non-spreadsheet stakeholders.
5. Digital Marketing KPI Dashboard in Excel
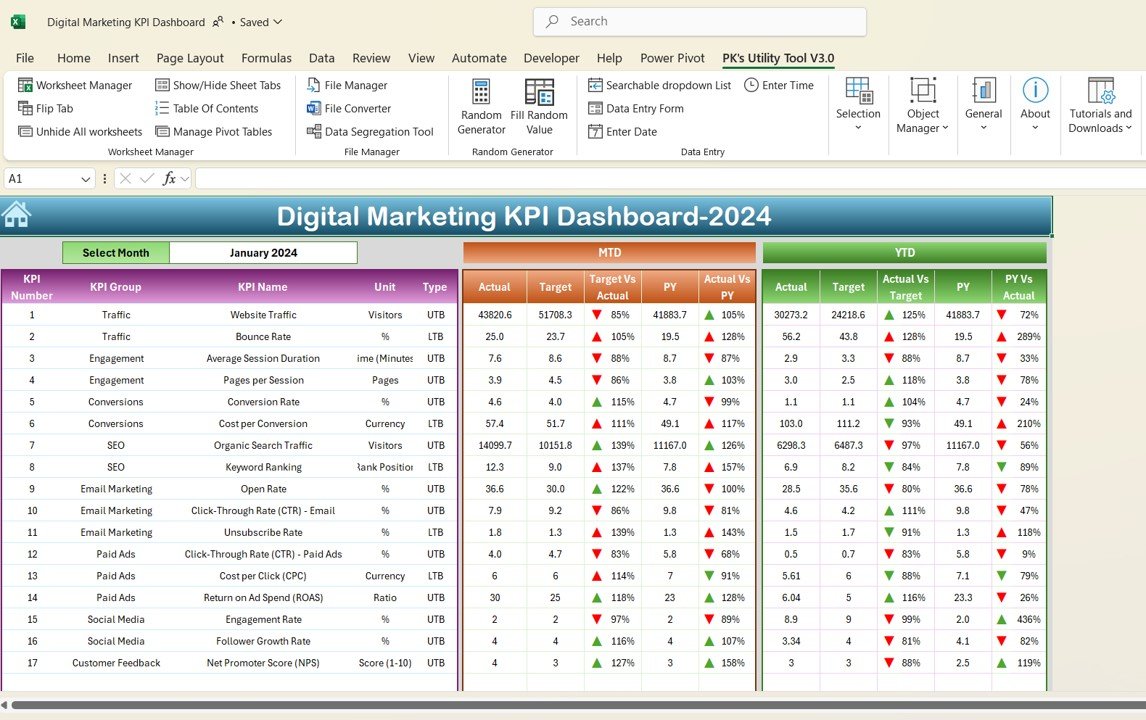
What it is: a broader marketing scorecard that reports SEO alongside paid, social and email. Who it is for: marketing managers who need one board-level view across every channel.
- Organic KPIs sit next to CPC, ROAS, email and social metrics
- Channel-level and blended totals with targets and variance
- Great for monthly marketing reports to leadership
Price: $14.99. Get the Digital Marketing KPI Dashboard in Excel.
Best for: reporting SEO as part of the whole marketing mix.
6. Digital Marketing KPI Scorecard in HTML — best budget
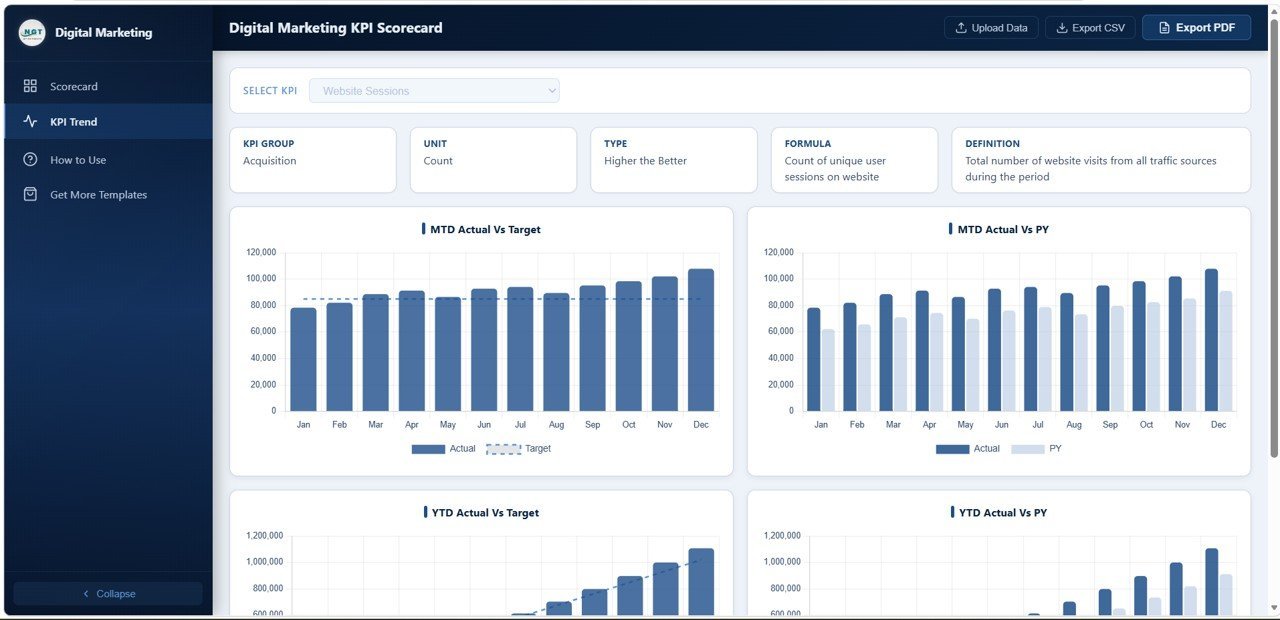
What it is: a lightweight, self-contained HTML scorecard you can open in any browser or embed in a page. Who it is for: anyone who wants a clean KPI view without opening Excel or paying for a BI seat.
- Single file—no software beyond a browser
- Editable KPI tiles with status colours
- Easy to screenshot or present in a meeting
At $6.99 it is the cheapest entry point in this list. Price: $6.99. Get the HTML scorecard.
Best for: a fast, no-install scorecard on the smallest budget.
How to choose between them
| Your situation | Pick this | Price |
|---|---|---|
| Pure SEO, work in Excel | SEO Content Performance KPI Dashboard (Excel) | $14.99 |
| Pure SEO, shared team | SEO Content Performance KPI Dashboard (Google Sheets) | $9.99 |
| Traffic and channels focus | Website Traffic KPI Dashboard (Excel) | $12.99 |
| Interactive stakeholder reports | Website Traffic KPI Dashboard (Power BI) | $11.99 |
| SEO inside the full marketing mix | Digital Marketing KPI Dashboard (Excel) | $14.99 |
| Smallest budget / no install | Digital Marketing KPI Scorecard (HTML) | $6.99 |
If you only buy one, take the Excel or Google Sheets SEO Content Performance dashboard—they cover all 12 KPIs. Add a traffic or full-marketing dashboard only when you report beyond organic search. For related roles, see our 15 marketing KPIs to track in 2026 and 15 sales KPIs to track in 2026 guides.
When a template is NOT the right answer
A spreadsheet SEO KPIs dashboard is the right tool for monthly and weekly reporting, target-setting and trend analysis. It is the wrong tool in three cases. First, if you need real-time rank tracking across thousands of keywords daily, buy a dedicated tool like Ahrefs, Semrush or Sitebulb—a template cannot crawl the SERP for you. Second, if you want automated daily data pipelines feeding a live BI warehouse, invest in Looker Studio connectors or a data team, not a manual export. Third, if no one on the team will export data or update the file, even the best dashboard goes stale—fix the process before you buy the template. Templates calculate and visualise; they do not collect data or enforce a reporting habit.
If organic search feeds a publishing business, compare these with the best publishing dashboard templates for media teams, which track page views, ad click rate and subscriber growth next to SEO metrics.
Frequently asked questions
What is an SEO KPIs dashboard?
An SEO KPIs dashboard is a single view—usually a spreadsheet or BI report—that pulls your key search metrics together and turns raw exports into targets, trends and status colours. Instead of reading Search Console and GA4 separately, you see rankings, traffic, engagement and conversions on one page and track them month over month.
What are the most important SEO KPIs to track in 2026?
Start with organic traffic, organic CTR, average position and organic conversion rate—they connect visibility to revenue. Add keyword rankings, impressions and engagement rate for context, then referring domains, domain rating, index coverage and Core Web Vitals for site health. Twelve KPIs across visibility, traffic, engagement and health cover almost every reporting need.
How do I calculate organic CTR?
Divide clicks by impressions and multiply by 100. Both numbers come straight from the Search Console Performance report. Always compare a page’s CTR to the benchmark for its ranking position, not to your sitewide average—a result in position 8 with 4% CTR is actually beating expectations for that slot.
What is a good engagement rate in GA4?
For content and blog pages, an engagement rate of 55–70% is healthy. Engagement rate is the share of sessions that lasted 10+ seconds, triggered a key event, or had two or more pageviews. It replaced Universal Analytics’ bounce rate, which was defined differently, so do not compare the two figures directly.
Where does the data for an SEO KPIs dashboard come from?
Visibility metrics—impressions, clicks, CTR, average position, index coverage and Core Web Vitals—come from Google Search Console. Behaviour metrics—sessions, engagement rate, engagement time and conversions—come from GA4. Link metrics such as referring domains and domain rating come from Ahrefs, Moz or Semrush. Export each as CSV and paste into the template.
Do I need Excel, Google Sheets or Power BI?
Choose by workflow. Excel suits offline power users; Google Sheets suits shared, always-online teams; Power BI suits interactive, refreshable stakeholder reports; and the HTML scorecard suits a quick, no-install view. All four calculate the same 12 KPIs—the difference is how you share and interact with them, and the price, which runs $6.99 to $14.99.
How often should I update my SEO KPIs dashboard?
Update monthly for reporting and trend analysis, which matches how Search Console and GA4 data settle. Check weekly if you are running an active campaign or recovering from a drop. Daily rank tracking is a job for a dedicated SEO tool, not a manual spreadsheet—templates are built for the reporting cadence, not live monitoring.
Is domain authority a Google ranking factor?
No. Domain Rating (Ahrefs) and Domain Authority (Moz) are third-party 0–100 scores that estimate the strength of your backlink profile. Google does not use them. They are useful for benchmarking against competitors and tracking your link profile over time, but you should never optimise for the score itself—optimise for relevant, authoritative referring domains.
What are good Core Web Vitals thresholds?
A URL passes when its real-user LCP is under 2.5 seconds, INP is under 200 milliseconds and CLS is under 0.1. Aim to have at least 75% of your URLs in the “Good” bucket. Use field data from Search Console’s Core Web Vitals report, not lab scores from Lighthouse, because Google ranks on real-user data.
Can one dashboard replace tools like Ahrefs or Semrush?
No, and it is not meant to. A dashboard template is a reporting and target-setting layer that sits on top of the data those tools and Google’s own products produce. It saves you the manual work of assembling a monthly scorecard. For crawling, keyword research and daily rank tracking, you still need a dedicated SEO platform.
Get more SEO KPIs dashboard templates
Ready to stop rebuilding your SEO report every month? The SEO Content Performance KPI Dashboard in Excel ($14.99) calculates all 12 KPIs above out of the box, or grab the Google Sheets edition for just $9.99 if your team works online. Browse related scorecards like our 12 inventory KPIs, 10 warehouse KPIs, 15 HR KPIs and 10 CRM metrics guides, and subscribe to NextGenTemplates on YouTube for walkthroughs of every dashboard.