

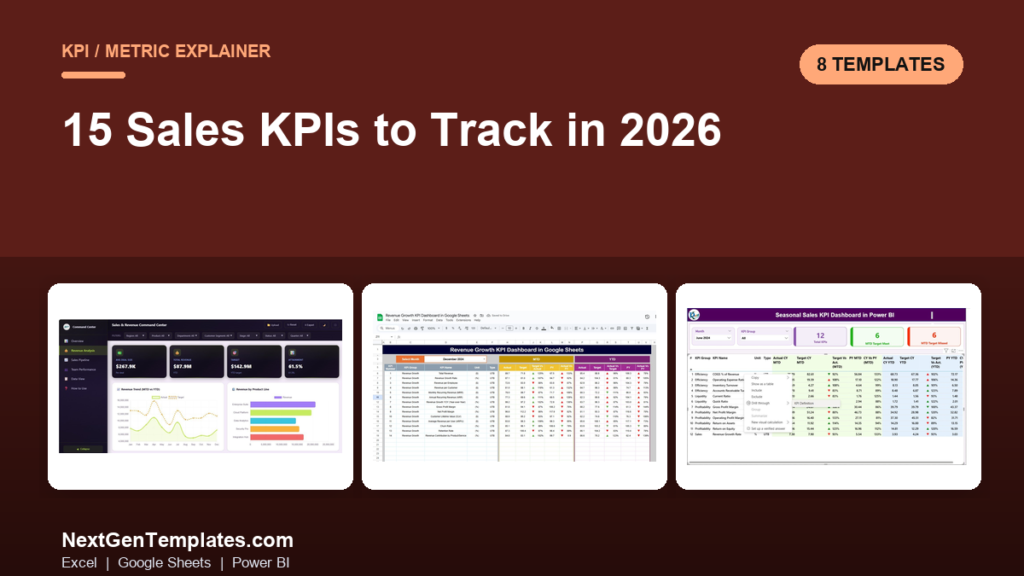
Sales KPIs are the quantified measures that tell a revenue team whether it will hit target: revenue, growth rate, win rate, sales cycle length, pipeline coverage, CAC, LTV and retention. Track the 15 below with their formulas and benchmarks, then let a ready-made dashboard calculate them for you from $9.99.
Last updated: September 2026
Key takeaways
- The 15 sales KPIs that matter in 2026 fall into four buckets: revenue, efficiency, pipeline and customer economics.
- A healthy LTV:CAC ratio is 3:1 or higher — below that, growth burns more cash than it earns.
- Median B2B win rates sit around 20–30%; anything under 15% usually means the pipeline is unqualified, not the reps.
- You do not need a BI team: the Revenue Growth KPI Dashboard in Google Sheets ($9.99) calculates growth, MRR and retention from a single input table.
- All 8 dashboard templates in this guide are one-time purchases between $9.99 and $39.99 — no per-seat SaaS fees.
Sales KPI dashboard templates compared
| Template | Format | Best for | Price |
|---|---|---|---|
| CRM & Sales Pipeline Management System (Best overall) | Excel Web App | Full pipeline, win rate & cycle-length tracking | $39.99 |
| Sales & Revenue Command Center Dashboard | HTML | Executive revenue & growth snapshot | $12.99 |
| Revenue Growth KPI Dashboard (Best value) | Google Sheets | Growth, MRR & retention on a budget | $9.99 |
| Seasonal Sales KPI Dashboard | Power BI | Peak-season & period-over-period analysis | $11.99 |
| Channel Sales KPI Dashboard | Power BI | Multi-channel / partner revenue | $11.99 |
| Sales & Marketing Stakeholder Reporting KPI Dashboard | Excel | Board & stakeholder reporting | $14.99 |
| Sales & Marketing Product Development KPI Dashboard | Excel | Product-line sales performance | $14.99 |
| Sales & Marketing Employee Satisfaction KPI Dashboard | Excel | Rep engagement vs. quota attainment | $14.99 |
How we picked these
We searched the full NextGenTemplates catalogue of 900+ paid templates for tools that actually calculate sales KPIs rather than just chart them, then filtered to those that stay current for a 2026 sales motion. Selection criteria: the template must compute at least five of the fifteen KPIs below from raw inputs, cover more than one file format across the shortlist, and require no coding.
We excluded free trackers (no formulas behind the visuals), single-metric widgets, and anything that needed a paid BI licence to open. What survived is eight one-time-purchase dashboards spanning Excel, Google Sheets, Power BI and HTML, so a reader can self-select by the tool they already own. For a broader visual comparison, see our roundup of the best sales dashboard templates for 2026.
The 15 sales KPIs to track in 2026
Each KPI below has a one-sentence definition, the exact formula, a realistic benchmark range, and the mistake teams most often make with it. Treat the benchmarks as starting points — your industry, deal size and motion will move them.
| # | Metric | Formula | Benchmark | Where to see it |
|---|---|---|---|---|
| 1 | Total Sales Revenue | Sum of closed-won deal value in period | Growth vs. target | Revenue Command Center |
| 2 | Sales Growth Rate (YoY) | (This period − Prior period) / Prior period × 100 | 10–30% B2B | Revenue Growth (Sheets) |
| 3 | Average Deal Size | Total revenue / number of closed-won deals | Trending up | CRM & Pipeline system |
| 4 | Win Rate | Won deals / total closed deals × 100 | 20–30% | CRM & Pipeline system |
| 5 | Sales Cycle Length | Avg days from opportunity created to closed-won | Shorter is better | CRM & Pipeline system |
| 6 | Lead-to-Opportunity Conversion | Opportunities / qualified leads × 100 | 10–25% | Channel Sales (Power BI) |
| 7 | Lead Response Time | Avg time from inbound lead to first contact | < 5 minutes | CRM & Pipeline system |
| 8 | Pipeline Coverage Ratio | Open pipeline value / remaining quota | 3×–4× | Stakeholder Reporting |
| 9 | Quota Attainment | Actual sales / quota × 100 | 60–70% of reps at 100% | Employee Satisfaction KPI |
| 10 | Customer Acquisition Cost (CAC) | Total sales & marketing spend / new customers | Payback < 12 months | Stakeholder Reporting |
| 11 | Customer Lifetime Value (CLV) | Avg revenue per customer × gross margin × lifespan | Rising over time | Revenue Growth (Sheets) |
| 12 | LTV:CAC Ratio | Customer lifetime value / acquisition cost | ≥ 3:1 | Stakeholder Reporting |
| 13 | Monthly Recurring Revenue (MRR) | Sum of active monthly subscription value | Steady growth | Revenue Growth (Sheets) |
| 14 | Net Revenue Retention (NRR) | (Start MRR + expansion − churn − contraction) / Start MRR | > 100% | Revenue Growth (Sheets) |
| 15 | Customer Churn Rate | Customers lost / customers at start × 100 | < 5% annual (B2B) | Seasonal Sales (Power BI) |
1. Total Sales Revenue
Definition: the total value of all closed-won deals in a period. Formula: sum of deal value for won opportunities. Benchmark: judged against target and prior period, not an absolute number. Common mistake: reporting booked revenue while the board wants recognised revenue — mixing the two makes the number impossible to reconcile with finance.
2. Sales Growth Rate (YoY)
Definition: the percentage change in revenue versus the same period last year. Formula: (This period − Prior period) / Prior period × 100. Benchmark: 10–30% is healthy for established B2B; early-stage SaaS aims far higher. Common mistake: comparing month-over-month in a seasonal business and mistaking a calendar dip for a real decline.
3. Average Deal Size
Definition: the mean value of a closed-won deal. Formula: total revenue / number of won deals. Benchmark: the trend matters more than the level — a rising average signals up-market movement. Common mistake: letting one enterprise whale distort the average; track the median alongside it.
4. Win Rate
Definition: the share of closed deals that were won. Formula: won deals / total closed deals × 100. Benchmark: 20–30% is typical for B2B. Common mistake: counting only late-stage deals in the denominator, which inflates the rate and hides top-of-funnel qualification problems.
5. Sales Cycle Length
Definition: average time from opportunity creation to closed-won. Formula: mean of (close date − created date) across won deals. Benchmark: shorter is better; watch the trend by segment. Common mistake: averaging won and lost deals together — lost deals often die slowly and distort the figure.
6. Lead-to-Opportunity Conversion Rate
Definition: the share of qualified leads that become sales opportunities. Formula: opportunities / qualified leads × 100. Benchmark: 10–25% depending on lead source. Common mistake: mixing marketing-qualified and sales-qualified leads in one ratio, so nobody can tell where the funnel leaks.
7. Lead Response Time
Definition: the average time between an inbound lead arriving and the first sales touch. Formula: mean of (first-contact time − lead-created time). Benchmark: under five minutes for hot inbound leads. Common mistake: measuring the average while ignoring the long tail — a five-hour outlier costs the deal even if the mean looks fine.
8. Pipeline Coverage Ratio
Definition: how many times your open pipeline covers the remaining quota. Formula: open pipeline value / remaining quota. Benchmark: 3×–4× for a typical win rate. Common mistake: counting stale, un-worked opportunities as coverage; age the pipeline first.
9. Quota Attainment
Definition: actual sales as a percentage of quota, per rep and team. Formula: actual sales / quota × 100. Benchmark: a healthy team has 60–70% of reps at or above 100%. Common mistake: celebrating a high team average that is really one hero carrying a struggling roster.
10. Customer Acquisition Cost (CAC)
Definition: the fully-loaded cost to win one new customer. Formula: total sales & marketing spend / new customers acquired. Benchmark: aim to recover CAC within 12 months. Common mistake: leaving salaries and tooling out of the numerator, which flatters CAC and hides an unprofitable motion.
11. Customer Lifetime Value (CLV)
Definition: the total gross profit expected from a customer over their lifetime. Formula: average revenue per customer × gross margin × average lifespan. Benchmark: should rise as onboarding and retention improve. Common mistake: using revenue instead of gross-margin dollars, which overstates value for low-margin products.
12. LTV:CAC Ratio
Definition: lifetime value divided by acquisition cost — the single clearest read on unit economics. Formula: CLV / CAC. Benchmark: 3:1 or better; 1:1 means you are buying revenue at a loss. Common mistake: chasing a ratio above 5:1, which usually means you are under-investing in growth, not winning.
13. Monthly Recurring Revenue (MRR)
Definition: predictable subscription revenue normalised to a month. Formula: sum of active monthly subscription value. Benchmark: steady net-new growth month over month. Common mistake: booking annual contracts as a single MRR spike instead of dividing by twelve.
14. Net Revenue Retention (NRR)
Definition: how much recurring revenue you keep and expand from existing customers. Formula: (starting MRR + expansion − churn − contraction) / starting MRR. Benchmark: above 100% means you grow even with zero new logos. Common mistake: reporting gross retention as NRR and missing the expansion story entirely.
15. Customer Churn Rate
Definition: the share of customers lost in a period. Formula: customers lost / customers at start × 100. Benchmark: under 5% annually for healthy B2B. Common mistake: measuring logo churn only and ignoring revenue churn, so the loss of a few big accounts stays invisible.
Tracking these by hand in a spreadsheet works until the formulas break. The eight dashboards below already calculate them — pick by the metric you care about most and the tool you already use. If your priority is the top of the funnel rather than the metrics themselves, our Pipedrive alternatives and sales pipeline templates guide is a better starting point, and the lead tracker to pipeline dashboard stack shows how the pieces connect.
8 sales KPI dashboard templates that already calculate these metrics
1. CRM & Sales Pipeline Management System Web App — best overall
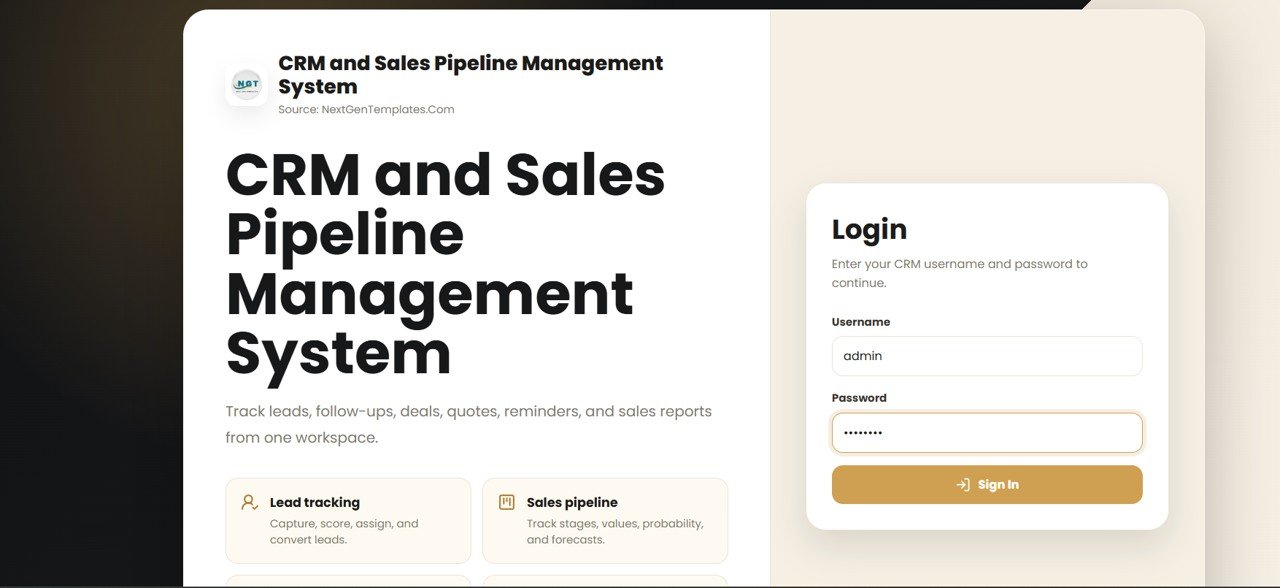
What it is: a full Excel-based CRM and pipeline system, not just a chart pack. Who it is for: SMB sales teams that want win rate, cycle length, average deal size and pipeline coverage from one operational tool.
- Contact, lead and opportunity records with stage tracking
- Automatic win rate, average deal size and sales cycle calculation
- Pipeline coverage against quota
- Activity logging for lead response time
A 6-rep team using it to enforce a five-minute lead response and a 3× coverage rule typically sees win rate move several points inside a quarter. Price: $39.99. Get the CRM & Sales Pipeline system. Best for: teams that want to run the pipeline and measure it in the same file.
2. Sales & Revenue Command Center Dashboard in HTML
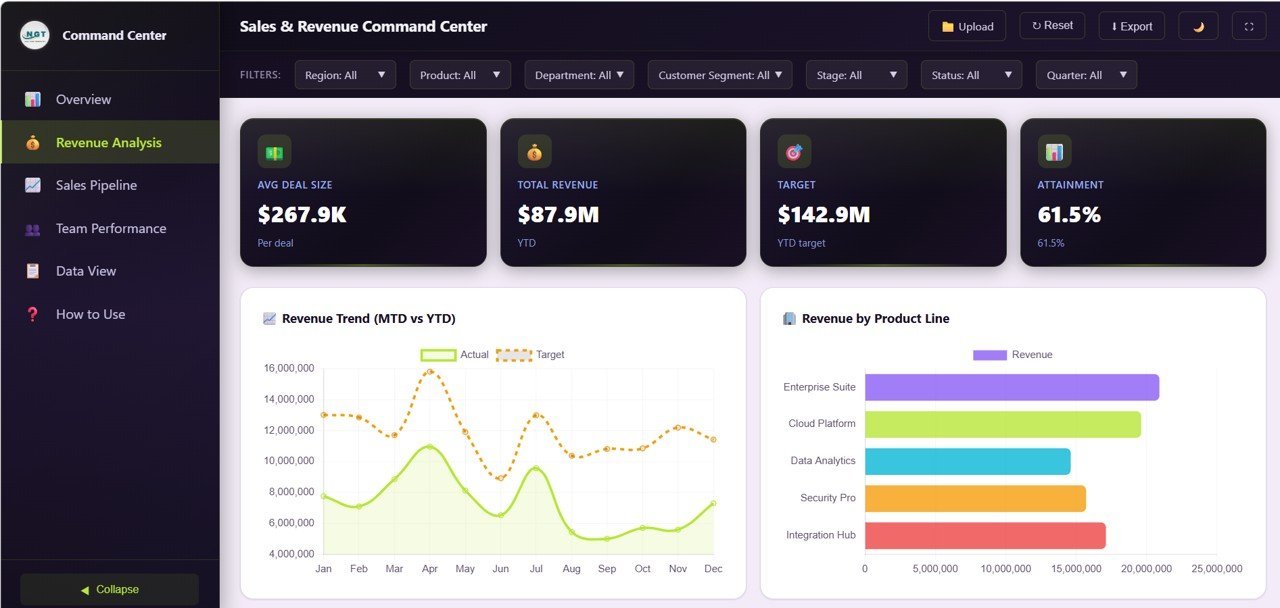
What it is: a browser-based executive dashboard for revenue, growth and product-line performance. Who it is for: founders and heads of sales who want a clean revenue snapshot on any device with no software to install.
- Revenue vs. target with MTD and YTD views
- Growth rate and revenue-by-product-line charts
- Runs in any browser — nothing to license
Price: $12.99. Get the Sales & Revenue Command Center. Best for: a shareable, install-free revenue view for leadership.
3. Revenue Growth KPI Dashboard in Google Sheets — best value
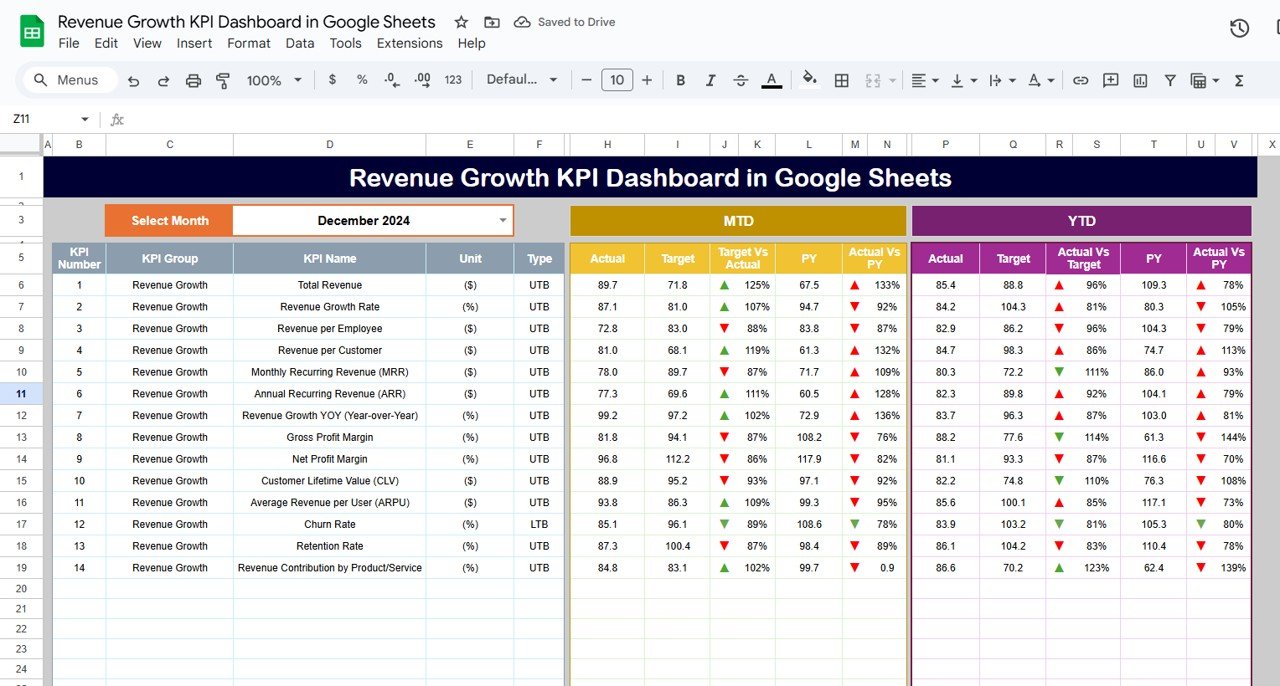
What it is: a formula-driven growth and retention scorecard in Google Sheets. Who it is for: lean teams that live in Google Workspace and want growth, MRR, CLV and NRR without a BI tool.
- MTD/YTD growth rate with a month picker
- MRR, CLV and net revenue retention
- Traffic-light targets and trend charts
At $9.99 it is the cheapest way to get subscription-economics KPIs calculated automatically. Price: $9.99. Get the Revenue Growth KPI Dashboard. Best for: Google Sheets teams on a budget.
4. Seasonal Sales KPI Dashboard in Power BI
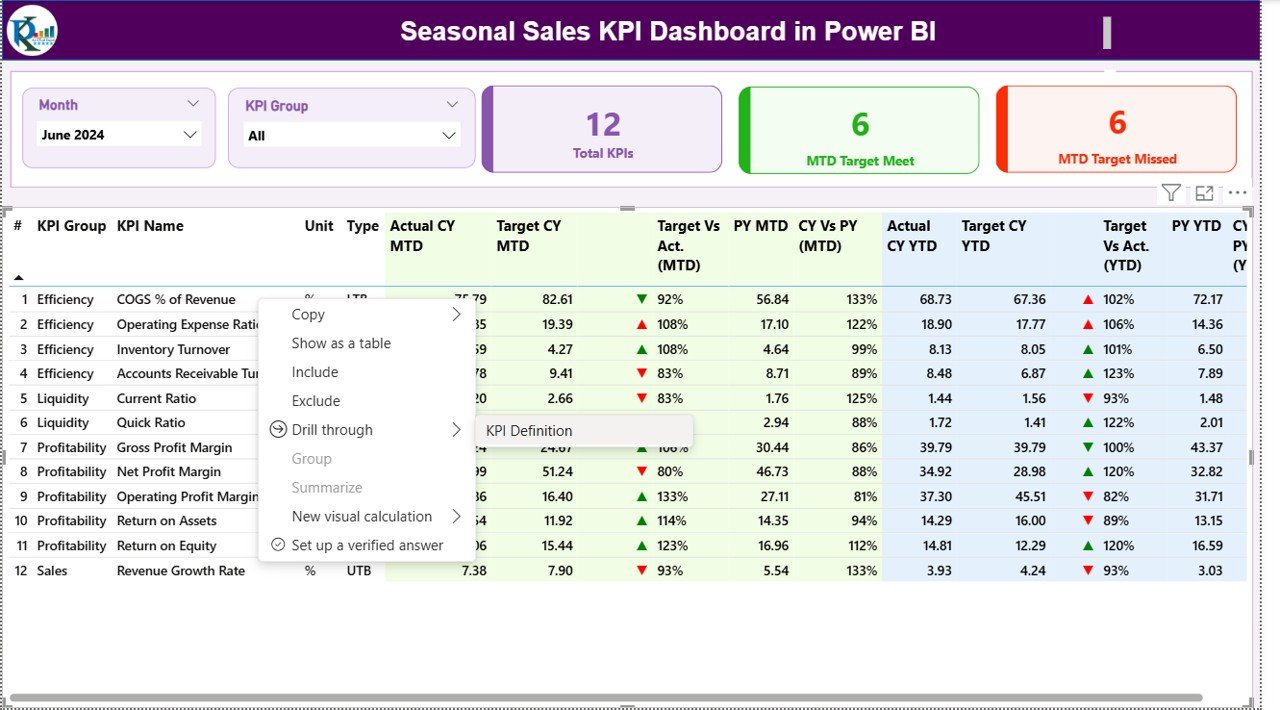
What it is: a Power BI model built for period-over-period and peak-season analysis. Who it is for: retail and consumer teams whose revenue swings by season and who need actual-vs-prior-year comparisons.
- MTD/YTD actual vs. prior-year and target
- Churn and seasonality breakdowns
- Drill-through by KPI group
Price: $11.99. Get the Seasonal Sales KPI Dashboard. Best for: seasonal businesses that already run Power BI.
5. Channel Sales KPI Dashboard in Power BI
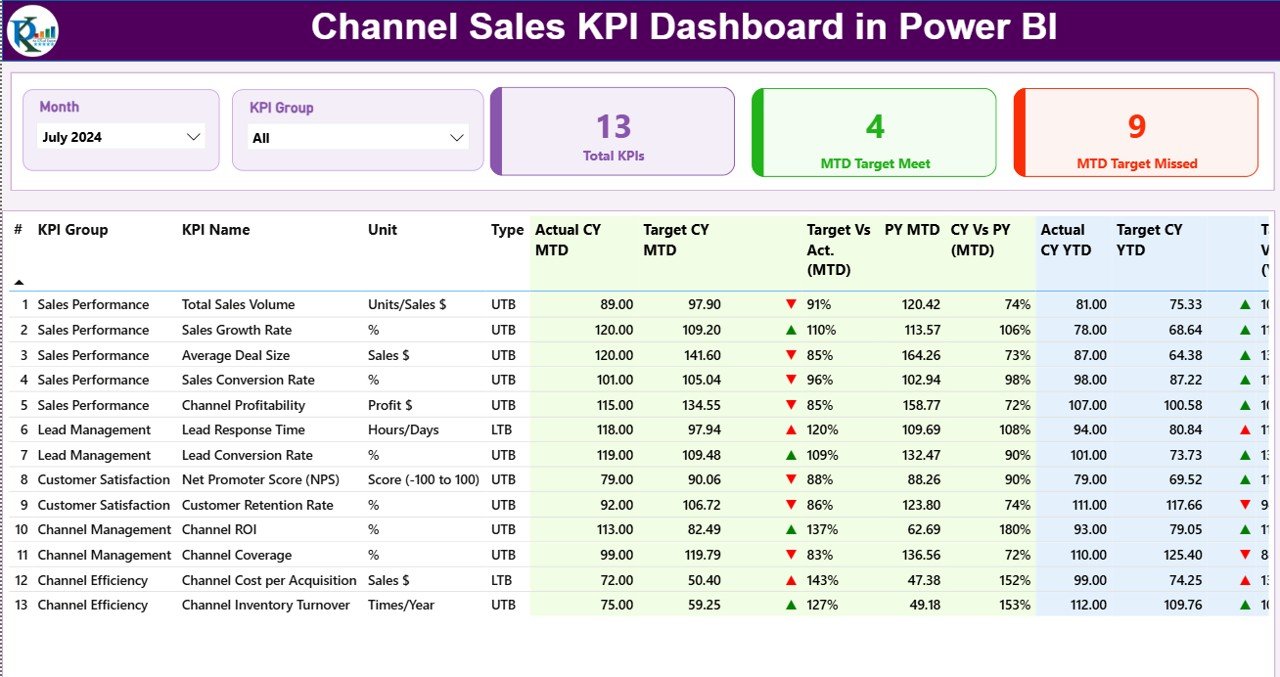
What it is: a Power BI dashboard that splits sales KPIs by channel and partner. Who it is for: teams selling through resellers, marketplaces or multiple direct channels who need conversion and revenue per channel.
- Revenue, conversion and growth per channel
- Partner and region comparisons
- Lead-to-opportunity conversion by source
Price: $11.99. Get the Channel Sales KPI Dashboard. Best for: multi-channel and partner-led revenue.
6. Sales & Marketing Stakeholder Reporting KPI Dashboard in Excel

What it is: an Excel dashboard built for board and stakeholder reporting, covering CAC, LTV:CAC and pipeline coverage. Who it is for: RevOps and finance who present sales KPIs to leadership every month.
- CAC, payback and LTV:CAC unit economics
- Pipeline coverage and quota roll-up
- Board-ready summary layout
Price: $14.99. Get the Stakeholder Reporting Dashboard. Best for: monthly board and investor reporting.
7. Sales & Marketing Product Development KPI Dashboard in Excel
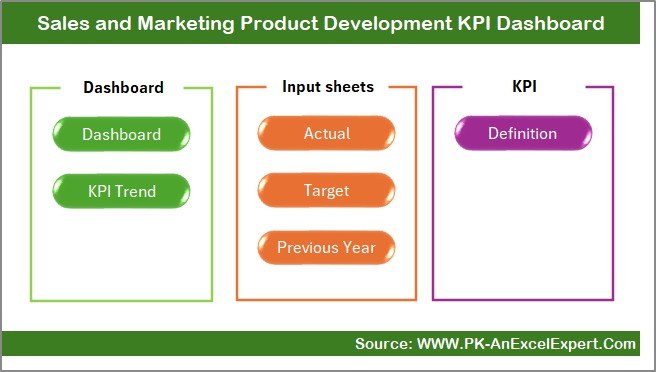
What it is: an Excel dashboard that ties sales KPIs to product lines and launches. Who it is for: teams with a broad catalogue who need to see which products drive revenue and margin.
- Revenue and growth by product line
- Average deal size per product
- Launch-performance tracking
Price: $14.99. Get the Product Development KPI Dashboard. Best for: multi-product portfolios.
8. Sales & Marketing Employee Satisfaction KPI Dashboard in Excel

What it is: an Excel dashboard that reads rep engagement against quota attainment. Who it is for: sales managers who want to catch burnout and attrition before it hits the number.
- Quota attainment by rep and team
- Engagement and satisfaction scoring
- Attainment-vs-satisfaction correlation view
Price: $14.99. Get the Employee Satisfaction KPI Dashboard. Best for: managers protecting quota attainment through retention.
How to choose between them
| If you want to… | And you use… | Buy this |
|---|---|---|
| Run and measure the pipeline together | Excel | CRM & Sales Pipeline System ($39.99) |
| Show leadership one revenue view | Any browser | Revenue Command Center ($12.99) |
| Track growth, MRR & retention cheaply | Google Sheets | Revenue Growth KPI Dashboard ($9.99) |
| Analyse seasonality or channels | Power BI | Seasonal or Channel Sales ($11.99) |
| Report unit economics to the board | Excel | Stakeholder Reporting ($14.99) |
Short version: pick by the tool your team already opens every day, then by the single KPI that decides your quarter. If two dashboards fit, the Google Sheets option is the cheapest place to start and you can graduate to Power BI later. Teams comparing this against enterprise CRMs should also read our Salesforce alternatives in Excel and Sheets and the reasons behind our sales BI dashboards.
When a template is NOT the right answer
A spreadsheet or Power BI template is the wrong tool when your data lives in a system it cannot reach in real time. If you have hundreds of reps, need live pipeline sync from a CRM, or must enforce field-level permissions and audit trails, buy sales software instead — a static dashboard will drift out of date within a day.
Templates also stop making sense when the metric itself is contested inside the company. If sales and finance cannot agree on what counts as revenue or a qualified lead, no dashboard fixes that — you need a definition first, then the template. And if you only ever look at one number, a full 15-KPI dashboard is overkill; a single tracker will do. For teams that mainly need a visual, our roundup of CRM dashboards is a lighter starting point. For a wider view of how these metrics are defined across the industry, HubSpot maintains a useful reference on sales metrics.
Frequently asked questions
What are the most important sales KPIs to track?
The core sales KPIs are revenue, sales growth rate, win rate, sales cycle length, pipeline coverage, CAC, LTV and net revenue retention. Together they cover whether you are selling enough, selling efficiently, and keeping the customers you win. Start with these before adding niche metrics.
What is a good LTV:CAC ratio?
A ratio of 3:1 or higher is considered healthy — you earn three dollars of lifetime value for every dollar spent acquiring a customer. At 1:1 you are buying revenue at a loss, while a ratio above 5:1 often signals you are under-investing in growth rather than winning at it.
What is a typical B2B sales win rate?
Most B2B teams win 20–30% of the deals they close. Rates under 15% usually point to an unqualified pipeline rather than weak reps. Measure win rate on all closed deals, not just late-stage ones, or the number will look artificially high.
How do I calculate sales growth rate?
Subtract the prior period’s revenue from the current period’s, divide by the prior period, and multiply by 100. For example, growing from $200k to $260k is (260−200)/200 × 100 = 30%. Compare year-over-year in seasonal businesses so calendar swings do not distort the figure.
Can I track sales KPIs in Google Sheets?
Yes. A formula-driven template like the Revenue Growth KPI Dashboard in Google Sheets ($9.99) calculates growth rate, MRR, CLV and retention from one input table, with a month picker and traffic-light targets. It is the cheapest way to automate sales KPI tracking without a BI licence.
What is a good sales cycle length?
There is no universal number — it depends on deal size and industry — so track the trend rather than an absolute. A shortening cycle for the same deal size is a strong signal. Always separate won and lost deals, because lost deals often linger and inflate the average.
How many sales KPIs should a team track?
Most teams do well with 8–15 sales KPIs across revenue, efficiency, pipeline and customer economics. Fewer than eight and you miss leaks; far more than fifteen and the dashboard becomes noise nobody acts on. Pick the handful that decide your quarter and review the rest monthly.
What is pipeline coverage ratio and what should it be?
Pipeline coverage is open pipeline value divided by remaining quota. A 3×–4× ratio is typical for an average win rate — you need roughly three to four dollars of qualified pipeline for every dollar of quota. Age the pipeline first so stale opportunities do not overstate coverage.
Do these dashboard templates need a subscription?
No. All eight templates in this guide are one-time purchases between $9.99 and $39.99. You download the file, add your data, and own it — there are no per-seat fees or recurring charges, unlike most sales KPI software.
Which dashboard is best for board reporting?
The Sales & Marketing Stakeholder Reporting KPI Dashboard in Excel ($14.99) is built for it, rolling up CAC, LTV:CAC, pipeline coverage and quota attainment into a board-ready summary. Pair it with the Revenue Command Center for a shareable executive snapshot.
Get more sales KPI templates
Want the whole stack? Start with the Revenue Growth KPI Dashboard in Google Sheets at $9.99 for growth and retention, then add the CRM & Sales Pipeline Management System at $39.99 when you are ready to run and measure the pipeline in one place. Every template is a one-time purchase you own forever.
Browse related guides on supply chain KPIs and inventory KPIs, and subscribe to the NextGenTemplates YouTube channel for walkthroughs of every dashboard.