

The best ServiceNow alternatives for small IT teams in 2026 are focused Excel, Google Sheets and Power BI ITSM templates that cover one job each — help desk ticketing, change management, SLAs and asset tracking — for a one-time $11.99–$19.99 instead of ServiceNow’s $100+ per-user monthly subscription.
Last updated: August 2026
Key takeaways
- ServiceNow does not publish seat pricing; third-party estimates put ITSM Pro around $100+ per user per month with annual minimums that push most contracts past $50,000/year.
- The three reasons small teams churn off ServiceNow are seat cost, paying for unused modules, and the need for a dedicated admin.
- Every template below is a one-time purchase from $11.99 to $19.99 — no seats, no renewals, no admin certification.
- The Change Request Management System V1.0 ($19.99) is the closest single-tool match to ServiceNow’s flagship Change module.
- ServiceNow still wins for large enterprises that need a live CMDB, auto-discovery, and cross-department workflow orchestration — templates replace the reporting layer, not the automation engine.
 Launch offer
SUMIFS, XLOOKUP, FILTER, LAMBDA and checking AI-written formulas, with real business projects. 11h 47m of video by PK, with practice files, quizzes and a capstone.
Why small teams look for a ServiceNow alternative
ServiceNow is the enterprise ITSM standard, but it is priced for the enterprise. The company does not list per-seat prices publicly — the official ServiceNow pricing page routes every request to “Get a quote,” and that opacity is itself a warning sign for a five-person IT team. Independent resellers and analysts consistently report ITSM Professional in the $100+ per user, per month range, with platform minimums that lift a typical annual contract past $50,000–$100,000.
Three things drive small and mid-size teams to switch:
- Seat cost. Every technician, and often every fulfiller, is a paid seat. A team of eight can burn $10,000/year before a single ticket is closed.
- Unused modules. Discovery, Orchestration, HR Service Delivery, and dozens of store apps ship in the platform pitch, but a small team uses a fraction of them — and pays for the rest.
- Admin overhead. ServiceNow realistically needs a certified administrator (or a paid partner) to configure, maintain, and upgrade. That is a salary line, not just a licence.
If your team mostly needs to log tickets, track change requests, watch SLAs, and report on IT performance, a purpose-built spreadsheet template does that job at roughly 0.02% of the annual cost — and you own the file forever.
ServiceNow feature vs the NGT template that covers it
| ServiceNow module | NGT template that covers it | Format | Price |
|---|---|---|---|
| Incident Management / Service Desk | IT Help Desk Dashboard | Excel | $17.99 |
| Change Management | Change Request Management System V1.0 | Excel VBA | $19.99 |
| Service Management & SLA reporting | IT Services Dashboard | Excel | $17.99 |
| Performance Analytics (Incident) | IT Help Desk Dashboard | Power BI | $17.99 |
| Change reporting & adoption | Change Management KPI Dashboard | Excel | $14.99 |
| IT Asset Management (ITAM) | Digital Asset Management KPI Dashboard | Power BI | $11.99 |
ITSM templates compared
| Template | Format | Best for | Price |
|---|---|---|---|
| Change Request Management System V1.0 — Best overall | Excel VBA | Full change-request logging & workflow | $19.99 |
| IT Help Desk Dashboard (Excel) — Best value | Excel | Ticket volume, response & resolution times | $17.99 |
| IT Services Dashboard (Excel) | Excel | SLA compliance & service performance | $17.99 |
| IT Help Desk Dashboard (Power BI) | Power BI | Interactive incident analytics | $17.99 |
| Change Management KPI Dashboard (Excel) | Excel | Change adoption & MTD/YTD tracking | $14.99 |
| IT Services Dashboard (HTML) | HTML | Shareable, browser-based service view | $12.99 |
| Change Management KPI Dashboard (Power BI) | Power BI | Visual change-programme reporting | $11.99 |
| Digital Asset Management KPI Dashboard (Power BI) | Power BI | Asset usage, approvals & storage cost | $11.99 |
How we picked these
We searched the full NextGenTemplates catalog of ITSM and IT operations templates and shortlisted those that map directly onto a real ServiceNow module — incident, change, service/SLA, and asset management. We deliberately excluded generic project trackers and finance dashboards that share IT keywords but do not do ITSM work. Each pick had to be a paid, ready-to-use file with live formulas or a working macro, priced as a one-time purchase, and available in a format a small team already owns (Excel, Google Sheets, Power BI, or HTML). The ranking weights breadth of coverage, depth of the build, and price-to-value.
The 8 best ServiceNow alternative templates for 2026
1. Change Request Management System V1.0 — best overall
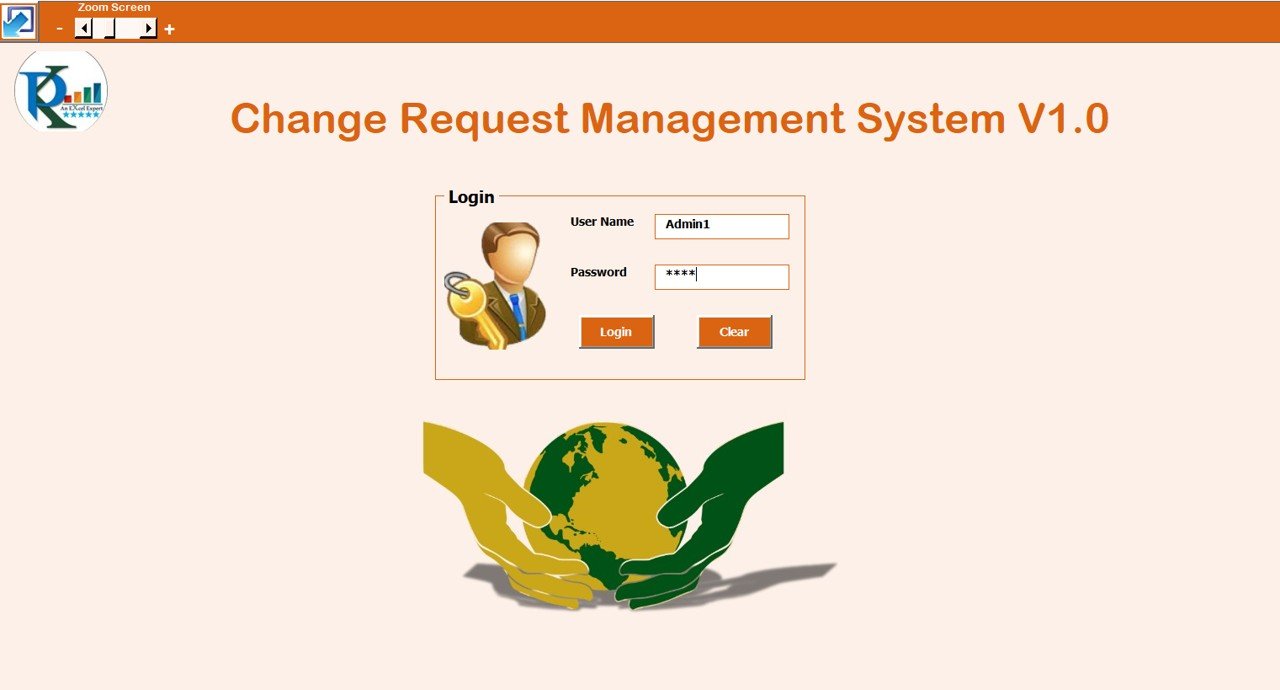
This is the closest single tool to ServiceNow’s flagship Change module, and the reason it ranks first: it is a working Excel VBA system, not just a report. You log change requests, assign owners, move them through statuses, and track progress in real time from one dashboard.
Who it is for: IT leads and change managers who need an auditable change process without a platform subscription.
What is inside:
- Add, update and track change requests through their full lifecycle
- Owner, priority and status assignment per request
- Real-time progress dashboard with counts by stage
- Structured record-keeping for accountability and audit
Use it to run a weekly CAB meeting off a single sheet, prove who approved what, cut change-related outages by catching collisions early, and hand auditors a clean trail. Price: $19.99. Get the Change Request Management System »
Best for: teams that want ServiceNow’s change discipline in a file they own outright.
2. IT Help Desk Dashboard in Excel — best value
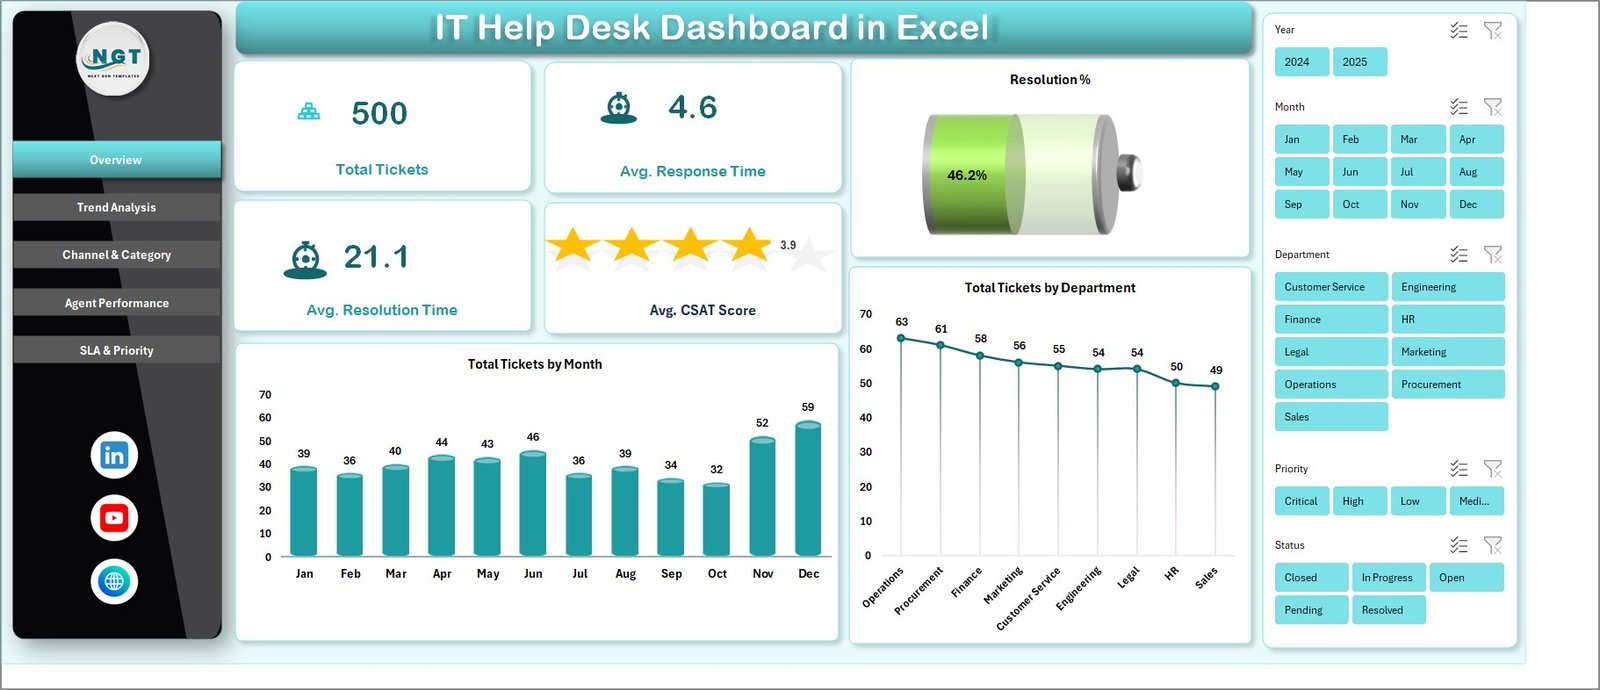
The single most-used ServiceNow feature is the service desk, and this dashboard replaces its reporting layer directly. It tracks total requests, average response time, average resolution time, customer ratings and closed requests — the exact metrics a ServiceNow Performance Analytics tile would show.
Who it is for: help desk leads who live in ticket queues and need weekly reporting without a licence.
What is inside:
- KPI cards for total, open and closed requests
- Average response and resolution time tracking
- Customer satisfaction rating roll-up
- Tickets by department and trend-over-time charts
At $17.99 one-time versus roughly $100/user/month, a two-person help desk recovers the cost in under a day of what ServiceNow would bill. It is also available in Power BI and Google Sheets if you prefer those. Price: $17.99. Get the IT Help Desk Dashboard »
Best for: the fastest, cheapest replacement for ServiceNow incident reporting.
3. IT Services Dashboard in Excel
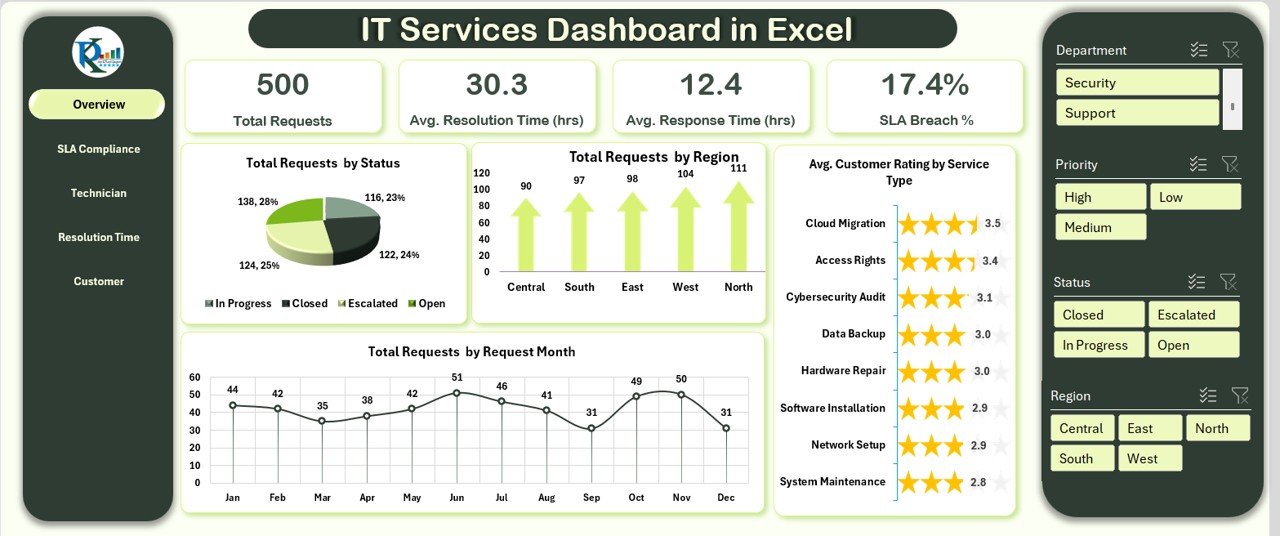
Where the help desk dashboard is about ticket volume, this one is about service quality and SLAs — the layer ServiceNow charges most for. It analyses response time, resolution time, customer ratings and SLA compliance across your services.
Who it is for: service managers reporting to the business on whether IT is hitting its commitments.
What is inside:
- SLA compliance tracking by service
- Response and resolution time analysis pages
- Customer rating and satisfaction views
- Closed-request and workload breakdowns
Use it to defend the IT budget with hard SLA numbers, spot the one service dragging your compliance rate down, and show month-on-month improvement. Available in Power BI and Google Sheets too. Price: $17.99. Get the IT Services Dashboard »
Best for: SLA and service-quality reporting without an enterprise contract.
4. IT Help Desk Dashboard in Power BI
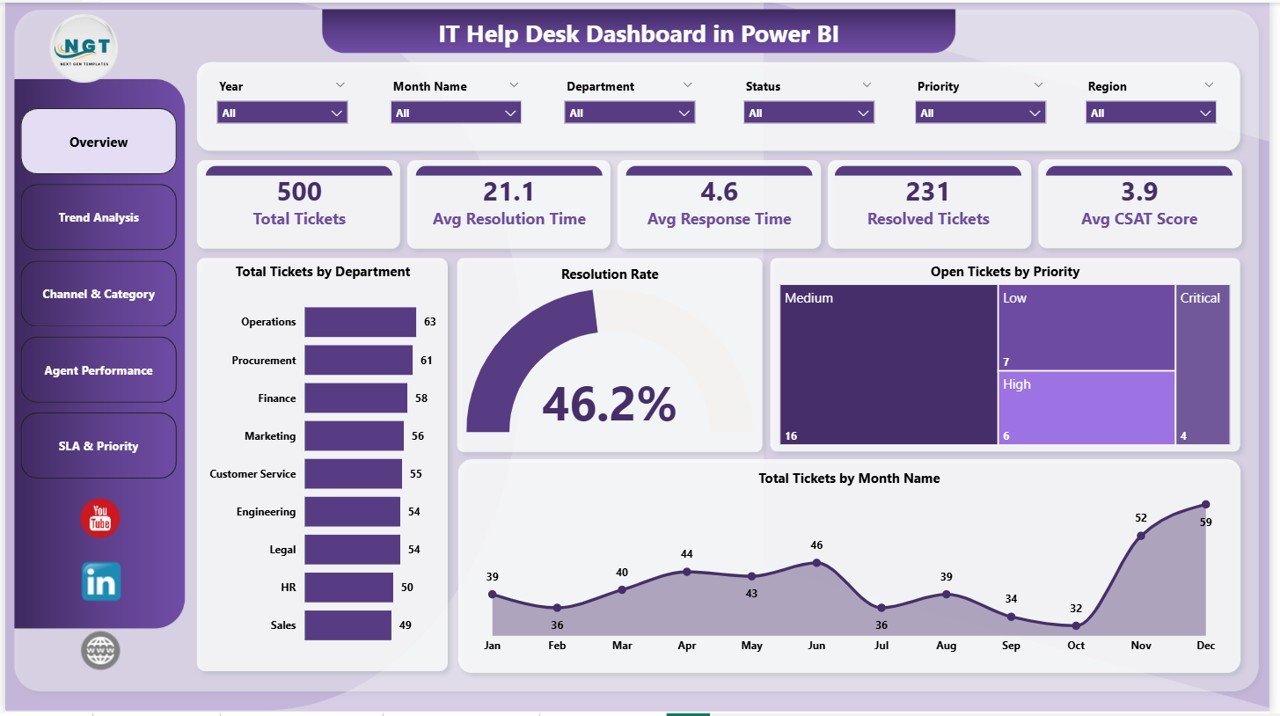
If your organisation already runs Microsoft 365, Power BI gives you the interactive, drill-through experience people associate with ServiceNow dashboards — for a one-time $17.99 rather than a per-seat platform fee.
Who it is for: teams standardised on Power BI who want incident analytics they can slice by agent, priority and time.
What is inside:
- Interactive filters by department, priority and date
- Response and resolution KPI cards with trends
- Ticket-ageing and backlog visuals
- Refreshable model — point it at your export and reload
Publish it to your Power BI workspace and the whole leadership team reads live help desk numbers without touching a ServiceNow seat. Price: $17.99. Get the Power BI Help Desk Dashboard »
Best for: Microsoft-shop teams that want shareable, interactive incident reporting.
5. Change Management KPI Dashboard in Excel
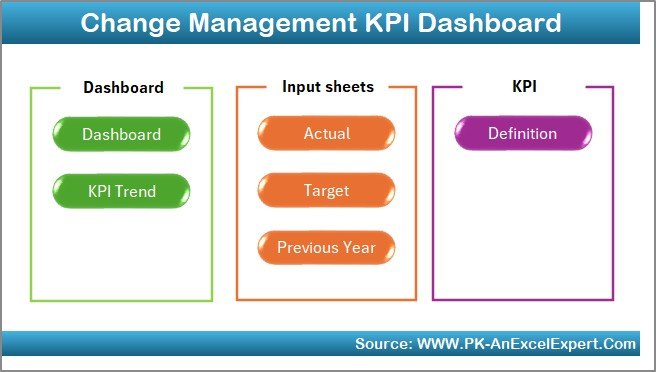
Pair this with the Change Request Management System and you have ServiceNow’s change reporting covered end to end. It tracks change adoption, training and communication with month-to-date and year-to-date views and a month selector.
Who it is for: change managers running a transformation programme who report progress upward.
What is inside:
- Interactive month selector that refreshes every KPI
- MTD, YTD and prior-year comparison
- Trend charts for adoption, training and communication
- Built-in KPI definitions so stakeholders read it correctly
Use it to prove a rollout is landing, catch a training gap before go-live, and give the steering committee one honest number per KPI. Price: $14.99. Get the Change Management KPI Dashboard »
Best for: reporting on the human side of change — adoption, not just tickets.
6. IT Services Dashboard in HTML
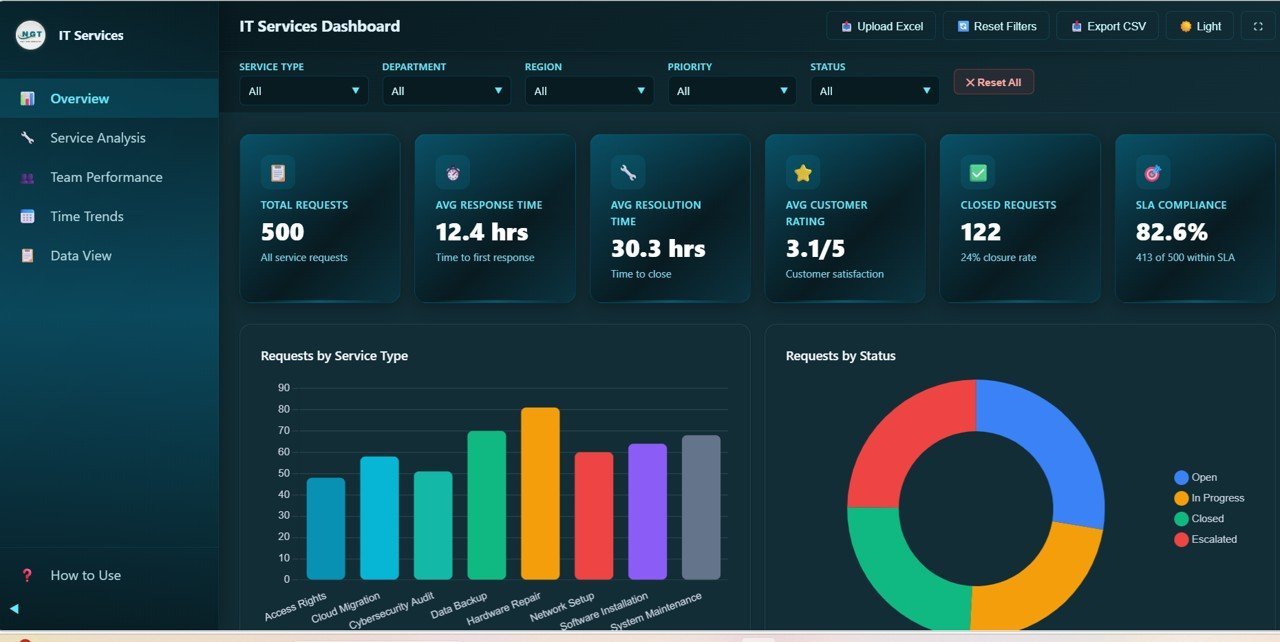
The HTML edition solves a specific ServiceNow pain: sharing a live view with people who do not have a licence. It opens in any browser — no Excel, no Power BI, no login — making it ideal for a wall-mounted NOC screen or an exec who just wants the numbers.
Who it is for: teams that need a read-only service dashboard anyone can open.
What is inside:
- Interactive overview: total requests, response/resolution times, SLA compliance
- Service analysis page for deeper breakdowns
- Customer rating and closed-request views
- Runs in any browser, no software install
Drop it on a shared screen or an internal page and everyone sees the same service numbers, updated on your terms. Price: $12.99. Get the HTML IT Services Dashboard »
Best for: licence-free sharing of live service metrics.
7. Change Management KPI Dashboard in Power BI
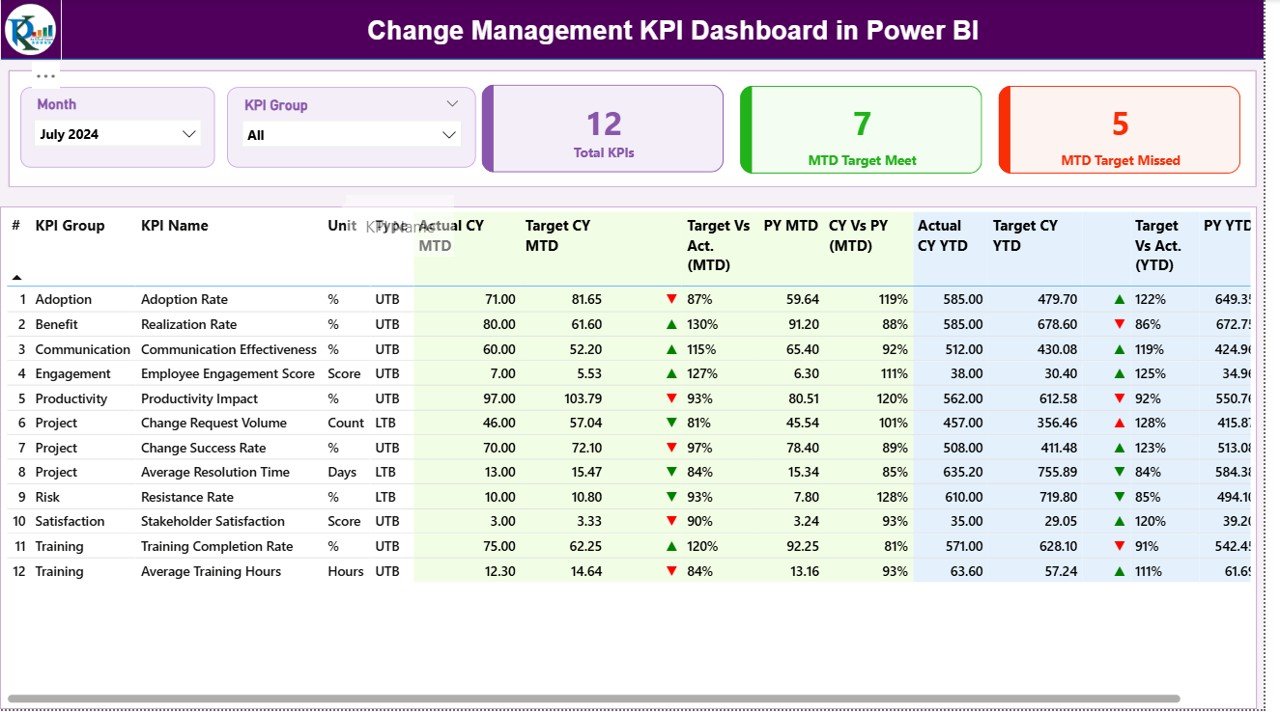
The Power BI edition of the change dashboard, for teams that prefer live, filterable visuals over a spreadsheet. At $11.99 it is the cheapest way to give leadership an interactive view of a change programme.
Who it is for: PMOs and change leads embedded in a Power BI reporting stack.
What is inside:
- Real-time change-programme KPI tracking
- Interactive slicers for period and workstream
- Adoption and transformation-result visuals
- Refreshable model for repeatable monthly reporting
Use it when the same change story needs to reach ten stakeholders who each want to filter it their own way. Price: $11.99. Get the Power BI Change Dashboard »
Best for: interactive change reporting on a tight budget.
8. Digital Asset Management KPI Dashboard in Power BI
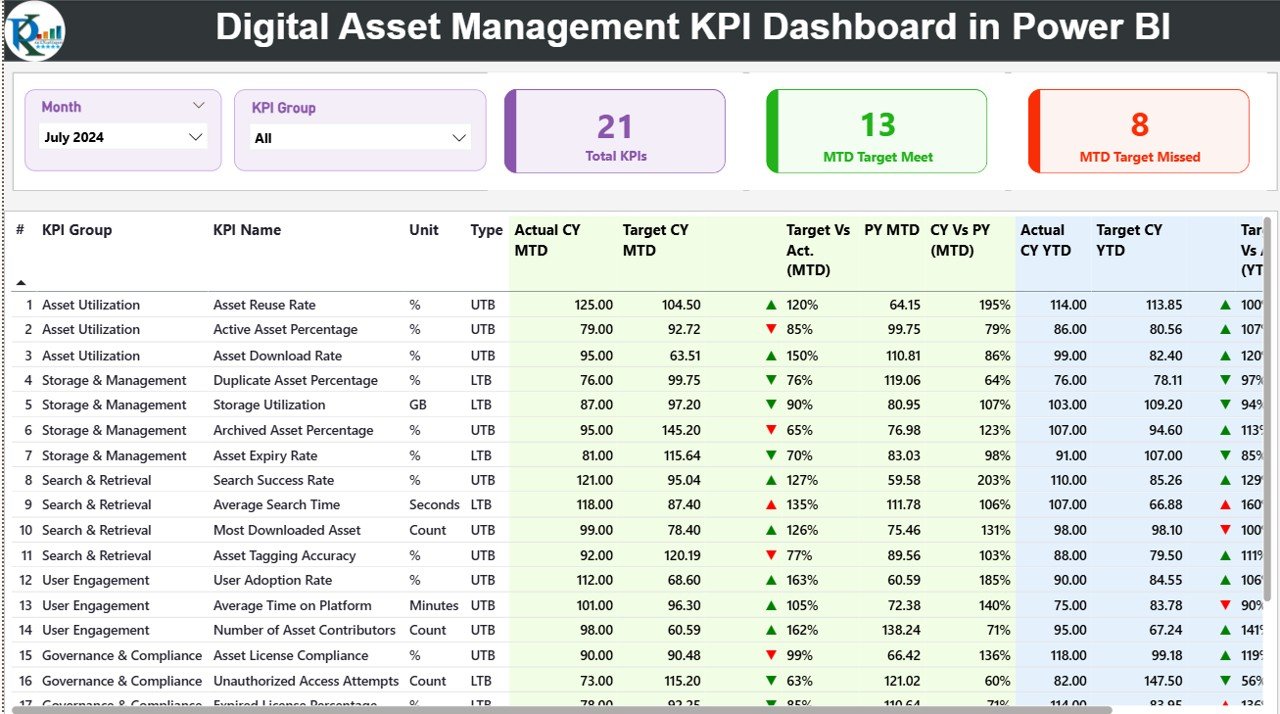
ServiceNow’s IT Asset Management is a paid add-on many teams never fully use. This dashboard covers the reporting side of asset management — approvals, metadata accuracy, asset usage, and storage cost — for a one-time $11.99.
Who it is for: teams that need visibility over their asset estate without buying an ITAM module.
What is inside:
- Asset usage and performance views
- Approval workflow and metadata-accuracy tracking
- Storage-cost monitoring
- Interactive filters across the asset library
Use it to find under-used assets you are paying to store, tighten approval hygiene, and report asset cost to finance. Price: $11.99. Get the Digital Asset Management Dashboard »
Best for: asset-cost and usage reporting without an ITAM subscription.
ServiceNow vs templates: the three-year cost math
Put real numbers on the switch. Take a small IT team of eight technicians and a reported ServiceNow ITSM Professional rate of $100 per user per month — a conservative figure, since many contracts sit higher once platform minimums are added.
| Cost line | ServiceNow (8 users) | NGT templates |
|---|---|---|
| Licence / purchase | $800 / month | 4 templates × ~$16 = ~$65 one-time |
| Year 1 | $9,600 | ~$65 |
| Admin / configuration | Certified admin time or partner fees | None — anyone who knows Excel runs it |
| Three-year total | ~$28,800+ (before uplifts) | ~$65, owned forever |
Even at the lowest reported rate and ignoring the near-certain annual price uplift, the platform costs roughly 440 times the template stack over three years. Add the dedicated-admin salary ServiceNow realistically needs and the gap widens further. The trade-off is real — you give up automation and a live CMDB — but for a team using ServiceNow mainly to log tickets and report KPIs, that is a lot of money for a reporting layer a $17.99 dashboard reproduces. This is exactly why the honest limits below matter: buy the platform for what only a platform can do, not for dashboards.
How to choose between them
Pick by the job you need done first, then add formats as your team grows:
- Drowning in tickets? Start with the IT Help Desk Dashboard.
- Change process is chaos? Buy the Change Request Management System for the workflow and the Change Management KPI Dashboard for the reporting.
- Getting grilled on SLAs? The IT Services Dashboard is your answer.
- Need to share without licences? Use the HTML edition on a shared screen.
- Standardised on Power BI? Take the Power BI variants and publish once to your workspace.
Most small teams end up owning three or four of these — the total is still under $70 one-time, versus a five-figure annual ServiceNow contract.
When ServiceNow is still the right call
These templates are honest replacements for ITSM reporting and lightweight workflow — they are not a platform, and it would be unfair to pretend otherwise. Stay on ServiceNow (or move to it) when:
- You need a live CMDB with auto-discovery. Templates track assets you enter by hand; they do not scan your network or maintain dependency maps.
- You run cross-department workflow automation. ServiceNow orchestrates approvals across IT, HR, facilities and finance with SLAs and escalation. A spreadsheet cannot route work between teams automatically.
- You have 50+ agents or strict compliance. Concurrent editing, role-based access, and audited change control at that scale need a real platform database, not a shared file.
- You need a self-service portal and virtual agent. End-user ticket submission, knowledge base and chatbot deflection are core ServiceNow strengths a template does not attempt.
The honest line: if a dedicated ServiceNow admin is already worth their salary to you, keep the platform. If you are a small team using 10% of it and paying for 100%, the templates above cover the part you actually touch.
Frequently asked questions
How much does ServiceNow cost per user?
ServiceNow does not publish per-user pricing; access is quote-only through its sales team. Independent resellers and analysts commonly report ITSM Professional around $100 or more per user per month, with platform minimums that push most annual contracts past $50,000. The opaque pricing is one reason small teams look elsewhere.
What is the best free or cheap ServiceNow alternative?
For the reporting and lightweight-workflow layer, one-time templates are the cheapest credible option. The IT Help Desk Dashboard in Excel ($17.99) replaces ServiceNow’s incident reporting, and the Change Request Management System ($19.99) covers change logging — together under $40 once, versus thousands per year.
Can Excel really replace ServiceNow?
Excel replaces the parts most small teams actually use: ticket tracking, SLA reporting, change logs and IT KPIs. It does not replace auto-discovery, a live CMDB, cross-department orchestration or a self-service portal. For a team of under 20 using ServiceNow mainly for dashboards and records, Excel covers the real workload.
Which ServiceNow modules do these templates cover?
They map to Incident Management (IT Help Desk Dashboard), Change Management (Change Request Management System and Change KPI dashboards), Service Management and SLAs (IT Services Dashboard), and IT Asset Management (Digital Asset Management KPI Dashboard). Performance Analytics is covered by every dashboard’s KPI views.
Do these templates work in Google Sheets?
Several do. The IT Help Desk Dashboard and IT Services Dashboard both have Google Sheets editions, so cloud-first teams can collaborate in real time without Microsoft licences. The change and asset dashboards are offered in Excel and Power BI.
Is a one-time template cheaper than ServiceNow over three years?
Dramatically. Four templates cost roughly $65 once and are yours forever. A ServiceNow ITSM contract at reported rates runs tens of thousands per year, so over three years you are comparing under $70 with a six-figure total. The break-even is measured in days, not months.
Will I lose my data if I switch off ServiceNow?
Export your incident, change and asset records to CSV before your contract ends, then paste them into the matching template. Because the templates are plain Excel, Sheets or Power BI files, your data stays in formats you control — no vendor lock-in and no migration fee.
Do the templates need a ServiceNow admin to run?
No. That is the point. There is no platform to configure, no upgrade cycle and no certification. If someone on your team can use Excel, Google Sheets or Power BI, they can run these on day one — which removes the dedicated-admin cost that makes ServiceNow expensive for small teams.
Can I customise the templates for my own KPIs?
Yes. Every file is unlocked — edit formulas, add columns, rename KPIs and re-theme colours to match your brand. The Change Request Management System even ships with editable VBA. You own the file, so you can adapt it as your process changes without asking a vendor.
Get more ITSM templates
Building an IT operations stack? Owning three or four of these dashboards still costs less than one month of a single ServiceNow seat — and there are no renewals. Start with the IT Help Desk Dashboard ($17.99) and the Change Request Management System ($19.99), then add SLA and asset reporting as you go.
Prefer a switcher guide for another tool? See our Salesforce alternatives, Zoho CRM alternatives, Domo alternatives, Xero alternatives and BambooHR alternatives roundups.
Watch template walkthroughs on the NextGenTemplates YouTube channel to see each dashboard in action before you buy.