

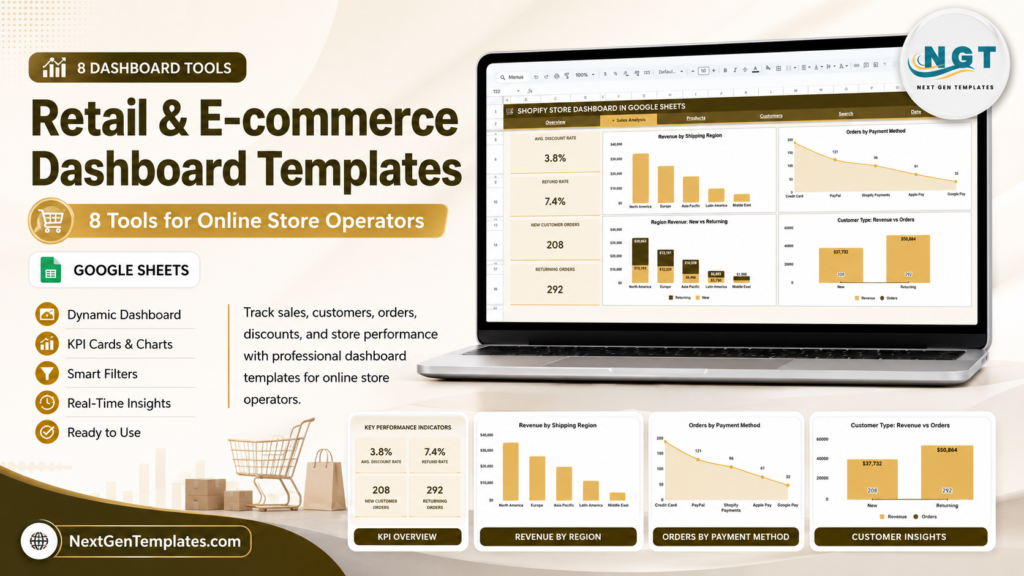
Retail & E-commerce Dashboard Templates help online store operators turn order exports, sales data, product performance, customer behavior, and channel results into clear daily decisions. If you manage Shopify orders, marketplace sales, dropshipping ads, subscriptions, product reviews, or KPI reporting, the right template can save hours of manual reporting each week.
The need is real. According to the U.S. Census Bureau’s Quarterly Retail E-Commerce Sales report for Q1 2026, adjusted U.S. retail e-commerce sales reached $326.7 billion and accounted for 16.9% of total retail sales. That level of online sales activity makes clean KPI tracking more than a nice-to-have. It is a practical operating system for store owners, marketers, analysts, and finance teams.
Quick Recommendation
For most Shopify store operators, start with the Shopify Store Dashboard in Google Sheets if you want fast cloud collaboration, the Shopify Store Dashboard in Excel if your team lives in Excel, or the Shopify Store Dashboard in Power BI if you want richer BI visuals for leadership reporting.Retail & E-commerce Dashboard Templates
 Launch offer
From your first Pivot Table to the Data Model, DAX, Power Query and a one-page KPI dashboard. 11h 51m of video by PK, with practice files, quizzes and a capstone.
How to Choose the Right Retail & E-commerce Dashboard Templates
Choose by workflow first, then platform. Shopify teams usually need order, product, customer, discount, fulfillment, and revenue tracking. Marketplace sellers need platform comparisons across Amazon, eBay, Walmart, Etsy, Flipkart, Shopify, and similar channels. Dropshipping teams need ad spend, ROAS, supplier, and profit visibility. Subscription sellers need recurring revenue, boxes shipped, and active subscription metrics. Review-focused teams need rating trends and complaint visibility.Retail & E-commerce Dashboard Templates
Platform also matters. Google Sheets is best for cloud collaboration and shared reporting. Excel is best for offline work, pivot-table analysis, and one-time purchase templates. Power BI is best when you want a polished management dashboard with interactive visuals. Shopify also documents built-in sales reporting and export workflows through its sales reports and order export guidance, so these templates fit naturally into the way many stores already pull reporting data.Retail & E-commerce Dashboard Templates
Quick Comparison: 8 Tools for Online Store Operators
| Template | Platform | Best For | Sale Price |
|---|---|---|---|
| Shopify Store Dashboard in Google Sheets | Google Sheets | Collaborative Shopify sales reporting | $9.99 |
| Shopify Store Dashboard in Power BI | Power BI | Executive Shopify analytics | $17.99 |
| Shopify Store Dashboard in Excel | Excel | Pivot-based Shopify reporting | $17.99 |
| E-commerce KPI Scorecard In Google Sheets | Google Sheets | Monthly, MTD, and YTD KPI review | $12.99 |
| Dropshipping Dashboard in Excel | Excel | Ad spend, supplier, and margin tracking | $17.99 |
| Subscription Box Dashboard in Google Sheets | Google Sheets | Subscription revenue and shipment tracking | $9.99 |
| Product Reviews and Ratings KPI Dashboard in Google Sheets | Google Sheets | Review quality, ratings, and complaint patterns | $8.99 |
| Online Marketplaces Dashboard in Excel | Excel | Amazon, eBay, Walmart, Etsy, and multi-channel sellers | $13.99 |
1. Shopify Store Dashboard in Google Sheets
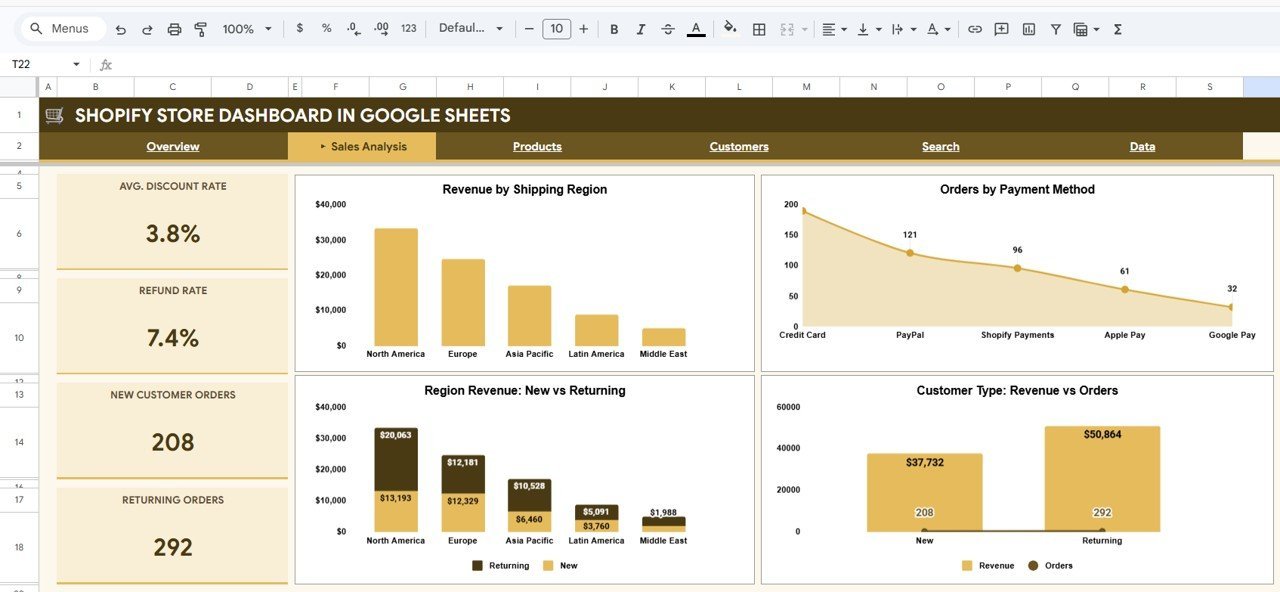
The Shopify Store Dashboard in Google Sheets is the best first choice for store owners who want shared reporting without desktop software. It includes six tabs: Overview, Sales Analysis, Products, Customers, Search, and Data. KPI cards track Total Net Revenue, Total Orders, Average Order Value, Total Units Sold, and Total Discounts.Retail & E-commerce Dashboard Templates
Use it when your team wants to paste Shopify export data, filter by product category or sales channel, and review customer or product trends in the cloud. It is especially useful for small Shopify teams, agencies managing client stores, and founders who want a clean reporting file in Google Drive.Retail & E-commerce Dashboard Templates
View Shopify Google Sheets Dashboard
2. Shopify Store Dashboard in Power BI
The Shopify Store Dashboard in Power BI is built for deeper analysis and polished management reporting. It includes five report pages covering Overview, Sales Analysis, Product Insights, Channel Performance, and Order Fulfillment. KPI cards cover Total Orders, Total Revenue, Total Cost, Average Order Value, and Profit Margin %.Retail & E-commerce Dashboard Templates
Choose this when you want slicers, multi-page visuals, and dashboard-style storytelling for managers. Microsoft describes Power BI Desktop as a tool for connecting to data, shaping it, and building visual reports, which is exactly the workflow this template supports for Shopify performance data.Retail & E-commerce Dashboard Templates
View Shopify Power BI Dashboard
3. Shopify Store Dashboard in Excel
The Shopify Store Dashboard in Excel is ideal for operators who prefer Excel pivot tables, slicers, and offline reporting. It has five dashboard pages plus Data and Support sheets, with KPI cards for Total Records, Total Revenue, Total Cost, Average Order Value, and Profit Margin %.Retail & E-commerce Dashboard Templates
This is a strong fit for analysts and finance teams who already clean data in Excel and want a one-time template instead of another subscription. It is also helpful when you need a file that can be adapted for monthly reporting packs.Retail & E-commerce Dashboard Templates
4. E-commerce KPI Scorecard In Google Sheets
The E-commerce KPI Scorecard In Google Sheets is a compact scorecard for operators who need target tracking rather than a broad sales dashboard. It includes four worksheets: Scorecard, KPI Trend, Input Data, and KPI Definition.
Use this for monthly, MTD, and YTD KPI reporting. The scorecard supports actual vs target comparisons, trend charts, and KPI definitions, making it useful for leadership reviews and team alignment.
5. Dropshipping Dashboard in Excel
The Dropshipping Dashboard in Excel is made for stores where advertising spend, supplier performance, order volume, and margin control decide profitability. It tracks KPI cards such as Total Revenue, Net Profit, Orders, Ad Spend, and Average Order Value.Retail & E-commerce Dashboard Templates
This is the right choice when you need to understand ROAS, product performance, fulfillment issues, and supplier trends from one workbook. Dropshipping margins can move quickly, so a dashboard that compares ad spend against revenue and profit is valuable.Retail & E-commerce Dashboard Templates
6. Subscription Box Dashboard in Google Sheets
The Subscription Box Dashboard in Google Sheets is for recurring-commerce teams that need visibility into revenue, boxes shipped, active subscriptions, and average order value. It includes analysis pages, charts, slicers, and a data sheet for store reporting.
It works well for subscription brands that need recurring revenue and fulfillment visibility without building a custom BI stack. Teams can collaborate in Google Sheets and refresh reporting from their exported data.
View Subscription Box Dashboard
7. Product Reviews and Ratings KPI Dashboard in Google Sheets
The Product Reviews and Ratings KPI Dashboard in Google Sheets helps store teams track the customer experience signals that often sit outside standard sales reports. It focuses on review quality, star ratings, complaint patterns, response performance, and satisfaction KPIs.
This dashboard is a good fit for ecommerce brands with review-driven conversion. If ratings fall, return complaints rise, or support response metrics slip, the template gives teams a structured place to track and act.
View Reviews and Ratings Dashboard
8. Online Marketplaces Dashboard in Excel
The Online Marketplaces Dashboard in Excel is designed for sellers working across multiple platforms such as Amazon, eBay, Walmart, Etsy, Flipkart, and Shopify. It tracks orders, returns, ratings, revenue, costs, profit, marketplaces, regions, categories, and fulfillment types.Retail & E-commerce Dashboard Templates
This is the best fit when your biggest reporting problem is fragmentation. Instead of checking each marketplace portal separately, you can combine data into one Excel dashboard and compare performance by channel, category, and region.
View Online Marketplaces Dashboard
Platform Fit: Google Sheets vs Excel vs Power BI
Google Sheets is best when multiple people need access and the dashboard should live in the cloud. Excel is best for teams that want familiar pivot-table workflows, offline files, and one-time template purchases. Power BI is best for operators who want richer visuals, a more formal analytics workflow, and dashboard-style reporting for managers.
Best Practices for Store Dashboard Reporting
- Keep exported data consistent: use the same column names and date formats every time you update the template.
- Separate input data from reporting: avoid editing dashboard formulas or chart sheets when only the raw data needs updating.
- Review weekly and monthly: daily dashboards help operations, while monthly summaries help strategy.
- Track targets, not just actuals: KPI scorecards are more useful when actual performance is compared with targets and previous periods.
- Use channel filters: online stores often hide problems when all sales channels are blended together.Retail & E-commerce Dashboard Templates
Frequently Asked Questions
What are retail and e-commerce dashboard templates?
Retail and e-commerce dashboard templates are prebuilt reporting files that convert sales, orders, customer, product, marketing, and operations data into charts, KPI cards, and scorecards.Retail & E-commerce Dashboard Templates
Which template is best for Shopify store reporting?
For cloud reporting, choose Shopify Store Dashboard in Google Sheets. For offline Excel work, choose Shopify Store Dashboard in Excel. For more advanced visual reporting, choose Shopify Store Dashboard in Power BI.Retail & E-commerce Dashboard Templates
Do these templates replace Shopify analytics?
They do not replace Shopify analytics. They complement it by giving you a reusable reporting workspace where exported Shopify data can be combined, filtered, and presented for team reviews.
Which template is best for marketplace sellers?
Online Marketplaces Dashboard in Excel is the best option for sellers who need to compare Amazon, eBay, Walmart, Etsy, Flipkart, Shopify, and other marketplaces in one workbook.Retail & E-commerce Dashboard Templates
Are these paid templates?
Yes. The tools in this roundup are paid NextGenTemplates products built for serious store operators who want ready-to-use dashboards instead of building reports from scratch.Retail & E-commerce Dashboard Templates
About the Author
Built by PK – Microsoft Certified Professional with 15+ years of Excel, Google Sheets, and Power BI experience. Founder of NextGenTemplates, reaching 300K+ subscribers across YouTube channels. Every template is hand-built and tested before release.Retail & E-commerce Dashboard Templates
For the underlying metrics these dashboards report, see our explainer on the 12 retail KPIs to track in 2026 — each with its exact formula and a realistic benchmark range.
Conclusion
The best dashboard is the one your team will actually update and review. If you need collaborative Shopify reporting, start with the Google Sheets version. If your team is Excel-first, use the Excel dashboards for Shopify, dropshipping, or marketplaces. If leadership wants richer visuals, use the Power BI Shopify dashboard.Retail & E-commerce Dashboard Templates
Running a grocery store or supermarket specifically? See our 8 best supermarket & grocery dashboard templates for sales, shrinkage and footfall tracking.
Selling consumer electronics instead? See our 6 best consumer electronics retail templates for store, category and region dashboards built for electronics retailers.
For video tutorials and product walkthroughs, visit https://www.youtube.com/@NextGenTemplates.