

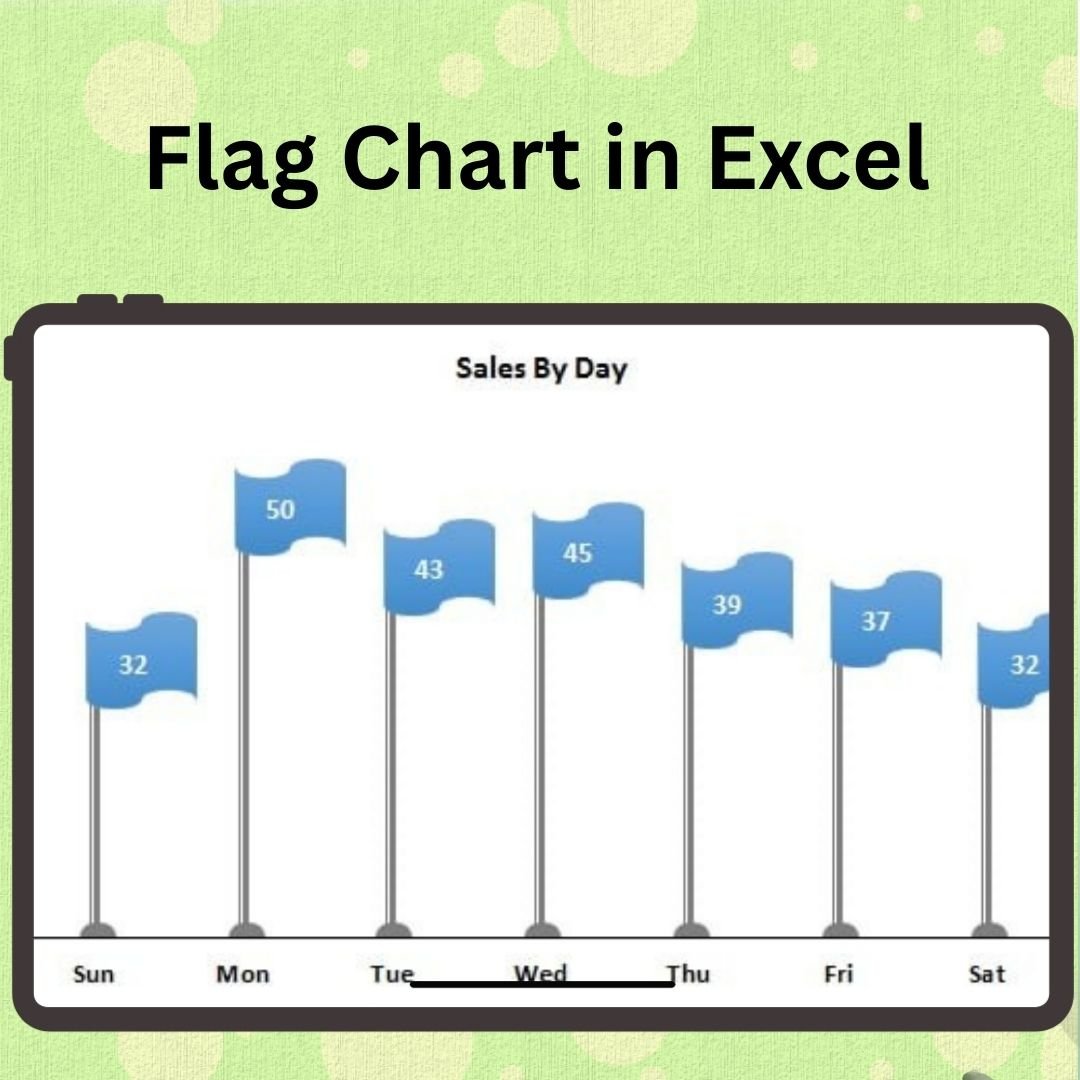

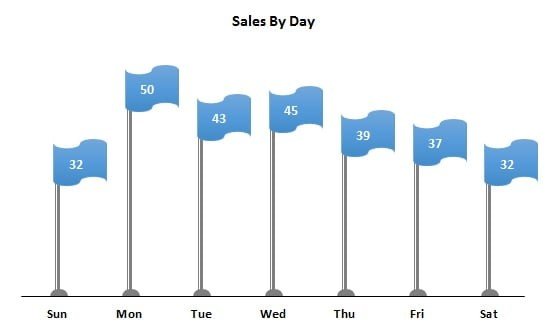
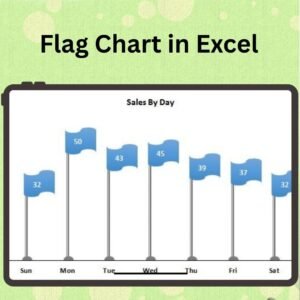
The Info-Graphics Flag Chart in Excel is a visually engaging tool that allows you to display data trends and categories in a dynamic, colorful flag chart format. This chart is perfect for businesses, marketers, and analysts who need to present data with a touch of creativity and style. The flag chart provides a clear, easy-to-understand visual representation of key metrics, helping you communicate data trends, project statuses, and performance results effectively.
Using Excel’s built-in charting capabilities, this tool allows you to transform traditional bar charts into flag-shaped visuals, making your reports and presentations stand out. Whether you’re tracking sales, project progress, or any other key metric, the flag chart adds both functionality and aesthetic appeal to your Excel dashboards and reports.
Key Features of the Info-Graphics Flag Chart in Excel:
🎨 Creative Flag Design
Convert standard bar charts into eye-catching flag-shaped graphics to make your data presentation more engaging and memorable.
📊 Clear Data Representation
Visually represent data trends, performance results, or categories with flags that make it easy to interpret data at a glance.
📈 Customizable Colors and Sizes
Tailor the chart’s colors, flag sizes, and layout to fit your branding or presentation style.
🔄 Dynamic Data Updates
As you update or change the data in your worksheet, the flag chart automatically adjusts, ensuring real-time visualization of your key metrics.
📅 Ideal for Reports and Dashboards
Perfect for project tracking, sales reports, KPI visualization, and other types of data analysis where creative, colorful presentation matters.
Why You’ll Love the Info-Graphics Flag Chart in Excel:
✅ Visual Appeal – Create stunning, colorful flag charts that make your data stand out in reports and dashboards. ✅ Easy to Understand – The flag design helps simplify complex data trends, making it easier for stakeholders to interpret key metrics. ✅ Customizable – Adjust the colors, layout, and design to match your specific project, brand, or reporting style. ✅ Real-Time Data Integration – The chart automatically updates as you enter or modify your data, ensuring up-to-date information in every presentation. ✅ Engage Your Audience – Present your data in a visually captivating way that grabs attention and keeps your audience engaged.
What’s Inside the Info-Graphics Flag Chart in Excel:
- Creative Flag Chart – A visually appealing, flag-shaped bar chart to represent your data.
- Customizable Design – Tailor the flag colors, sizes, and chart layout to fit your specific needs and branding.
- Real-Time Data Updates – The chart dynamically updates as data changes, reflecting the latest insights in your reports.
- User-Friendly Setup – Easy to integrate into existing Excel reports or dashboards, with no advanced Excel skills required.
How to Use the Info-Graphics Flag Chart in Excel:
1️⃣ Download the Template – Get access to the Excel file instantly after purchase. 2️⃣ Input Your Data – Enter the data you want to visualize into the provided Excel sheet. 3️⃣ Customize the Flags – Adjust the flag colors, sizes, and layout to match your needs. 4️⃣ Visualize and Analyze – Watch the chart update automatically as you modify your data, providing real-time insights into your key metrics. 5️⃣ Present and Share – Use the flag chart in presentations, reports, or dashboards to communicate your data effectively.
Who Can Benefit from the Info-Graphics Flag Chart in Excel:
- Data Analysts
- Business Analysts
- Project Managers
- Sales Teams
- Marketing Teams
- Anyone who needs to present data trends or KPIs in a visually appealing way
The Info-Graphics Flag Chart in Excel is a perfect tool for anyone who wants to transform boring, standard bar charts into visually striking flag charts that make your data easy to understand and more engaging for your audience. Whether you’re working on a sales report, project update, or KPI dashboard, this tool will enhance your presentation and make data visualization more fun and effective.
Click here to read the Detailed blog post
https://www.pk-anexcelexpert.com/info-graphics-flag-chart-in-excel/
Visit our YouTube channel to learn step-by-step video tutorials
Watch the step-by-step video tutorial:
Compatibility and Requirements
- Works in Microsoft Excel desktop (Excel 2016 or later, or Microsoft 365).
- You can change colors, sizes and labels with standard Excel chart tools. Microsoft explains them in Create a chart from start to finish.
Frequently Asked Questions
What is a flag chart?
It is a bar chart drawn as flag shapes, so data trends, project statuses and results are easy to read at a glance.
Does the chart update when my data changes?
Yes. The flag chart adjusts automatically when you update the data in the worksheet.
Can I change the colors and flag sizes?
Yes. You can change the flag colors, sizes and layout to fit your branding or presentation style.
Where can I use it?
In sales reports, project updates, KPI dashboards and presentations.
Related Excel Infographic Charts
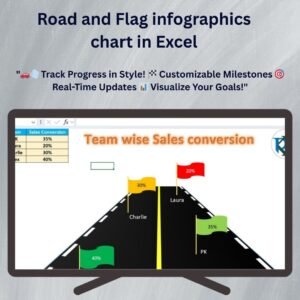
- Road and Flag Infographics Chart in Excel: another flag-style infographic
- Comparison Infographics in Excel: compare two sets of values visually
- Sales Funnel Infographic Chart in Excel: show each stage of a funnel
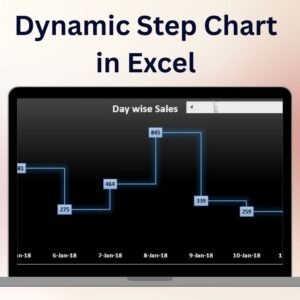
- Dynamic Step Chart in Excel: show changes at set intervals
- Data Analyst’s Chart & Visualization Pack: 10 chart templates in one download
Browse all Excel charts and visualizations or the Excel dashboards.






Reviews
There are no reviews yet.