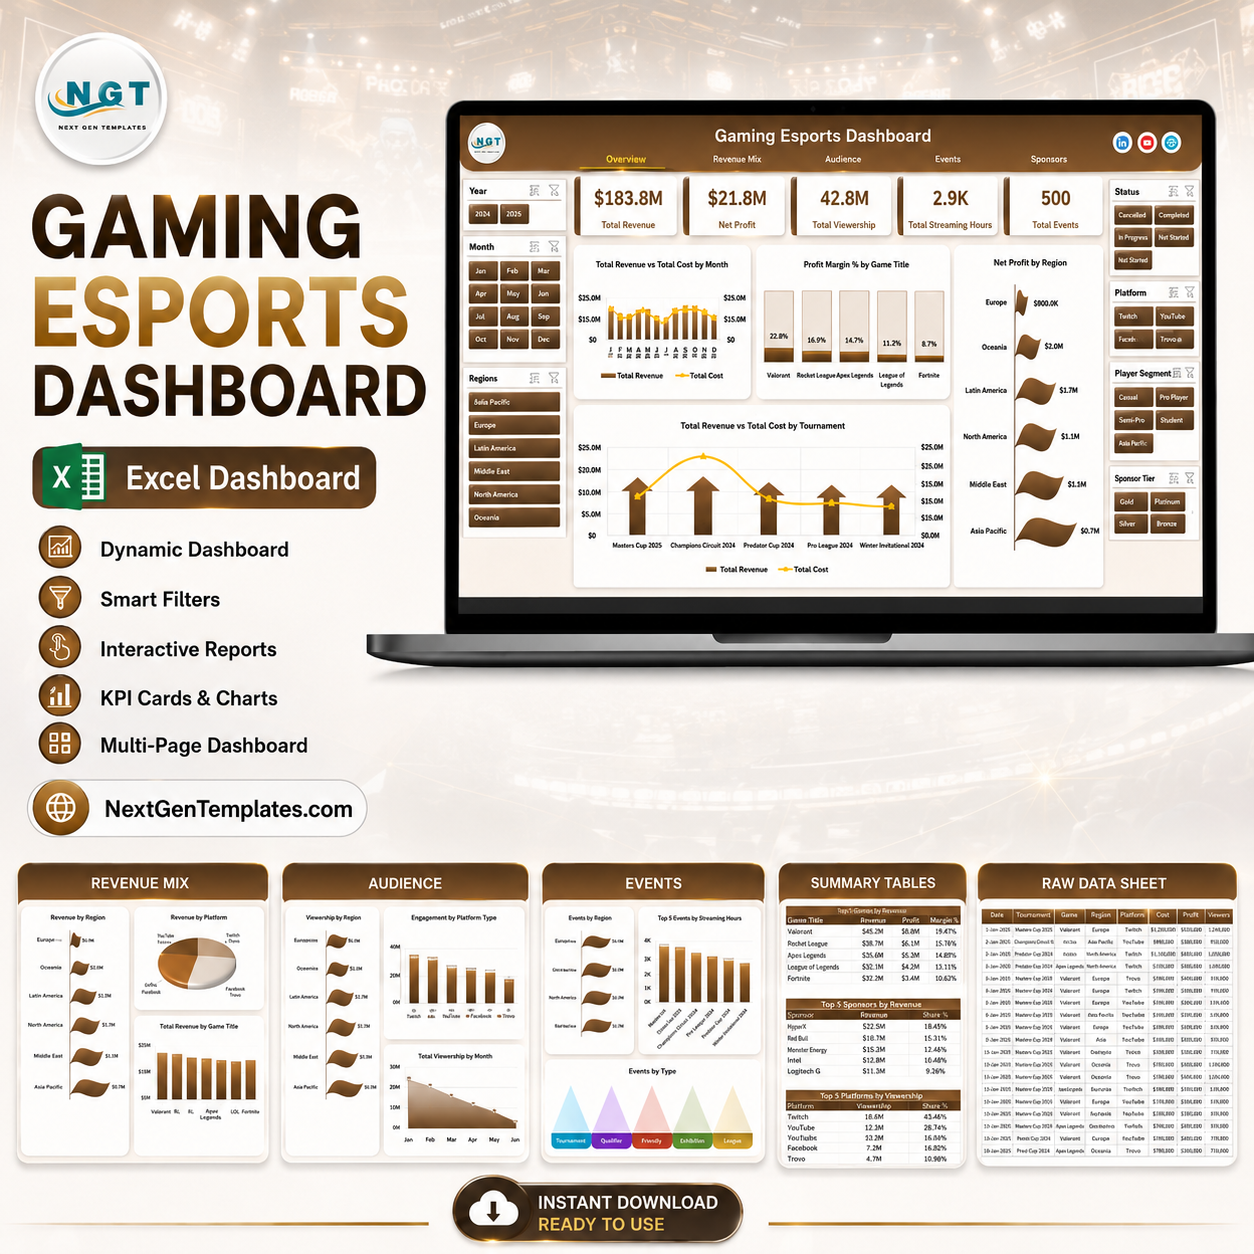


Esports revenue is now tracked across sponsorships, streaming platforms, tournaments, regions, player segments, and game titles, but many teams still prepare weekly reports manually in Excel. The Gaming Esports Dashboard in Excel gives you a ready-to-use workbook with 5 analytical dashboard pages, 5 headline KPI cards, 17 chart views, slicers, a structured data sheet, and a pivot-powered support sheet. It is built for one-time purchase use, with no subscription, no per-user fee, and a clear refresh workflow after you replace the sample data.
Gaming Esports Dashboard in Excel
Key Features of Gaming Esports Dashboard in Excel
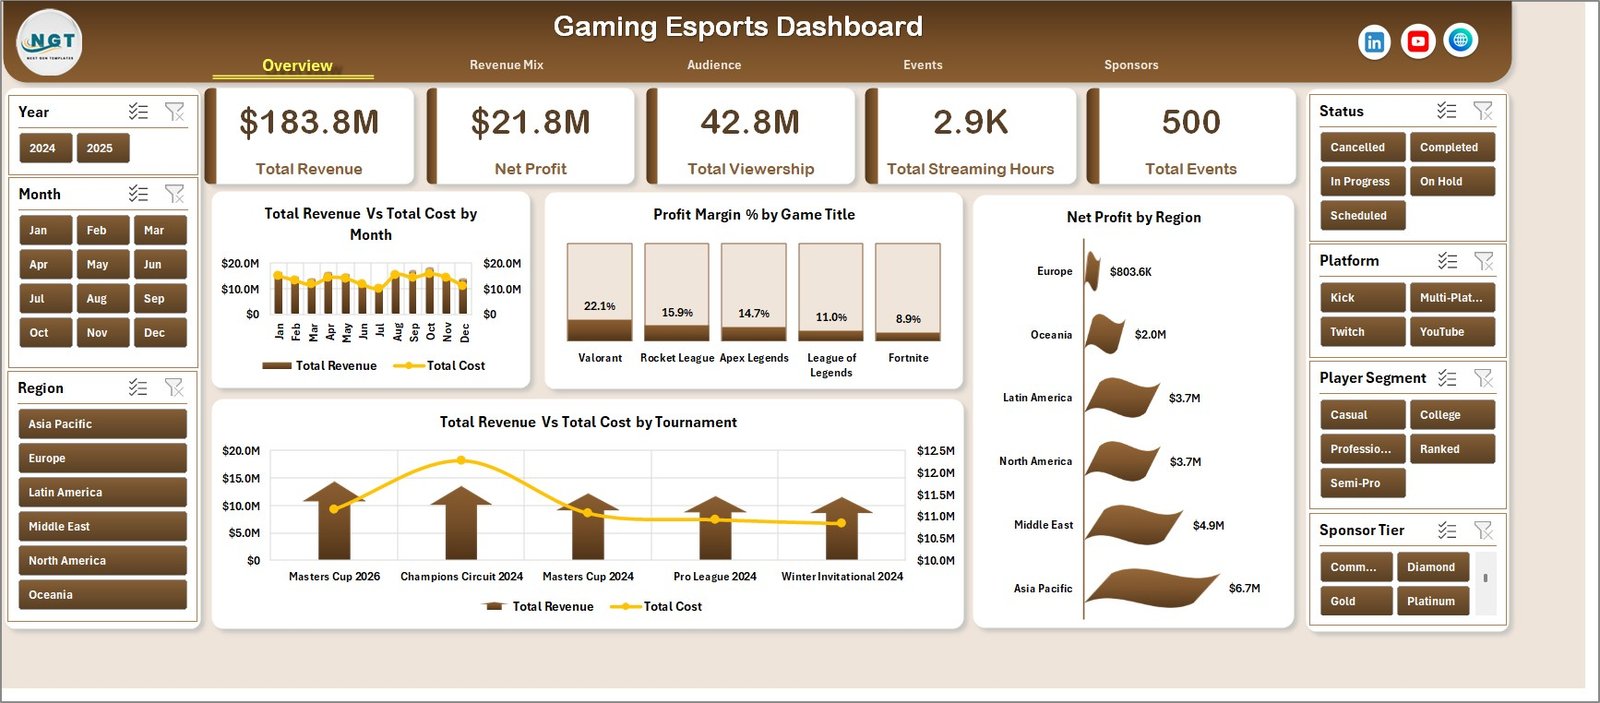
This Excel dashboard tracks high-level esports performance using cards for Total Revenue, Net Profit, Total Viewership, Total Streaming Hours, and Total Events. These cards help owners, analysts, and tournament managers quickly understand commercial performance before drilling into the supporting charts.
Interactive slicers help you filter the dashboard quickly by available dimensions such as month, region, platform, game title, tournament, sponsor tier, status, and related categories in the dataset. Because the workbook is Excel-based, your team can update the data sheet, click Data > Refresh All, and refresh the pivot tables and charts without rebuilding the dashboard.
What’s Inside the Gaming Esports Dashboard in Excel
Overview Page: The Overview page combines the five headline cards with key revenue, cost, profit, and viewership visuals. Total Revenue Vs Total Cost by Month shows how income and spending move over time. Profit Margin % by Game Title highlights which game titles deliver stronger commercial performance. Net Profit by Region compares regional profitability, while Total Revenue Vs Total Cost by Tournament helps identify high-return and high-cost events.
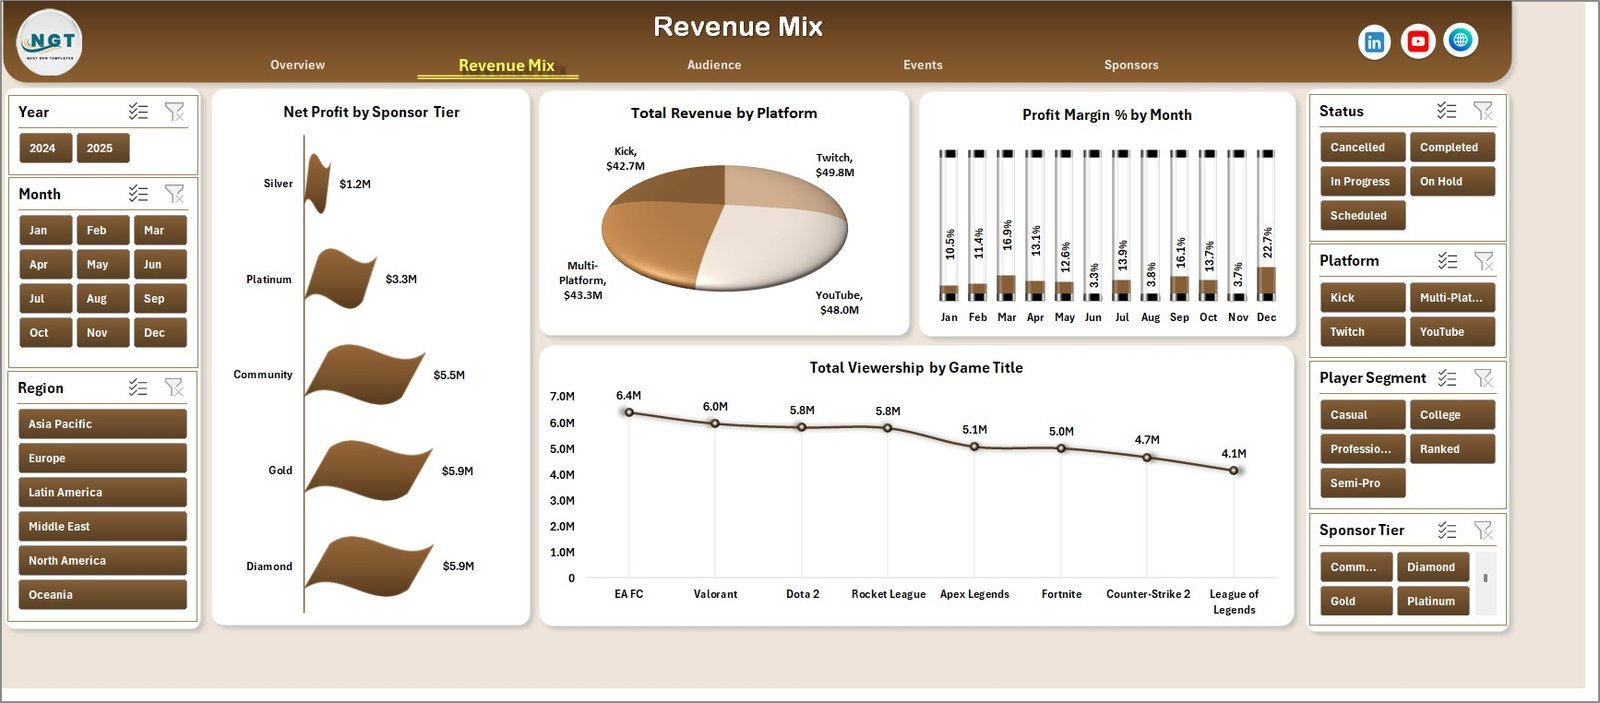
Revenue Mix: This page focuses on monetization. Net Profit by Sponsor Tier shows which sponsorship level contributes the most profit. Total Revenue by Platform compares revenue across streaming or distribution platforms. Profit Margin % by Month reveals margin changes across the reporting period, and Total Viewership by Game Title connects audience size with game-level performance.

Revenue Mix
Audience: The Audience sheet explains where esports attention is coming from. Total Viewership by Platform identifies the strongest viewing channels. Engagement Per Viewer by Player Segment shows which audience segments interact most deeply. Total Viewership by Region compares geographic demand, and Total Events by Status helps separate completed, planned, cancelled, or in-progress events.
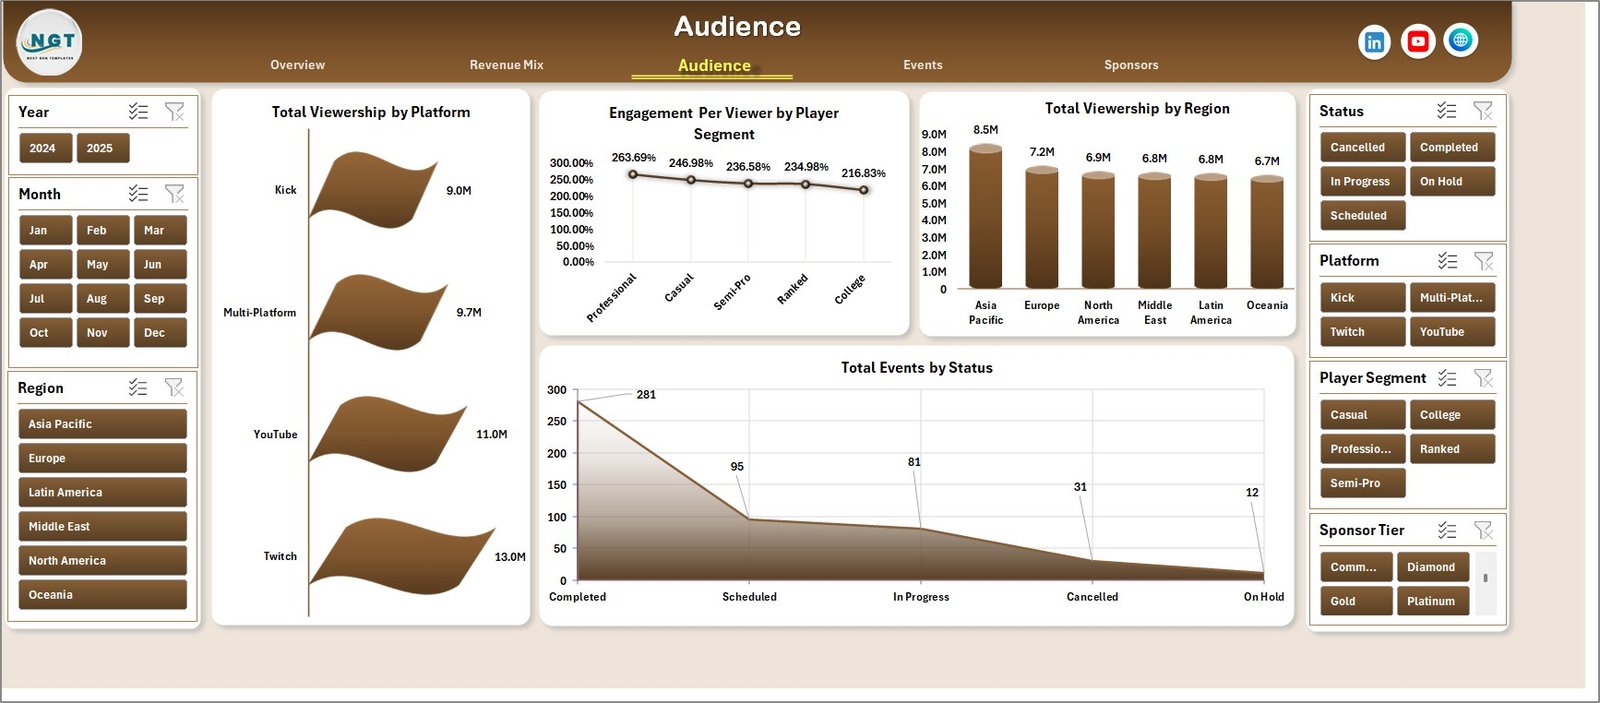
Audience
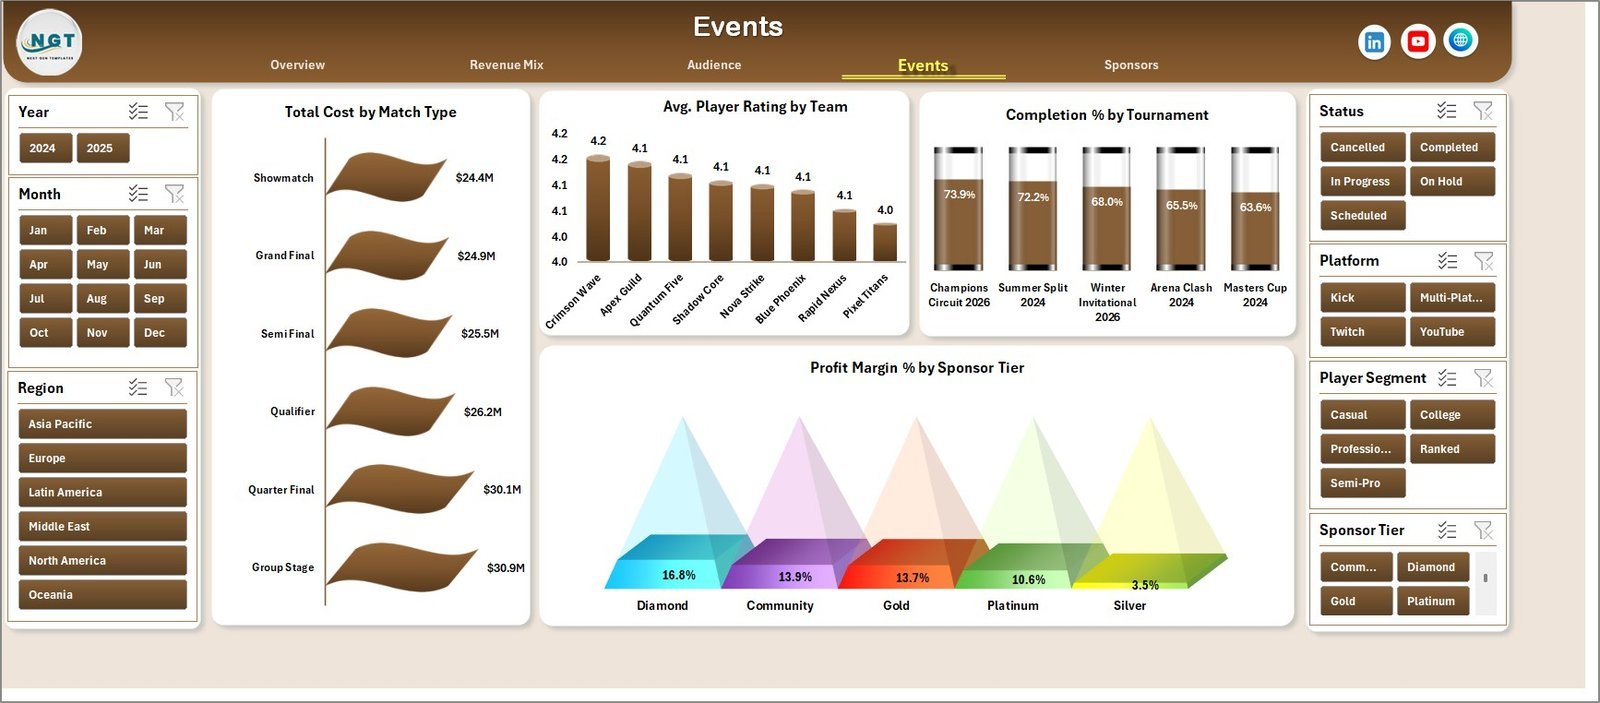
Events: This sheet is built for event operations and competitive performance review. Total Cost by Match Type shows which match formats consume the most budget. Avg. Player Rating by Team compares team-level performance quality. Completion % by Tournament highlights tournament execution status, and Profit Margin % by Sponsor Tier connects sponsor value to event profitability.

Events
Sponsors: The Sponsors sheet helps commercial teams review revenue, cost, and sponsor value. Total Revenue Vs Total Cost by Region shows regional commercial efficiency. Net Profit by Game Title highlights games that attract profitable sponsorship and event activity. Total Revenue Vs Total Cost by Platform compares platform economics for streaming and sponsorship planning.
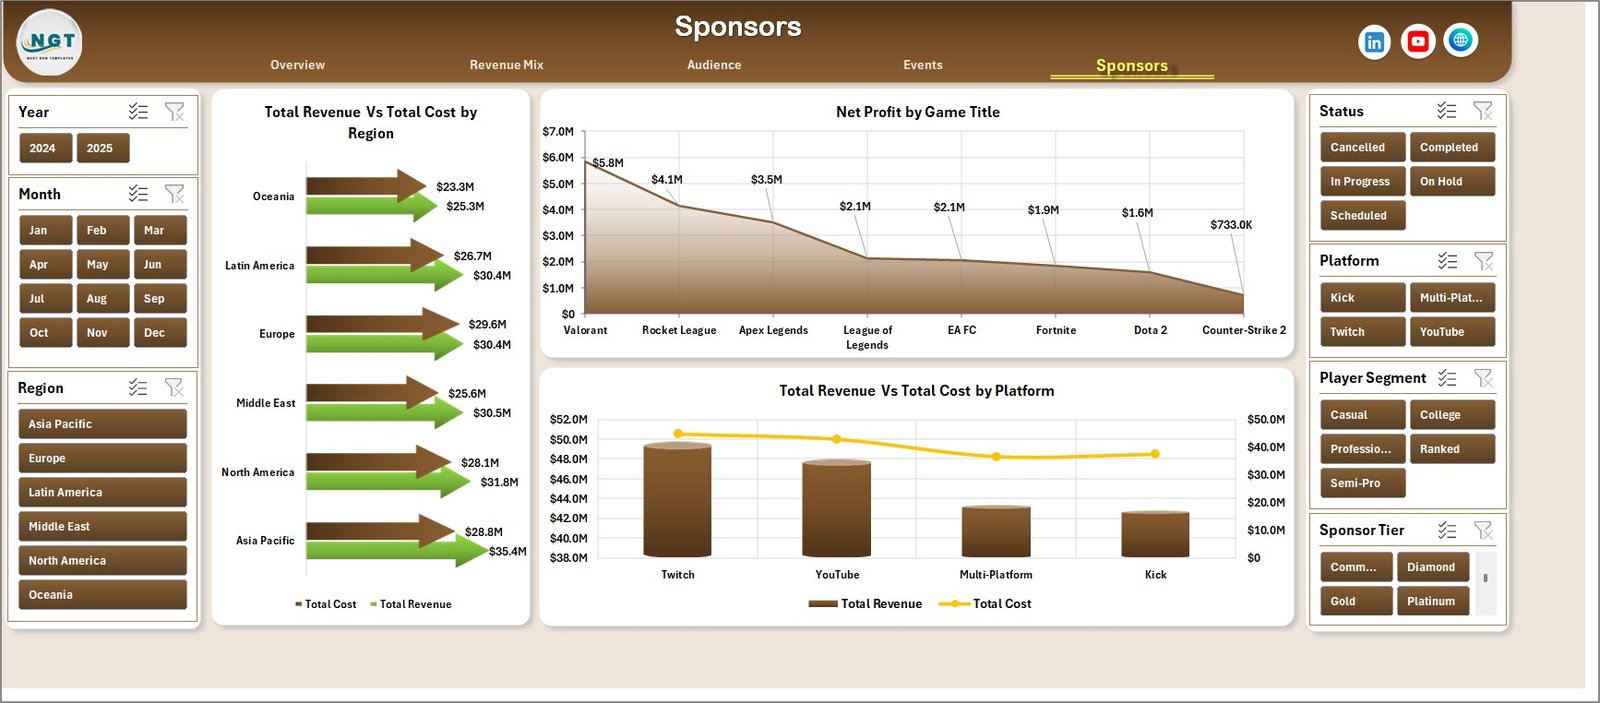
Sponsors
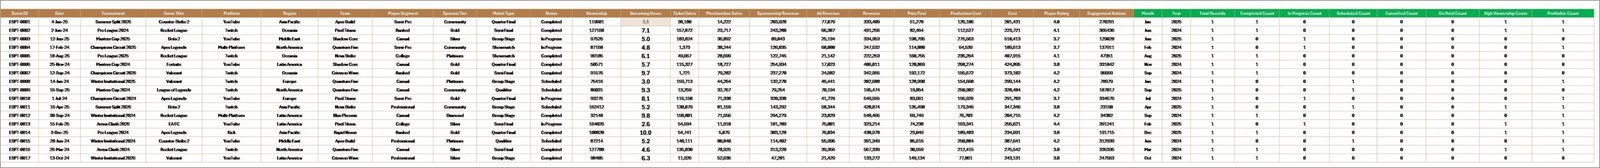
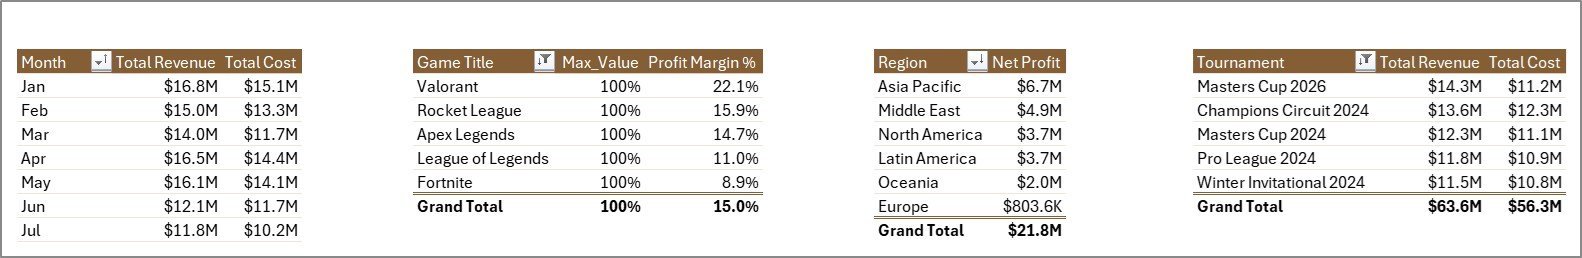
Data Sheet Tab: The Data sheet is where you add or paste your esports records in the same column format as the sample data. Keeping the structure consistent ensures that slicers, pivot tables, cards, and charts refresh correctly.
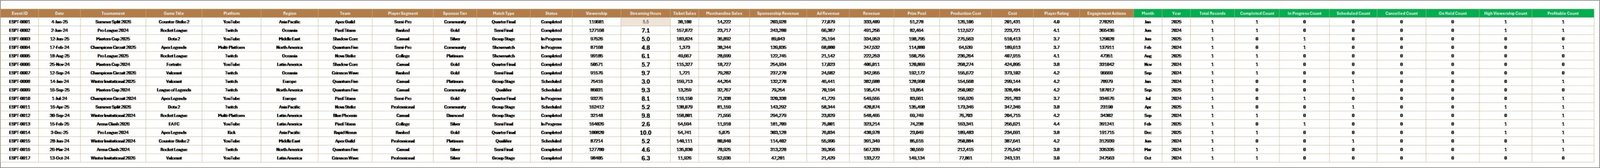
Data Sheet tab
Support Sheet: The Support sheet contains the pivot tables that drive the dashboard dynamically. After updating the data, go to the Data tab in the Excel Ribbon and click Refresh All. You can keep this sheet hidden during normal use.
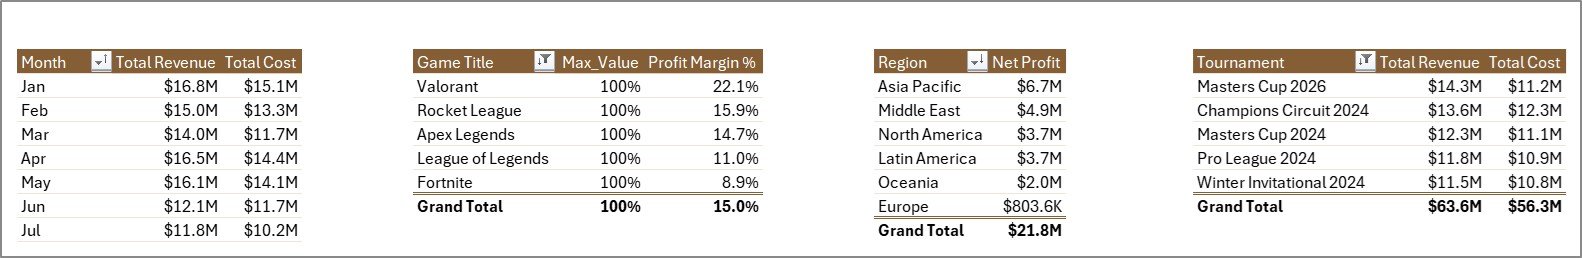
Support sheet tab
Gaming Esports Dashboard in Excel vs. Google Sheets vs. Paid Esports SaaS – Where This Fits
| Feature | This Excel Dashboard | Google Sheets Alternative | Paid Esports SaaS |
|---|---|---|---|
| Cost | $17.99 one-time | Usually template-based or custom | Monthly or annual subscription |
| Platform | Microsoft Excel | Browser-based Sheets | Vendor cloud platform |
| Setup time | Replace data and refresh | Copy file and configure formulas | Implementation and onboarding |
| Custom fields | Editable workbook structure | Editable online sheet | Vendor-controlled fields |
| Year-1 cost at 5 users | $17.99 total | Varies by template and storage | Often hundreds or thousands per year |
Who This Template Is For – and Who It’s Not For
This template is for esports teams, tournament organizers, gaming agencies, streamers, sponsors, and analysts who want a fast Excel reporting system for revenue, cost, viewership, streaming hours, events, platforms, regions, and sponsors. It is not for teams needing live API feeds, automated betting data, video review, anti-cheat systems, or real-time broadcast control.
How to Use the Gaming Esports Dashboard in Excel
Download and unzip the file, open it in Microsoft Excel, replace the sample rows in the Data sheet, keep the same column structure, then use Data > Refresh All. Review the Overview first, then move through Revenue Mix, Audience, Events, and Sponsors to answer deeper questions.
Real-World Use Cases
A tournament manager can compare revenue, costs, and completion percentage across tournaments before the next event planning meeting. A sponsorship lead can review profit by sponsor tier and region before renewing packages. A streaming analyst can compare viewership by platform and game title to decide where to focus future campaigns.
Frequently Asked Questions
Does this dashboard work in Microsoft Excel?
Yes. It is designed as an Excel dashboard workbook with data, dashboard, and support sheets.
Can I update the sample data?
Yes. Replace the sample records in the Data sheet using the same format, then refresh all pivots and charts.
Does it include slicers?
Yes. The dashboard uses slicers so you can filter the analysis quickly.
Is this a Power BI file?
No. This product is for Microsoft Excel. If you prefer Power BI, see related Power BI esports templates below.
Can I hide the support sheet?
Yes. The support sheet contains pivot tables and can be hidden after setup.
Do I need a subscription?
No. This is a one-time purchase downloadable template.
About the Author
Built by PK – Microsoft Certified Professional with 15+ years of Excel, Google Sheets, and Power BI experience. Founder of NextGenTemplates, reaching 300K+ subscribers across YouTube channels. Every template is hand-built and tested before release.
Explore Related Templates
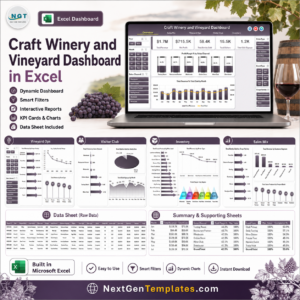
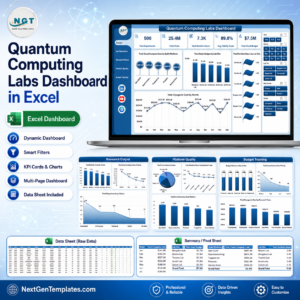
Explore Esports Streaming Dashboard in Power BI, E-sports KPI Scorecard in Excel, Sports Team Dashboard in Excel, and the Excel Dashboard Templates category.
Download the Gaming Esports Dashboard in Excel today and turn esports revenue, viewership, and event data into a clean Excel reporting system. Last updated: June 16, 2026.


Reviews
There are no reviews yet.