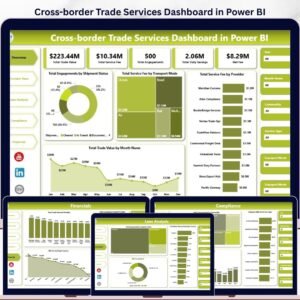

Cross-border trade reporting gets risky when trade value, provider fees, duty savings, compliance status, and shipment results are reviewed in separate files. The Cross-border Trade Services Dashboard in Power BI gives trade service teams a ready-to-use Power BI report for monitoring service performance across five focused report pages. It helps import-export teams, customs brokers, freight forwarders, logistics analysts, and finance managers turn raw trade-service records into visual insights without building a Power BI dashboard from scratch. Download the .pbix file, connect or replace the sample data, refresh the report, and start reviewing provider, lane, compliance, and financial performance in minutes.
Key Features of Cross-border Trade Services Dashboard in Power BI
- Five report pages: Overview, Provider View, Lane Analysis, Compliance, and Financials.
- Executive KPI cards: Track Total Trade Value, Total Service Fee, Total Engagements, Total Duty Savings, and Net Fee.
- Interactive slicers: Filter the dashboard quickly by key trade, provider, country, service, and time dimensions.
- Provider analysis: Compare service fees, trade value, commodities, service types, and origin-country performance.
- Lane analysis: Review compliance status, quarter-based net fee, and destination-country trade value.
- Compliance view: Monitor commodity engagement, monthly net fee, and clearance rate by service type.
- Financial reporting: Analyze trade value, net fee, and compliance cost by provider and origin country.
- Power BI format: Built for interactive filtering, drill-friendly visuals, and repeatable reporting reviews.
What’s Inside the Cross-border Trade Services Dashboard in Power BI
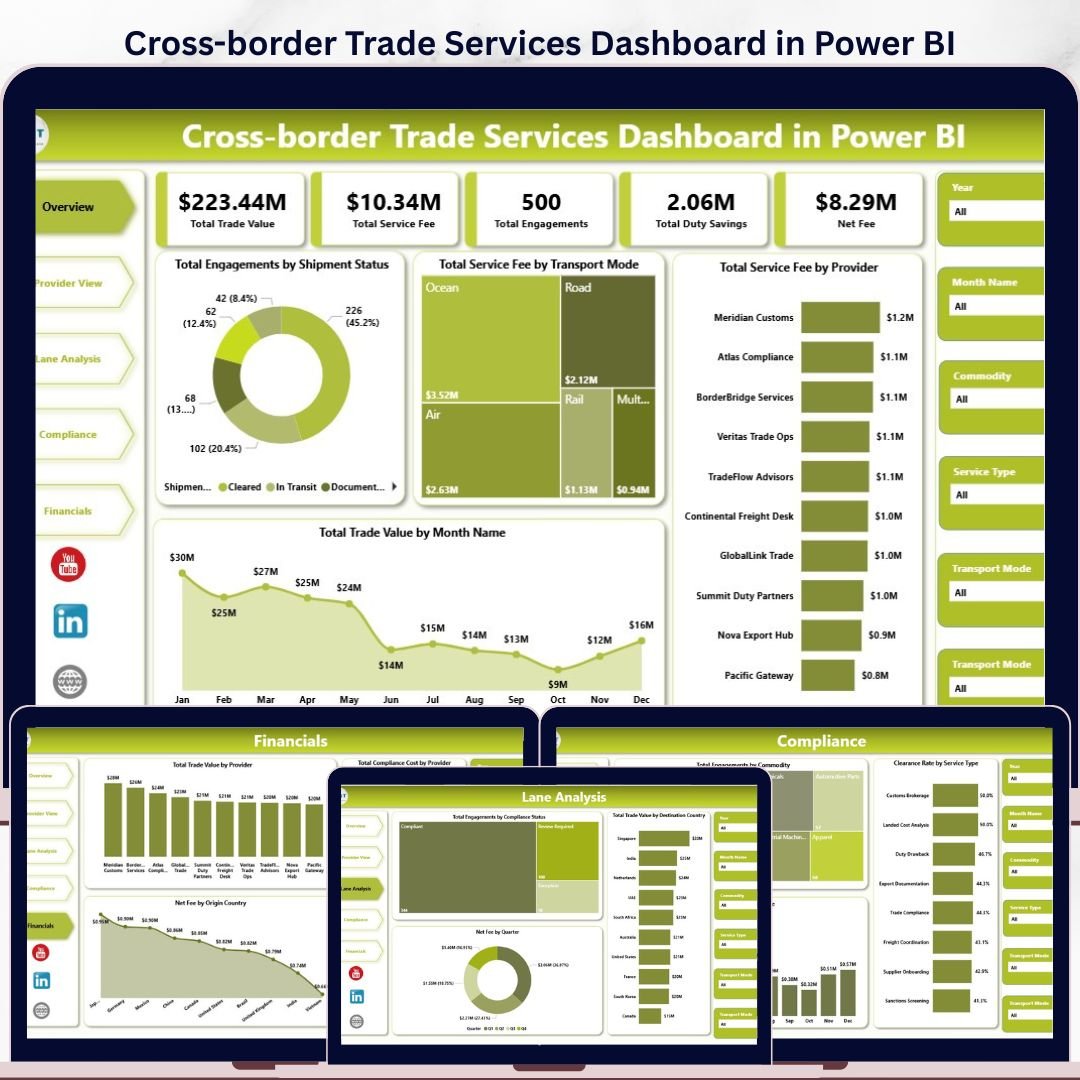
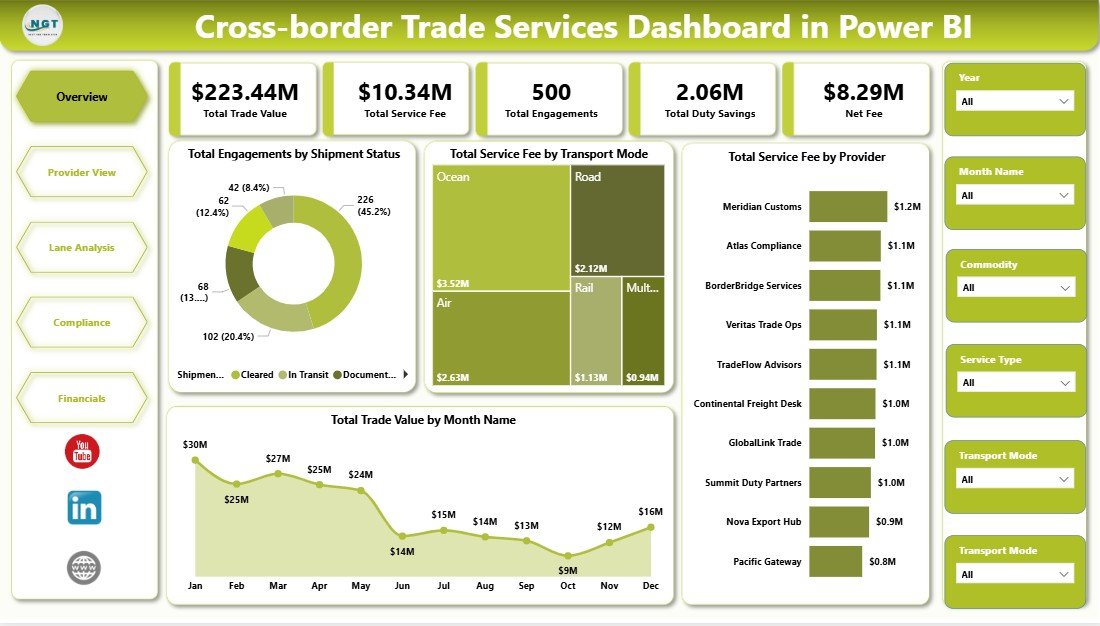
1. Overview Page
The Overview page gives a high-level view of trade service performance. KPI cards show Total Trade Value, Total Service Fee, Total Engagements, Total Duty Savings, and Net Fee so managers can quickly understand scale, fees, savings, and margin impact.
Total Engagements by Shipment Status shows how trade activities are distributed across shipment outcomes. It helps teams identify whether pending, delayed, completed, or exception-heavy records need follow-up.
Total Service Fee by Transport Mode compares service fees across air, sea, road, rail, or other transport modes. This helps logistics and finance teams understand which movement types create the highest fee exposure.
Total Service Fee by Provider highlights which providers contribute the most service fee value. Use it for provider review, contract discussion, and cost management.
Total Trade Value by Month Name shows month-wise trade value movement. It helps leadership see seasonality, spikes, and monthly volume trends.
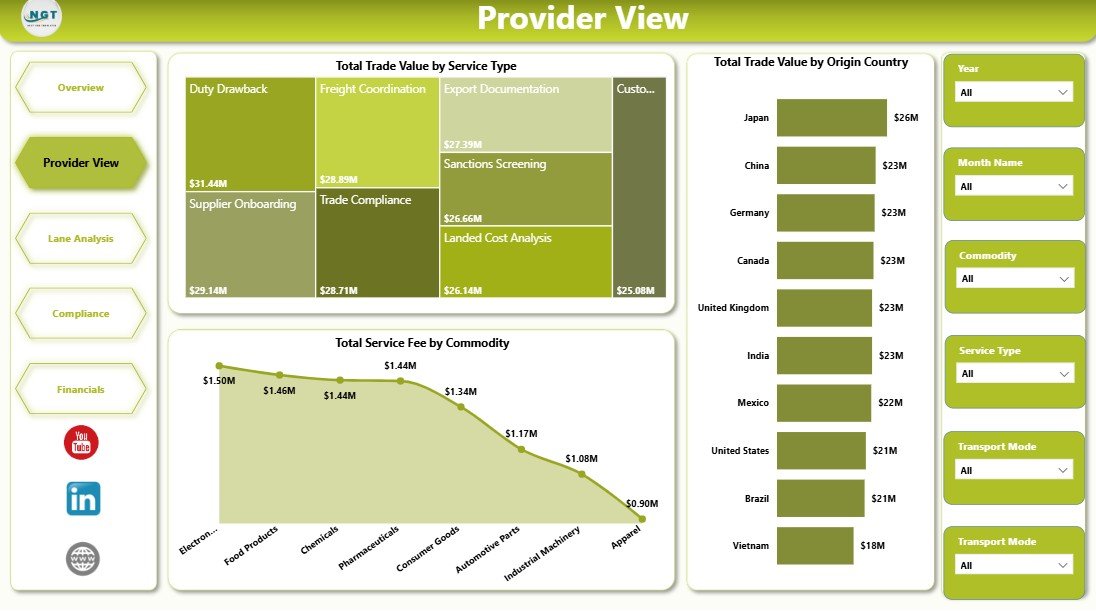
2. Provider View
The Provider View page focuses on service providers, service categories, commodity behavior, and origin-country contribution. It is useful for comparing which trade services and commodities drive the largest value or cost.
Total Trade Value by Service Type shows which service categories carry the highest trade value. This helps teams understand the service mix behind revenue and operational demand.
Total Service Fee by Commodity compares fee impact across commodity groups. It can reveal where documentation, handling, or compliance requirements may be adding cost.
Total Trade Value by Origin Country shows which source countries contribute the most trade value. This is useful for country-level strategy, risk review, and sourcing discussions.
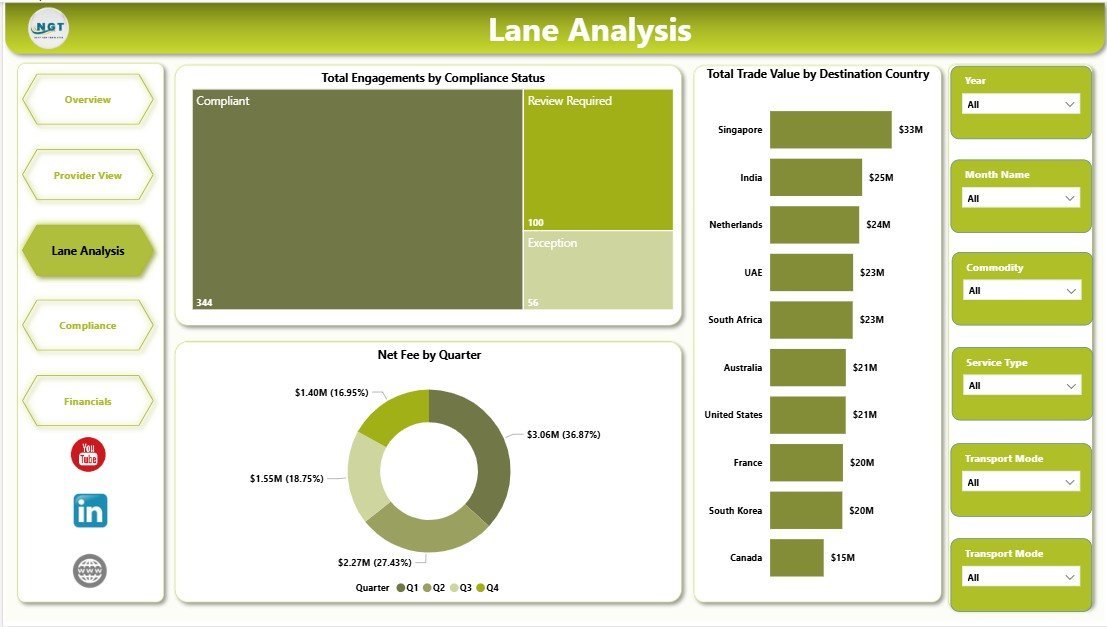
3. Lane Analysis
The Lane Analysis page helps teams understand trade movement by destination, compliance condition, and quarterly performance. It is built for route, country, and operational review.
Total Engagements by Compliance Status shows how many records are compliant, pending, under review, or non-compliant. This helps compliance teams spot risk areas quickly.
Net Fee by Quarter compares fee performance across quarters. It supports seasonal analysis and helps finance teams review whether net fee is improving over time.
Total Trade Value by Destination Country shows where trade value is landing. This is useful for market-level reporting and lane prioritization.

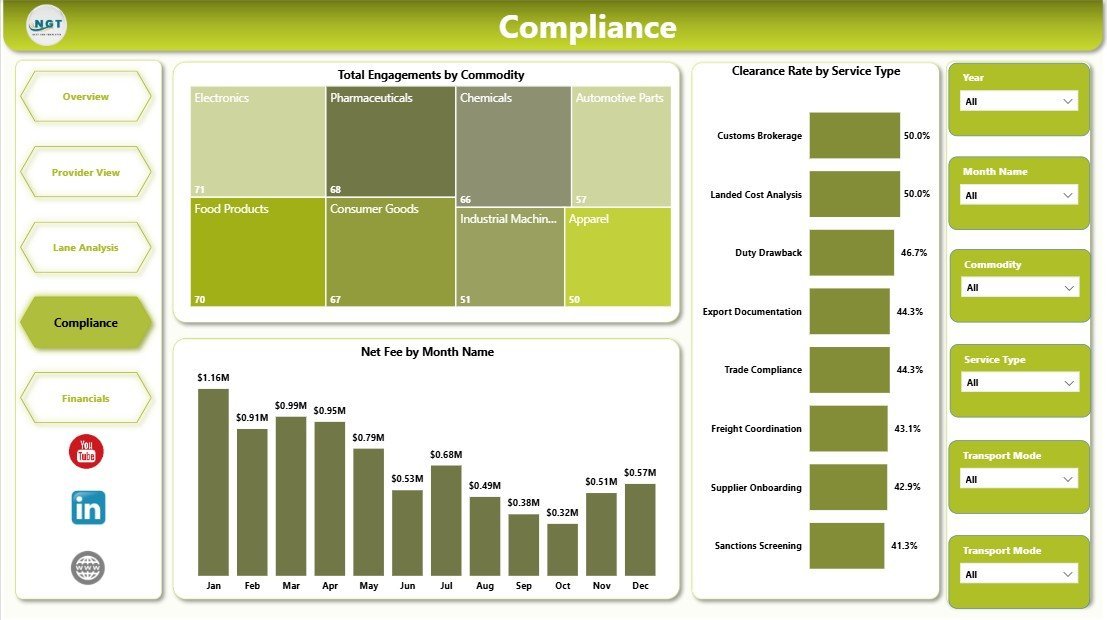
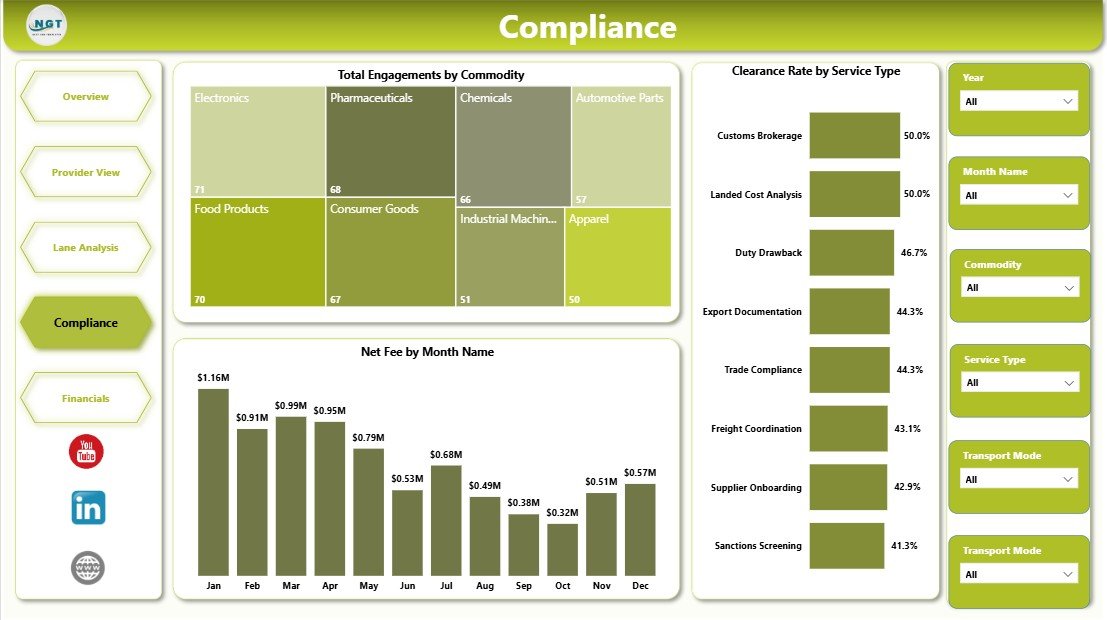
4. Compliance
The Compliance page supports customs, audit, and process-quality review. It connects commodity volume, monthly fee performance, and clearance success into one focused view.
Total Engagements by Commodity shows which commodities generate the most trade-service activity. This helps teams focus compliance checks on the highest-volume areas.
Net Fee by Month Name tracks monthly net fee movement. It helps finance and compliance teams see whether fees are improving, declining, or becoming inconsistent.
Clearance Rate by Service Type compares clearance performance across service types. This helps identify service categories where process improvement may be needed.
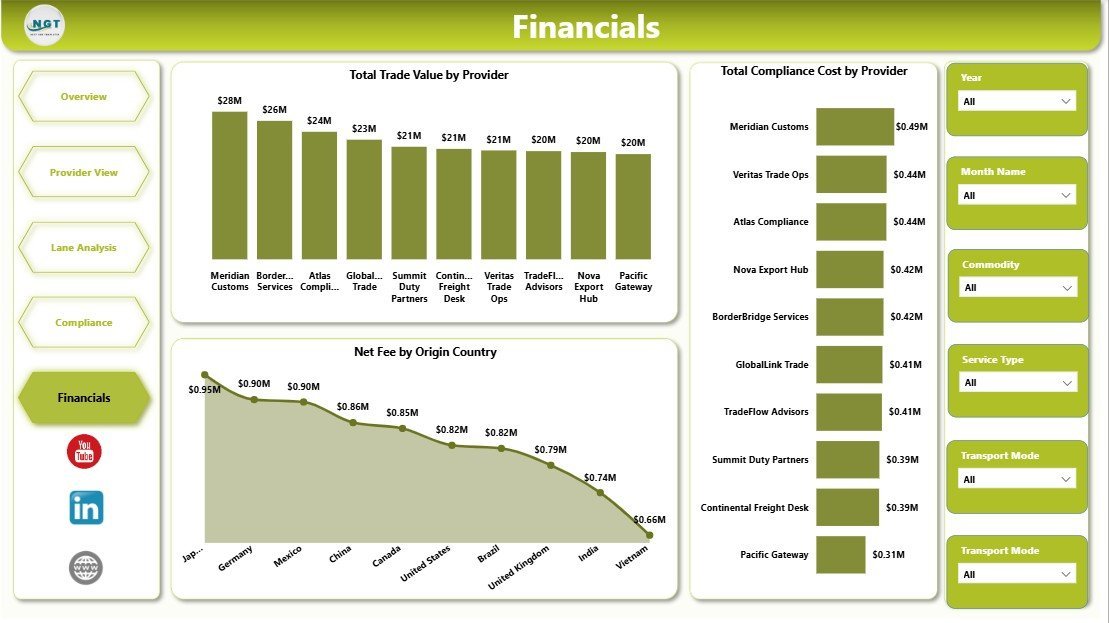
5. Financials
The Financials page is designed for trade value, net fee, and compliance-cost review. Finance managers can use it to compare provider contribution and country-level fee behavior.
Total Trade Value by Provider shows which providers are associated with the highest trade value. This is useful for relationship management and performance review.
Net Fee by Origin Country compares net fee across source countries. It helps teams understand where fee contribution is strongest or weakest.
Total Compliance Cost by Provider shows provider-level compliance cost. This can support negotiations, operational improvement, and cost-control discussions.

Cross-border Trade Services Dashboard in Power BI vs. Tableau vs. Paid Logistics SaaS – Where This Fits
| Area | This Power BI Dashboard | Tableau Alternative | Paid Logistics SaaS |
|---|---|---|---|
| Cost | One-time template purchase | Requires Tableau setup or subscription | Monthly or annual vendor subscription |
| Platform | Power BI Desktop and Power BI Service | Tableau Desktop or Cloud | Vendor-controlled web platform |
| Setup time | Open .pbix, update source, refresh | Rebuild or redesign visuals | Requires onboarding and configuration |
| Customization | Edit measures, visuals, pages, and data model | Editable with Tableau skills | Depends on vendor permissions |
| Year-1 cost at 5 users | Template price plus Power BI licensing if sharing online | Higher BI licensing and build effort | Often hundreds or thousands of dollars |
| Best fit | Reporting, provider review, compliance analysis | Teams already standardized on Tableau | Teams needing live operations workflow automation |
Who This Template Is For – and Who It’s Not For
This template is for import-export businesses, freight forwarders, customs brokers, trade service providers, logistics analysts, compliance teams, and finance managers who need a visual Power BI report for cross-border service performance. It is also useful for consultants preparing trade analytics dashboards for clients.
It is not a live customs filing system, shipment tracking platform, ERP, or TMS. If you need automated documentation submission, carrier APIs, role-based workflow approvals, or live operational alerts, use this dashboard as a reporting layer beside those systems.
How to Use the Cross-border Trade Services Dashboard in Power BI
- Download and unzip the product file.
- Open the .pbix file in Microsoft Power BI Desktop.
- Replace or connect the sample data source with your own trade services data.
- Refresh the Power BI report.
- Use slicers to filter by service type, provider, country, transport mode, commodity, shipment status, quarter, or month.
- Review Overview, Provider View, Lane Analysis, Compliance, and Financials pages for insights.
- Publish to Power BI Service if your team needs online sharing.
Real-World Use Cases
Aarav, Trade Operations Manager: Aarav uses the Overview and Lane Analysis pages to track shipment status, compliance status, and destination-country trade value before weekly operations reviews.
Meera, Compliance Lead: Meera reviews commodity engagement and clearance rate by service type to identify areas where documentation quality needs improvement.
Daniel, Finance Analyst: Daniel compares service fee, net fee, duty savings, compliance cost, and provider contribution before monthly finance reporting.
Frequently Asked Questions
Do I need Power BI Desktop?
Yes. Open the .pbix file in Power BI Desktop, which is available from Microsoft. You may need Power BI Service licensing if you want to publish and share reports online.
Can I use my own trade services data?
Yes. Replace or connect the sample data source, keep the expected fields aligned, and refresh the report.
Can I customize the report pages?
Yes. You can edit visuals, measures, slicers, page names, colors, and the data model inside Power BI Desktop.
Does this dashboard connect to live logistics systems?
No live system connection is included by default. You can extend the report with Power Query connectors if your data source supports it.
Can I publish this dashboard online?
Yes. You can publish it to Power BI Service using your Microsoft account and Power BI permissions.
Is this suitable for monthly reporting?
Yes. The report is especially useful for recurring provider, compliance, lane, and financial reviews.
About the Author
Built by PK – Microsoft Certified Professional with 15+ years of Excel, Google Sheets, and Power BI experience. Founder of NextGenTemplates, reaching 300K+ subscribers across YouTube channels. Every template is hand-built and tested before release.
Explore Related Templates
Explore more Power BI dashboard templates from NextGenTemplates. Related templates include Cross-border Trade Services Dashboard in Excel, Cross-border Trade Services KPI Dashboard in Excel, and Port Logistics Dashboard in Power BI.
Ready to review cross-border trade services in Power BI? Download the template, refresh it with your data, and start analyzing trade value, fees, duty savings, compliance, lanes, and provider performance today.
Last updated: May 23, 2026
🔗 Click here to read the Detailed blog post