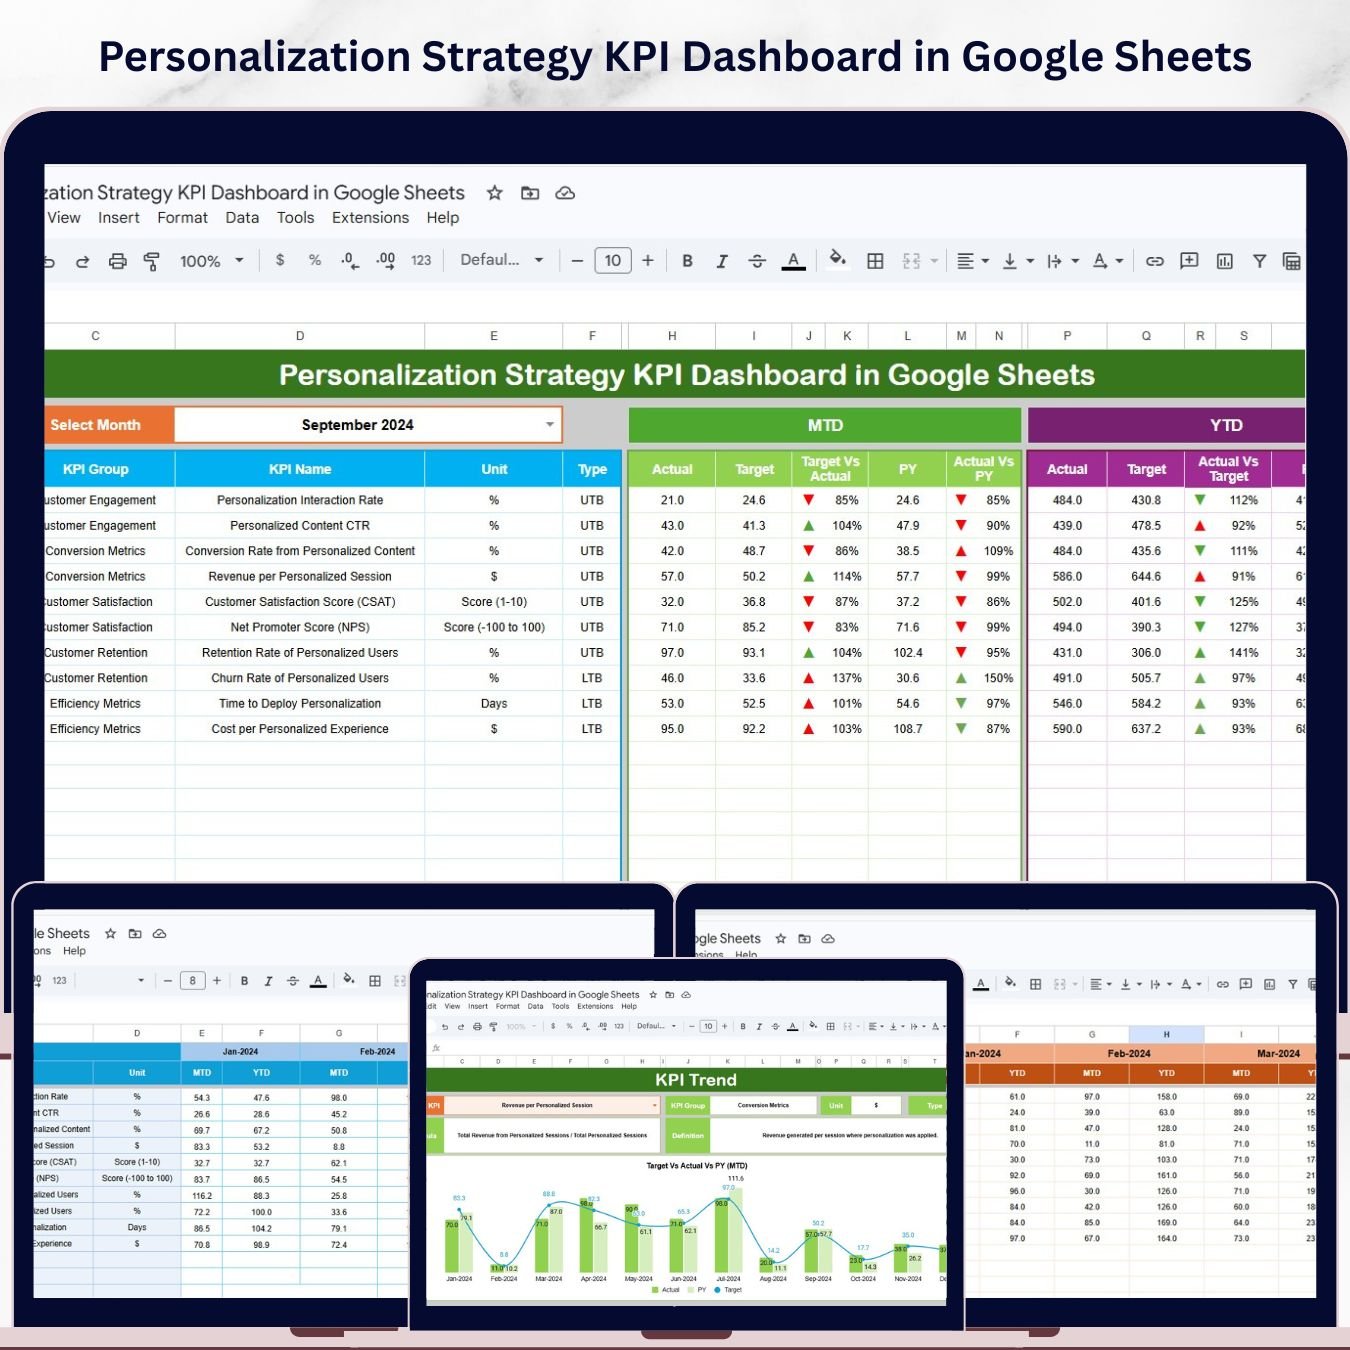

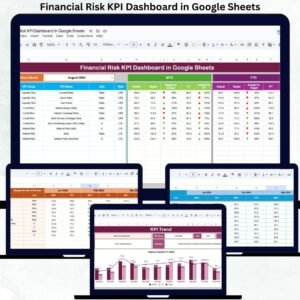
The Personalization Strategy KPI Dashboard in Google Sheets tracks 6 worksheets of structured KPI data covering MTD and YTD Actual, Target, and Previous Year metrics with conditional formatting arrows — all filterable by month from a single drop-down. Setup takes under 10 minutes: make a copy from the link in your download, enter your KPI definitions, paste actual and target numbers, and every dashboard metric updates automatically.Personalization Strategy KPI Dashboard in Google Sheets
🌍 Join 8,400+ teams in 40+ countries using NextGenTemplates to replace paid SaaS tools with one-time-purchase Excel, Google Sheets, Power BI, and HTML templates.Personalization Strategy KPI Dashboard in Google Sheets
✅ Instant download · One-time payment · No subscription · No per-user fees · Lifetime access
🔑 Key Features of Personalization Strategy KPI Dashboard in Google Sheets
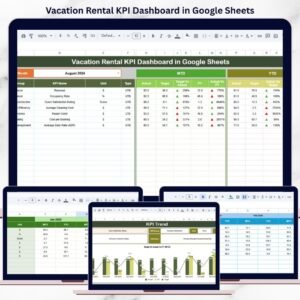
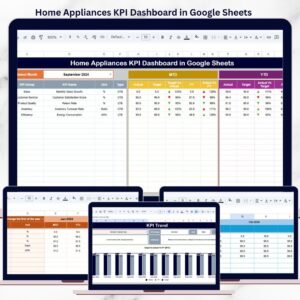
📊 Month-Based Dashboard Filtering — The Dashboard sheet lets you select any month from a drop-down on cell D3, and the entire dashboard recalculates instantly. This makes it easy for personalization managers to compare performance across any reporting period without touching a formulaPersonalization Strategy KPI Dashboard in Google Sheets
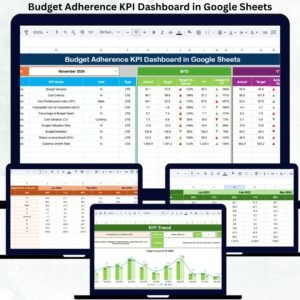
📈 MTD and YTD Dual Tracking — This dashboard simultaneously tracks Month-to-Date and Year-to-Date values for all KPIs. Both Actual vs Target and Actual vs Previous Year variances are shown with up/down conditional formatting arrows, giving leadership a clear visual signal of whether each metric is trending in the right directionPersonalization Strategy KPI Dashboard in Google Sheets
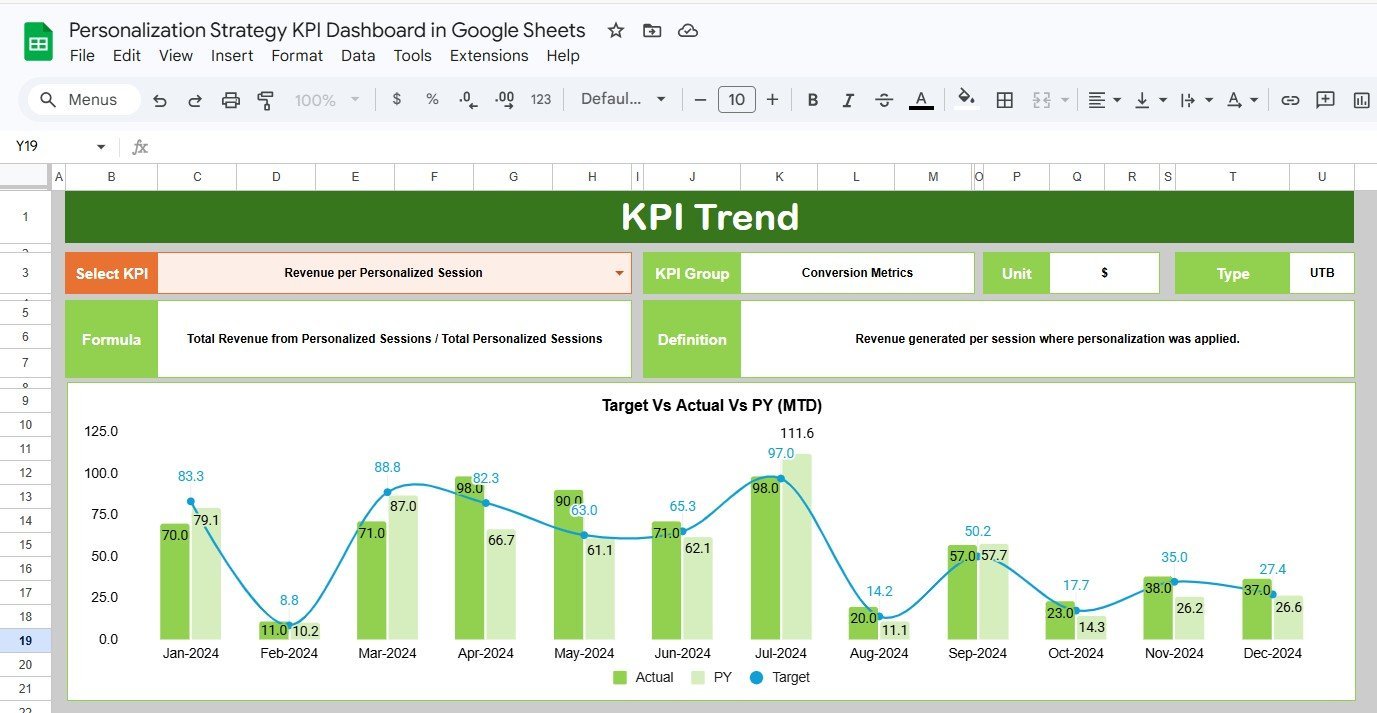
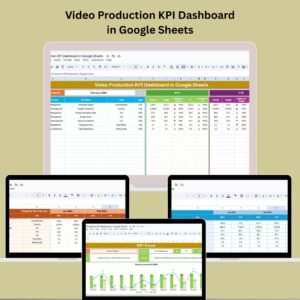
📉 KPI Trend Chart Analysis — The KPI Trend sheet lets you select any individual KPI from a drop-down (cell C3), then displays that KPI’s Group, Unit, Type (Lower the Better or Upper the Better), Formula, and Definition. Paired MTD and YTD line charts show Actual, Target, and Previous Year trends side by side.Personalization Strategy KPI Dashboard in Google Sheets
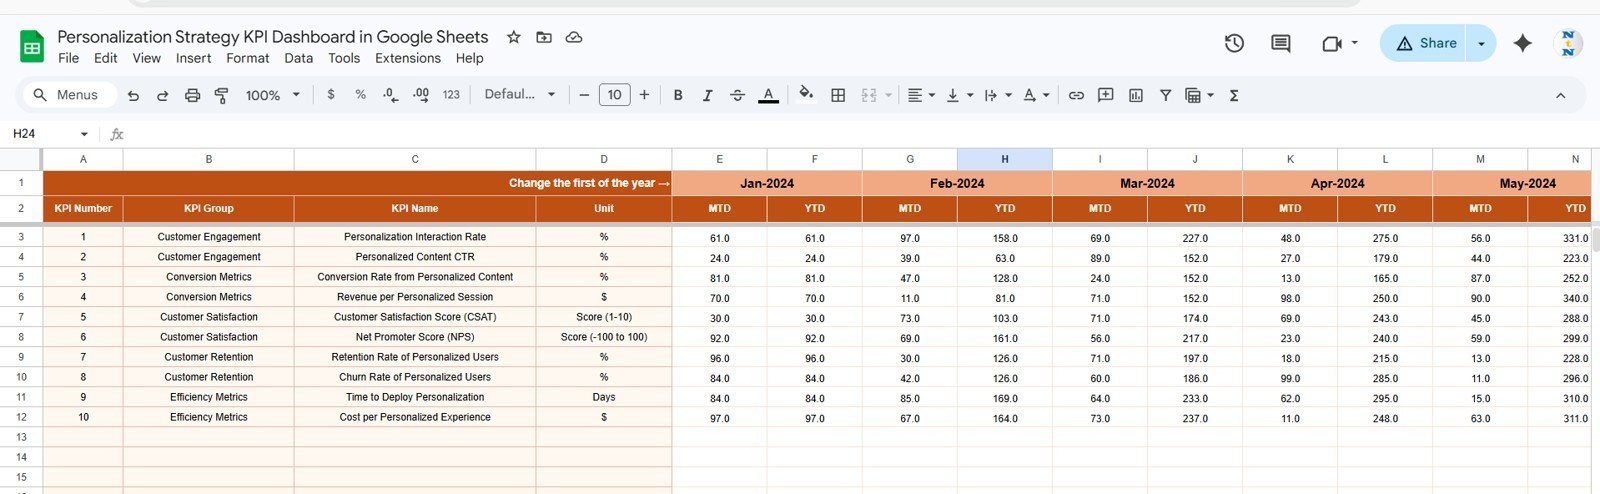
📝 Structured Data Input Sheets — Actual Numbers, Target Numbers, and Previous Year Numbers are entered in separate, clearly organized sheets. The starting month for the fiscal year is configurable on cell E1 of the Actual Numbers sheet.
📚 Customizable KPI Definitions — The KPI Definition sheet is where you specify every KPI’s Name, Group, Unit, Formula, Definition, and whether it is Lower the Better (LTB) or Upper the Better (UTB). This single configuration drives the entire dashboard logic.
This Google Sheets KPI Dashboard follows the same proven structure used across our library of 100+ KPI templates.
📦 What’s Inside the Personalization Strategy KPI Dashboard in Google Sheets
The file ships with 6 structured worksheet tabs:
1. Dashboard Sheet Tab — Select any month from the drop-down on range D3 and the entire dashboard refreshes. Shows MTD Actual, Target, and Previous Year alongside Target vs Actual and PY vs Actual with conditional formatting arrows.
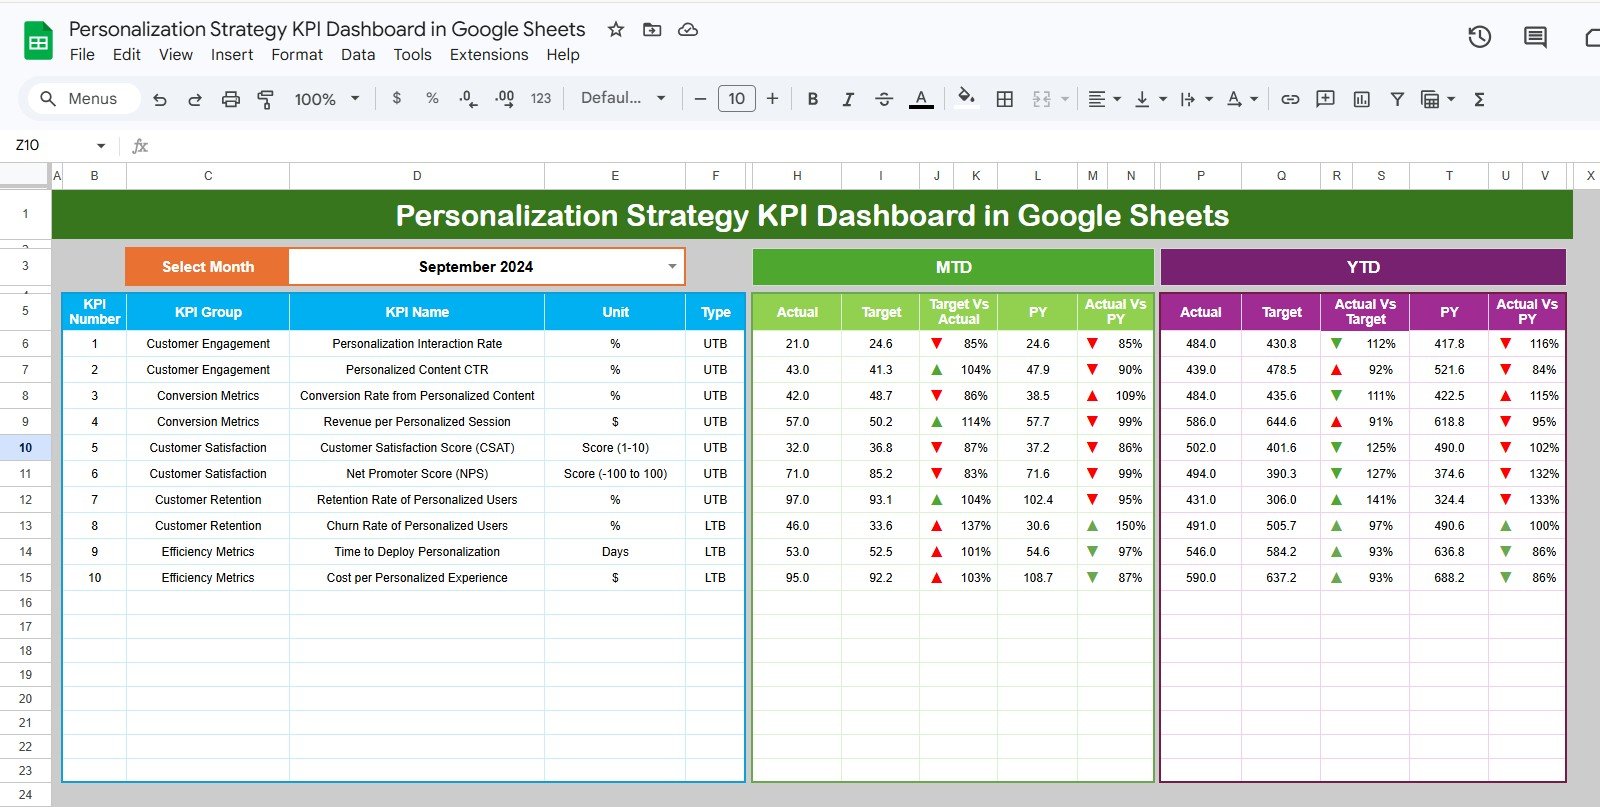
Personalization Strategy KPI Dashboard in Google Sheets
2. KPI Trend Sheet Tab — Select any KPI name from the drop-down on range C3 to display that KPI’s metadata and dynamic MTD/YTD trend charts comparing Actual, Target, and Previous Year numbers.

KPI Trend Sheet
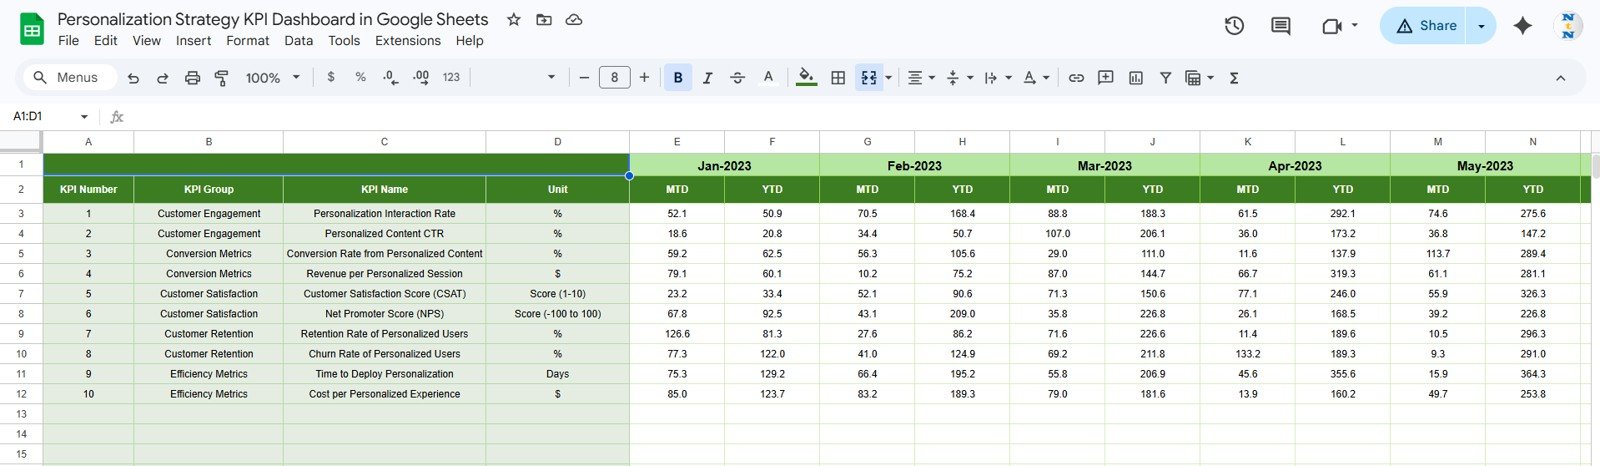
3. Actual Numbers Input Sheet — Enter your actual YTD and MTD figures for each KPI. Set the fiscal year starting month on range E1 to align with your reporting calendar.
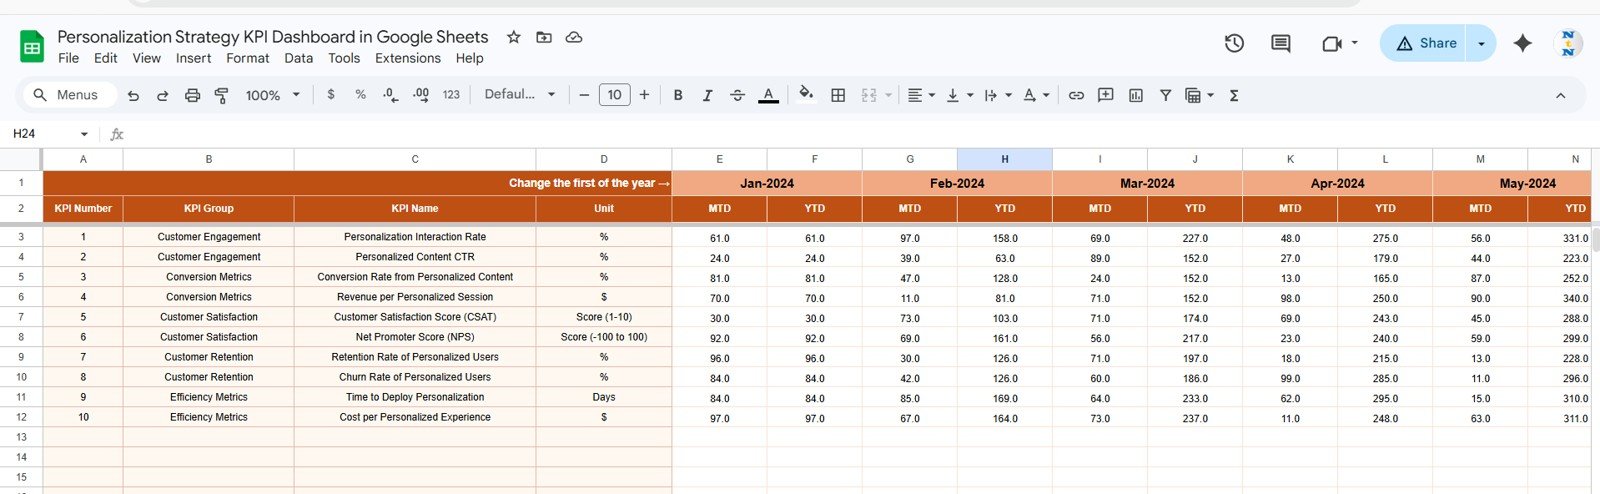
Actual Numbers Input Sheet
4. Target Number Input Sheet — Enter Target numbers for each KPI, both MTD and YTD, for every month of the year.
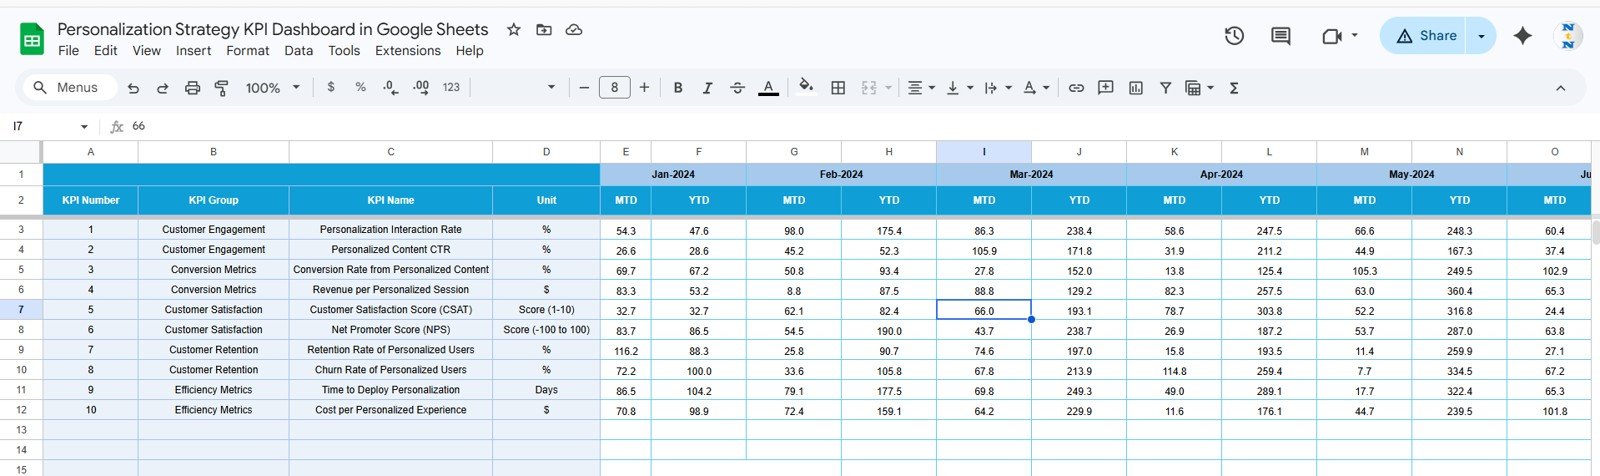
Target Number Input Sheet
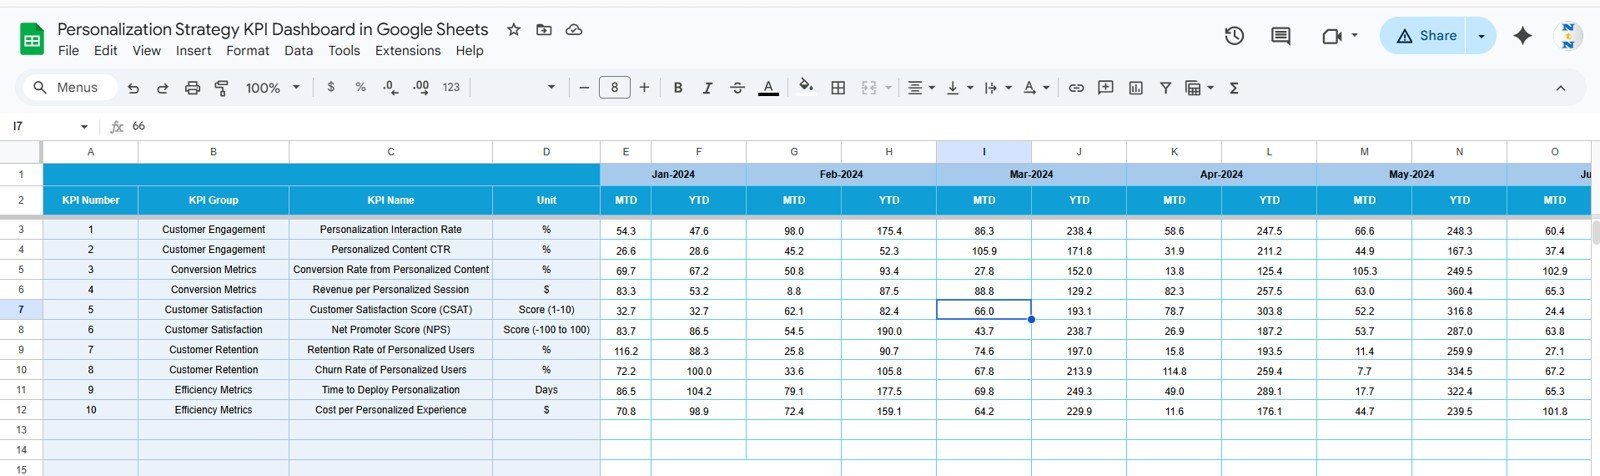
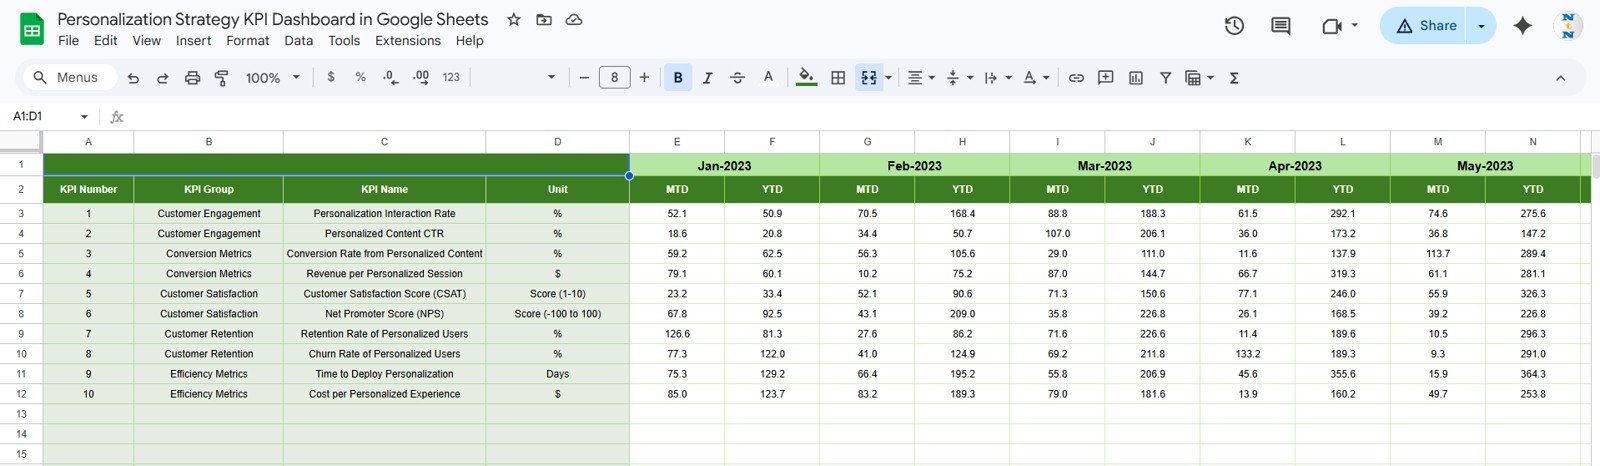
5. Previous Year Number Sheet Tab — Enter prior-year performance data in the same format as the current year to enable YoY benchmarking.
Previous Year Number Input Sheet
6. KPI Definition Sheet Tab — Enter each KPI’s Name, KPI Group, Unit, Formula, and Definition. Specify whether the KPI type is LTB (Lower the Better) or UTB (Upper the Better).
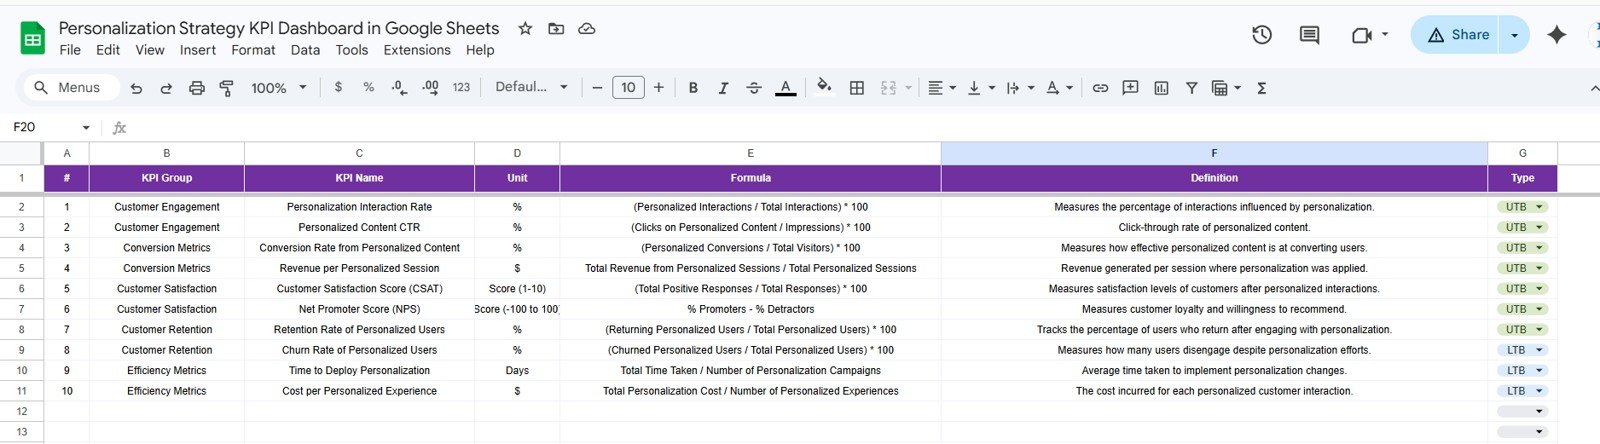
KPI Definition Sheet
📊 Personalization Strategy KPI Dashboard in Google Sheets vs. Microsoft Excel KPI Dashboard vs. HubSpot Marketing Hub — Where This Fits
| Feature | Personalization Strategy KPI Dashboard in Google Sheets | Microsoft Excel KPI Dashboard | HubSpot Marketing Hub |
|---|---|---|---|
| Cost | $8.99 one-time | $12–17 one-time | $800–$3,200 / month |
| Platform | Google Sheets (browser, free) | MS Excel (offline) | Cloud SaaS |
| Setup Time | Under 10 minutes ✅ | Under 15 minutes | 2–4 weeks onboarding |
| Real-time collaboration | ✅ Native — share a link | Requires SharePoint | ✅ Built-in |
| MTD + YTD dual tracking | ✅ Built-in | ✅ Manual build | ⚠️ Custom reports only |
| LTB / UTB KPI logic | ✅ Built-in | Manual setup | ❌ Not available |
| Year-1 cost at 5 users | $8.99 total | $12–17 total | $9,600–$38,400 |
For marketing and personalization teams that want structured MTD/YTD KPI tracking without enterprise SaaS pricing, the Personalization Strategy KPI Dashboard in Google Sheets sits in the sweet spot.
👥 Who This Template Is For — and Who It’s Not For
✅ This template is built for:
- Marketing analysts and personalization managers tracking monthly and annual KPI performance
- E-commerce and CRM teams measuring personalization strategy effectiveness across multiple KPI groups
- Growth teams comparing Actual vs Target vs Prior Year without building custom dashboards
- Agencies managing personalization KPI reporting for multiple clients in Google Sheets
❌ This template is NOT for:
- Teams needing live API connections to ad platforms or CRM systems
- Enterprises requiring SOC 2 compliance or SSO in their analytics layer
- Teams with zero spreadsheet experience needing a fully automated no-input tool
⚙️ How to Use the Personalization Strategy KPI Dashboard in Google Sheets
- Download the PDF guide and click the Google Sheets copy link inside.
- Make a copy to your own Google Drive.
- Open the KPI Definition sheet and enter your KPI names, groups, units, formulas, definitions, and LTB/UTB classification.
- Enter monthly MTD and YTD targets in the Target Number Input sheet.
- Enter last year’s performance data in the Previous Year Number sheet.
- Open the Actual Numbers Input sheet, set fiscal year start month on E1, and enter monthly actual data.
- Select your desired month from the D3 drop-down on the Dashboard tab — the entire dashboard refreshes instantly.
💼 Real-World Use Cases
Priya is a personalization analyst at a 50-person e-commerce brand. She tracks 12 KPIs across recommendation engine performance, email personalization click rates, and dynamic content engagement. Every month she updates the Actual Numbers sheet and presents the Dashboard tab to her VP of Marketing, replacing a manual PowerPoint that used to take half a day to compile.
Marco leads growth at a SaaS startup running A/B personalization tests. He uses the KPI Trend sheet to isolate underperforming KPIs and spot months where actual performance diverged most sharply from targets.
A boutique marketing agency uses this dashboard for five clients simultaneously. The KPI Definition sheet lets the agency configure completely different KPI sets per client without rebuilding the structure — cutting monthly reporting time by 60%.
❓ Frequently Asked Questions
What KPIs does the Personalization Strategy KPI Dashboard in Google Sheets track?
The Personalization Strategy KPI Dashboard in Google Sheets tracks any KPI you configure in the KPI Definition sheet. You define the KPI names, groups, units, formulas, and whether each is Lower the Better (LTB) or Upper the Better (UTB). The dashboard displays MTD and YTD Actual, Target, and Previous Year values with conditional formatting arrows for all defined KPIs.
How does this compare to HubSpot Marketing Hub?
HubSpot Marketing Hub starts at $800/month and requires weeks of onboarding. The Personalization Strategy KPI Dashboard in Google Sheets is an $8.99 one-time purchase that delivers structured MTD/YTD KPI tracking with variance analysis in under 10 minutes.
How long does setup take?
Setup takes under 10 minutes. Make a copy in Google Drive, fill in the KPI Definition sheet, enter Target and Previous Year data, add your first month of Actual data, and select your month from the dashboard drop-down.
Can I add my own KPIs?
Yes. Add any number of KPIs to the KPI Definition sheet with their names, groups, units, formulas, definitions, and LTB/UTB type. The dashboard reads from this configuration automatically.
Does this work for teams using different fiscal year start months?
Yes. Set the fiscal year start month on cell E1 of the Actual Numbers Input sheet. The YTD calculations and dashboard period labels adjust accordingly.
Is there an Excel version of this KPI dashboard?
Browse our Google Sheets KPI Dashboards collection or explore related templates like the Call Abandonment Rate KPI Dashboard in Google Sheets.Personalization Strategy KPI Dashboard in Google Sheets
👤 About the Author
Built by PK — Microsoft Certified Professional with 15+ years of Excel, Google Sheets, and Power BI experience. Founder of NextGenTemplates, reaching 300K+ subscribers across YouTube channels (@PK-AnExcelExpert, @NextGenTemplates, @NeoTechNavigators). Every template is hand-built and tested before releasePersonalization Strategy KPI Dashboard in Google Sheets
🔗 Explore Related Templates
- Call Abandonment Rate KPI Dashboard in Google Sheets — Track call center KPIs with the same MTD/YTD structure across 6 worksheets.
- HVAC Service Dashboard in Google Sheets — Operational Google Sheets dashboard for field service teams.
- Browse all Google Sheets KPI Dashboard Templates in our full library.Personalization Strategy KPI Dashboard in Google Sheets
📖 Click here to read the Detailed Blog Post
🎥 Visit our YouTube channel for step-by-step video tutorials
👉 YouTube.com/@NextGenTemplates


Reviews
There are no reviews yet.