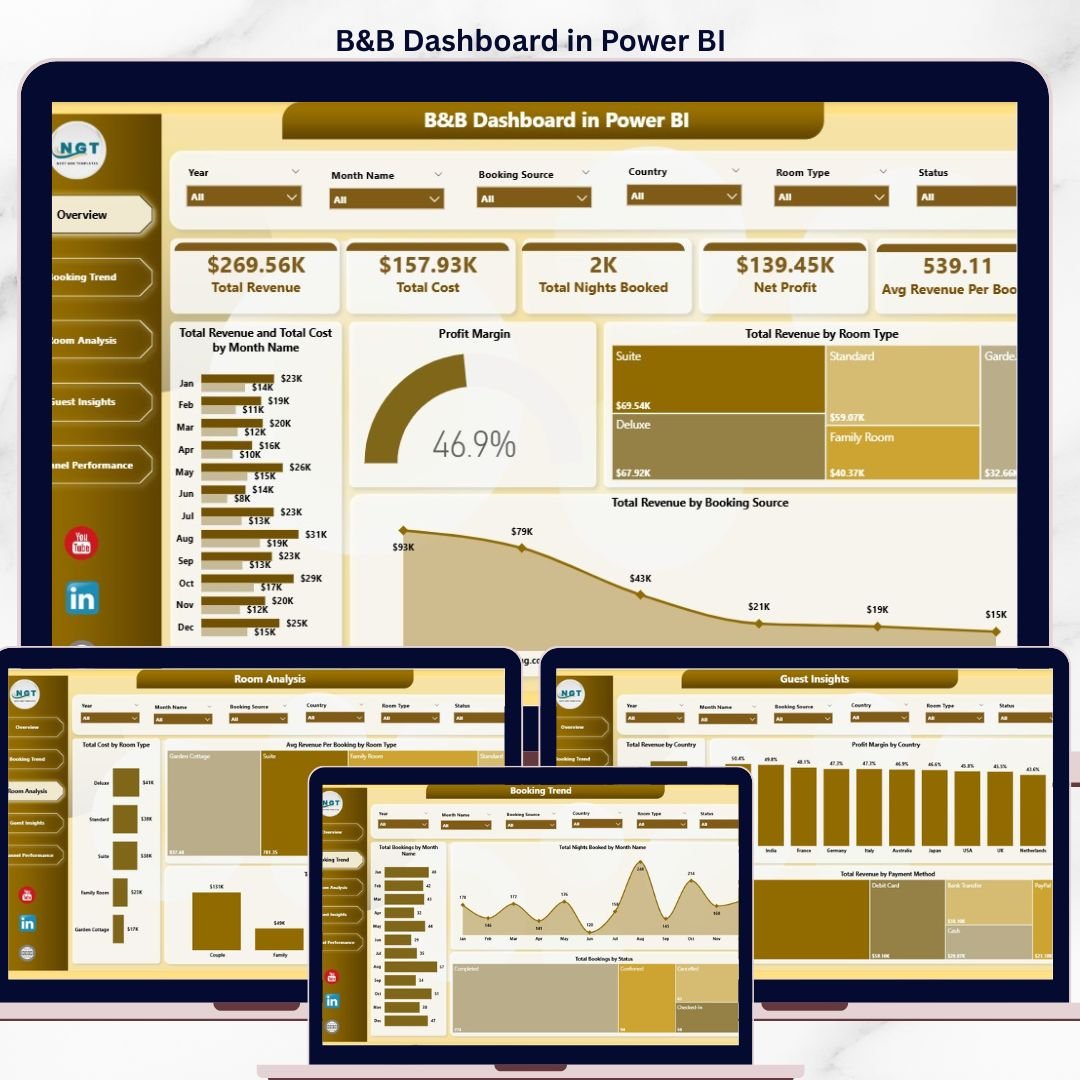


The B&B Dashboard in Power BI tracks 5 core KPIs and 13 interactive visuals across 5 report pages — Overview, Booking Trend, Room Analysis, Guest Insights, and Channel Performance — with multiple slicers for booking source, room type, guest type, country, and payment method. Setup takes under 10 minutes — point Power BI Desktop at your reservation data, refresh, and every visual updates automatically. This is built for independent bed-and-breakfast owners and small-inn operators who want decision-grade analytics without paying $70+ per month for a property management SaaS.
🌍 Join 8,400+ teams in 40+ countries using NextGenTemplates to replace paid SaaS tools with one-time-purchase Excel, Google Sheets, Power BI, and HTML templates.
✅ Instant download · One-time payment · No subscription · No per-user fees · Lifetime access
B&B Dashboard in Power BI
🔑 Key Features of B&B Dashboard in Power BI
📊 Five Interactive Report Pages – Overview, Booking Trend, Room Analysis, Guest Insights, and Channel Performance pages give B&B owners a complete operational picture from a single .pbix file. Every page is connected to the same data model so booking entries flow across all visuals.
🎚️ Multiple Slicers and Filters – Filter the entire report by booking source, room type, guest type, country, and payment method with a single click. Slicers update visuals instantly using cross-filtering, which is a core Power BI feature documented in the official Microsoft Power BI slicer guide.
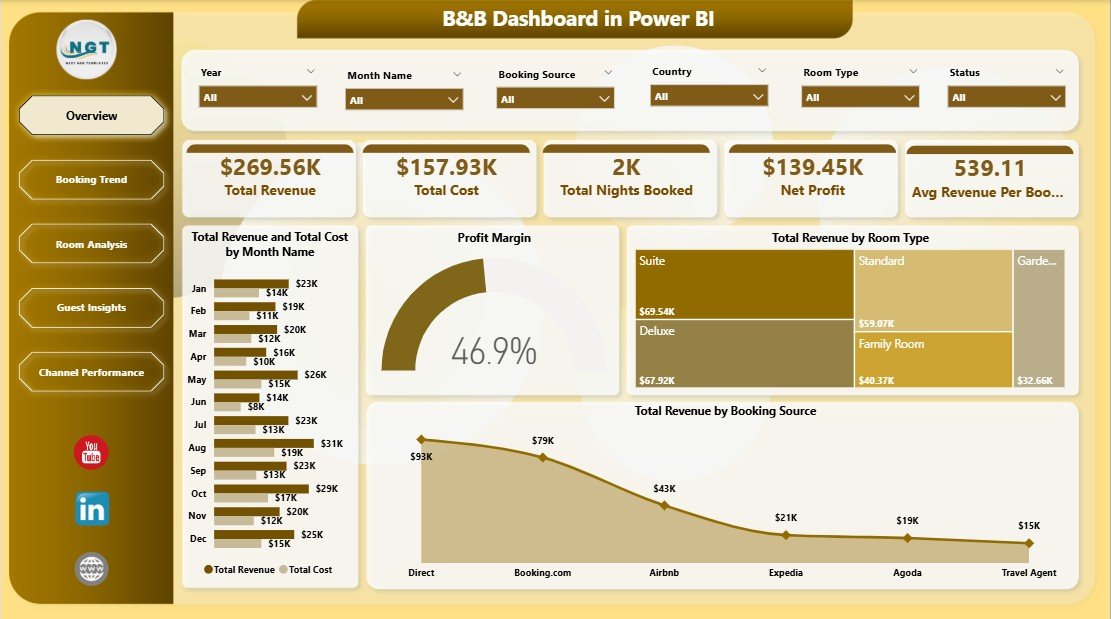
💰 Revenue, Cost, and Profit Tracking – Five KPI cards on the Overview page display Total Revenue, Total Cost, Total Nights Booked, Net Profit, and Avg Revenue Per Booking. Dedicated visuals break Profit Margin and Net Profit down by booking source and country.
🌐 Channel Performance Reporting – Compares Total Cost, Net Profit, and Avg Revenue Per Booking across booking sources to show which OTAs, direct channels, or referrals deliver the highest per-booking margin.
👥 Guest Segmentation Analytics – Total Revenue by Country, Profit Margin by Country, Total Revenue by Payment Method, and Total Revenue by Guest Type help identify the most profitable source markets and stay segments to target with marketing.
📅 Booking Trend Analysis – Total Bookings by Month, Total Nights Booked by Month, and Total Bookings by Status reveal peak-season timing, no-show patterns, and year-over-year growth trajectory.
📦 What’s Inside the B&B Dashboard in Power BI
📌 1. Overview Page – Five high-level KPI cards display Total Revenue, Total Cost, Total Nights Booked, Net Profit, and Avg Revenue Per Booking. Visuals on this page include Total Revenue and Total Cost by Month Name (compares revenue against cost across the year), Profit Margin (a high-level performance gauge), Total Revenue by Room Type (highlights top-earning room categories), and Total Revenue by Booking Source (shows channel contribution to revenue). Slicers at the top filter the entire page in one click.
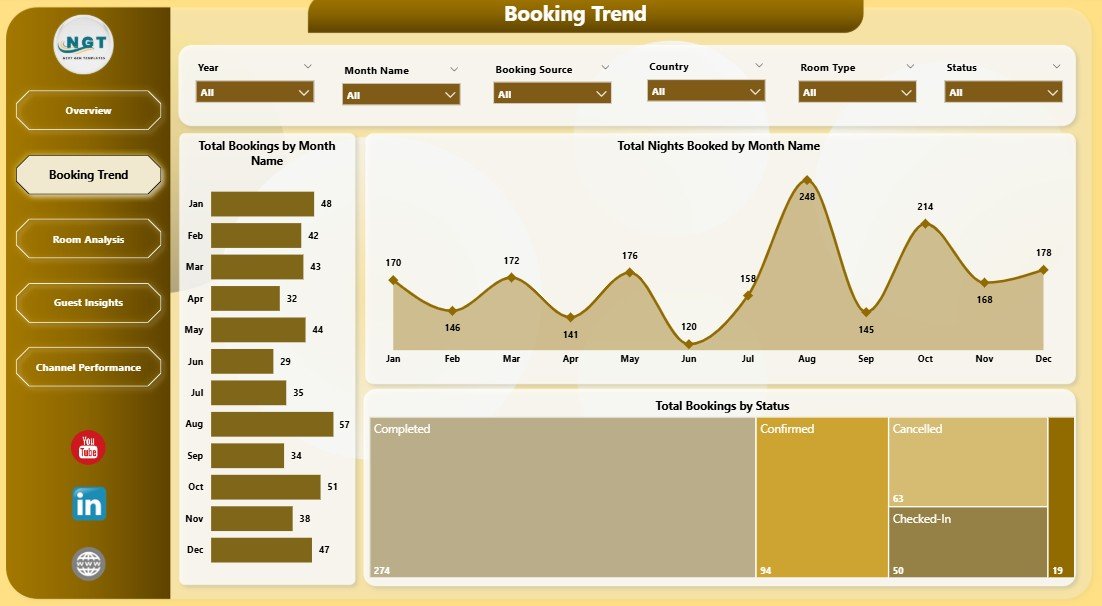
Booking Trend
📅 2. Booking Trend – Time-series view containing Total Bookings by Month Name (spotlights peak booking months), Total Nights Booked by Month Name (highlights occupancy load by month), and Total Bookings by Status (separates confirmed, cancelled, and no-show bookings). Useful for spotting peak-season patterns and confirming year-over-year growth.

Room Analysis
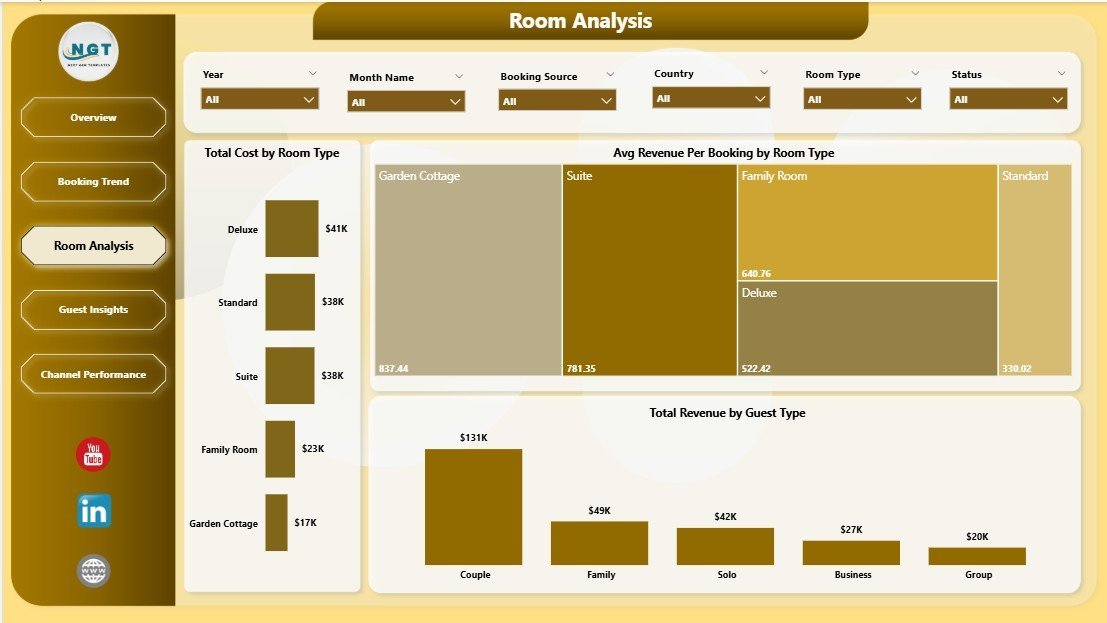
🛏️ 3. Room Analysis – Room-level economics with Total Cost by Room Type (shows operating cost variance across rooms), Avg Revenue Per Booking by Room Type (reveals which rooms produce the highest revenue per stay), and Total Revenue by Guest Type (compares contribution from leisure, business, family, and group guests). Helps you adjust room pricing and marketing focus.
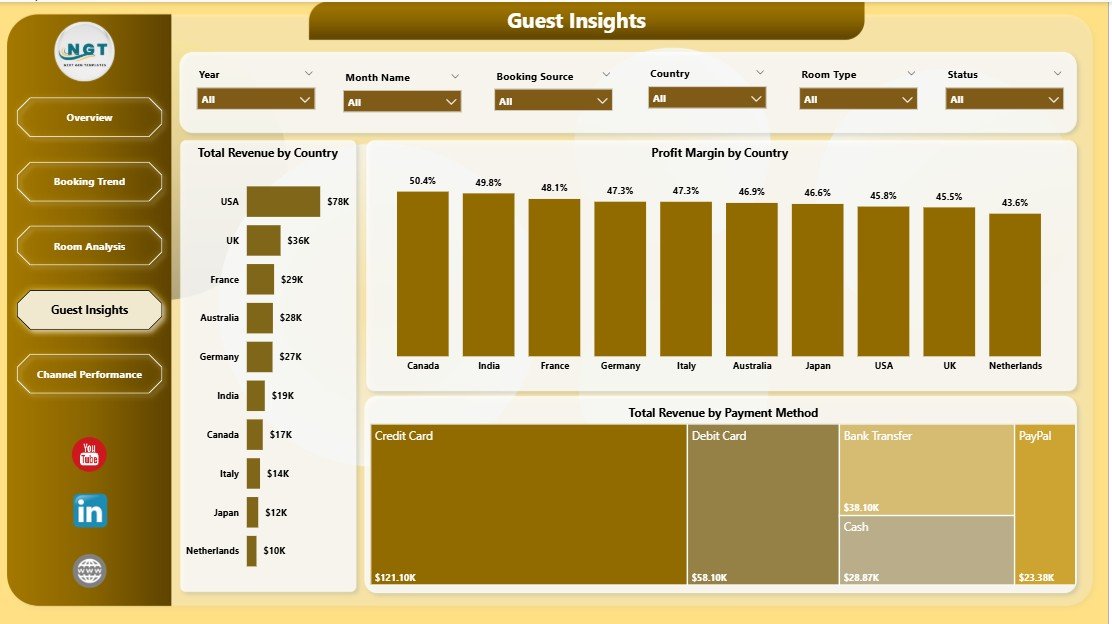
Guest Insights
👥 4. Guest Insights – Guest-segment analytics with Total Revenue by Country (highlights top source markets), Profit Margin by Country (flags high-margin vs. low-margin geographies), and Total Revenue by Payment Method (shows which payment channels carry the most revenue). Ideal for shaping multilingual marketing and payment-mix decisions.
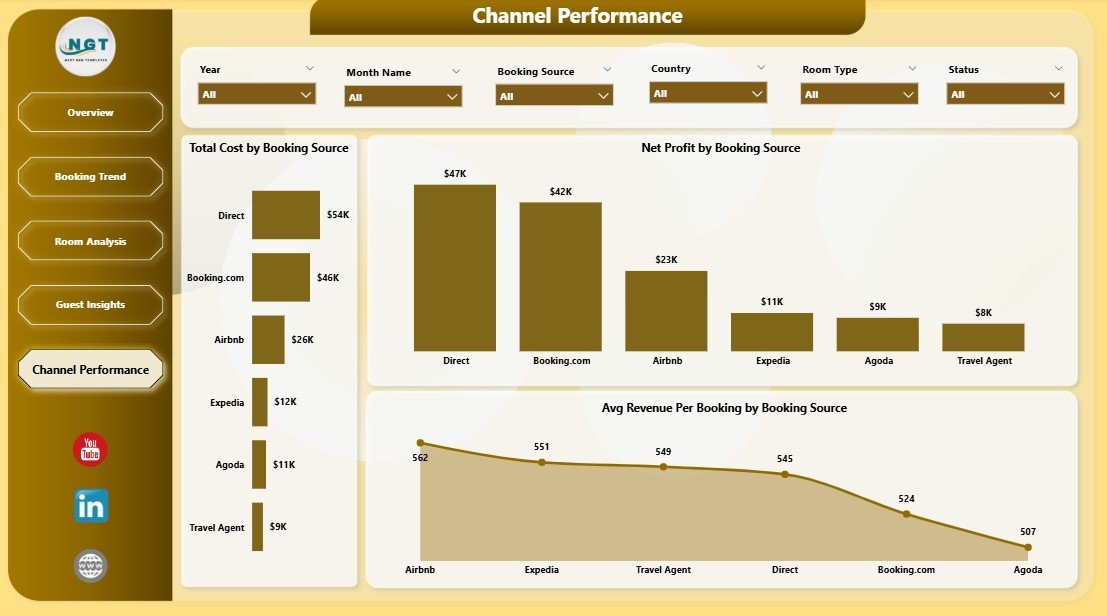
Channel Performance
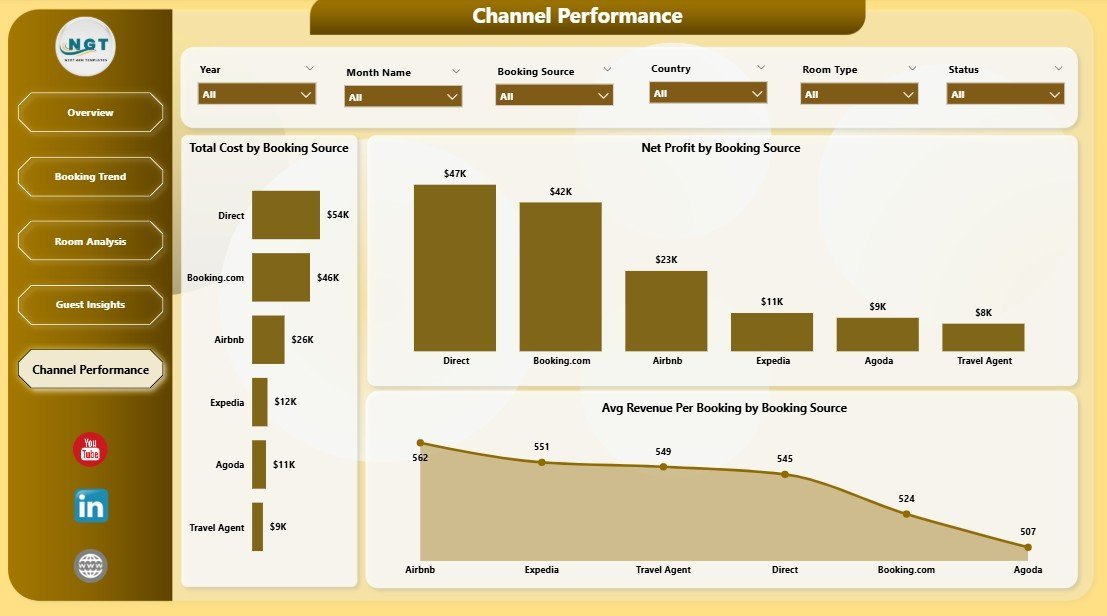
🌐 5. Channel Performance – Booking-channel ROI with Total Cost by Booking Source (shows commission and fulfilment cost by channel), Net Profit by Booking Source (reveals which channels actually make money after fees), and Avg Revenue Per Booking by Booking Source (highlights premium-vs-discount channels). Identifies which OTA, direct, or referral channels deliver the highest margin.
📊 B&B Dashboard in Power BI vs. Tableau Hospitality Template vs. Cloudbeds / Little Hotelier — Where This Fits
| Feature | B&B Dashboard in Power BI | Tableau Hospitality Template | Cloudbeds / Little Hotelier |
|---|---|---|---|
| Cost | $17.99 one-time | $15-$70 / user / month (Tableau license) | $70-$300 / property / month |
| Platform | Power BI Desktop (free) | Tableau Desktop / Cloud | Cloud SaaS PMS |
| Setup time | Under 10 minutes | 1-2 hours (data model setup) | 2-4 weeks onboarding |
| Real-time team collaboration | ✅ Power BI Service publish | ✅ Tableau Cloud | ✅ Native |
| Mobile access | ✅ Power BI mobile app | ✅ Tableau Mobile | ✅ Native app |
| Customizable visuals and DAX | ✅ Fully editable | ✅ Fully editable | Limited / paid add-ons |
| 5 hospitality-specific report pages | ✅ Built-in | Build from scratch | Fixed PMS reports |
| Year-1 cost (1 user, 1 property) | $17.99 | $180-$840+ | $840-$3,600 |
| Channel manager / OTA sync | ❌ (manual data entry) | ❌ (manual data entry) | ✅ Automated |
For independent B&B owners who want professional Power BI analytics without recurring SaaS or BI license fees, the B&B Dashboard in Power BI sits in the sweet spot.
👥 Who This Template Is For — and Who It’s Not For
✅ This template is built for:
- Independent B&B owners running 1-10 rooms who want Power BI analytics without hiring a BI consultant
- Small inn and guesthouse operators wanting interactive, drillable revenue and channel reports
- Hospitality consultants delivering Power BI deliverables to small-property clients
- Boutique vacation-rental hosts who already use Power BI Desktop for other reporting
- Hospitality students learning Power BI through a real-world bookings dataset
❌ This template is NOT for:
- Large hotel chains needing real-time channel-manager OTA sync (Cloudbeds-class PMS is the right tool)
- Owners who don’t have Power BI Desktop installed or aren’t comfortable refreshing data
- Properties needing automated guest messaging, payment processing, or front-desk workflows
⚙️ How to Use the B&B Dashboard in Power BI
- Download the .pbix file and open it in Power BI Desktop (free from Microsoft).
- In the Home tab, click Transform Data > Data Source Settings to connect the data source to your own bookings file.
- Click Refresh on the Home tab — every KPI card and visual updates automatically.
- Walk through the five pages: Overview, Booking Trend, Room Analysis, Guest Insights, Channel Performance.
- Use the slicers on each page to filter by booking source, room type, guest type, country, or payment method.
- Publish to Power BI Service to share with your team and access the report from any browser or mobile device.
💼 Real-World Use Cases
Maria runs a 6-room countryside B&B in Tuscany. She uses the B&B Dashboard in Power BI to compare monthly Net Profit across Booking.com, Airbnb, and direct website channels — and discovered direct bookings carried a 22% higher profit margin. After redirecting marketing spend toward her own website and email list, she saved roughly €4,200 in OTA commissions over the year while keeping occupancy steady.
James operates a 4-room coastal guesthouse in Cornwall. He pointed the dashboard at 18 months of reservation history and used the Booking Trend page to confirm his peak season runs May to September. With that pattern in front of him, he negotiated a flexible off-season rate with his housekeeping contractor and now uses Guest Insights to plan targeted email campaigns to past UK and German guests in February.
Priya, a hospitality consultant in Mumbai, uses the dashboard for client work. She loads each B&B client’s last 12 months of bookings, publishes the report to Power BI Service, and shares interactive links with owners — no $1,200 BI license required and no rebuilding visuals from scratch every project.
❓ Frequently Asked Questions
What KPIs does the B&B Dashboard in Power BI track?
The B&B Dashboard in Power BI tracks 5 primary KPIs — Total Revenue, Total Cost, Total Nights Booked, Net Profit, and Avg Revenue Per Booking — across 13 interactive visuals covering booking trends, room analysis, guest segments, country revenue, payment methods, and channel performance.
How long does setup take for the B&B Dashboard in Power BI?
Setup takes under 10 minutes. Open the .pbix in Power BI Desktop, point the data source at your bookings file using Transform Data > Data Source Settings, click Refresh, and the entire B&B Dashboard in Power BI updates automatically with no DAX changes required.
How does this compare to Cloudbeds or Little Hotelier?
Cloudbeds and Little Hotelier are full property-management systems costing $70-$300 per property per month with channel-manager OTA sync. The B&B Dashboard in Power BI is a one-time $17.99 analytics layer for owners who manage bookings manually but want professional, drillable reports on top.
Can I customize the room types, booking sources, and countries?
Yes. Add or rename any room type, booking source, country, payment method, or guest type directly in your bookings data source, click Refresh, and the B&B Dashboard in Power BI adapts automatically. No DAX edits or model changes are needed for new categories.
Do I need a paid Power BI license to use this?
No. The B&B Dashboard in Power BI runs entirely on free Power BI Desktop for Windows. A Power BI Pro license is only needed if you want to publish the report to Power BI Service for online team sharing — single-user desktop use is free.
Can I add my own KPIs or visuals to the B&B Dashboard in Power BI?
Yes. The .pbix file is fully editable — add new measures, calculated columns, custom visuals, or AI-driven Q&A panels alongside the existing ones. The B&B Dashboard in Power BI has no protection or hidden objects, so it’s a strong starting point for further DAX customization.
Is this template a one-time payment?
Yes. The B&B Dashboard in Power BI is a one-time $17.99 purchase with lifetime access — no subscription, no per-user fees, and no recurring charges. You receive an instant download immediately after checkout.
👤 About the Author
Built by PK — Microsoft Certified Professional with 15+ years of Excel, Google Sheets, and Power BI experience. Founder of NextGenTemplates, reaching 300K+ subscribers across YouTube channels (@PK-AnExcelExpert, @NextGenTemplates, @NeoTechNavigators). Every template is hand-built and tested before release.
🔗 Explore Related Templates
📊 Hotel and Hospitality Revenue Dashboard in Power BI – Broader Power BI analytics for full-service hotels covering room revenue, F&B revenue, occupancy, and property comparisons.
🏨 Boutique Hotels Dashboard in Power BI – Power BI dashboard tailored for boutique hotel operations, room performance, and guest analytics.
🏠 Airbnb Host Dashboard in Power BI – For Airbnb hosts tracking listings, occupancy, guest reviews, and channel revenue with Power BI.
Also available as: B&B Dashboard in Excel for those who prefer pivot-driven Excel reporting. Browse the full collection of Power BI Dashboard Templates on NextGenTemplates for more analytics across industries.
📖 Click here to read the Detailed Blog Post
🎥 Visit our YouTube channel for step-by-step video tutorials
👉 YouTube.com/@NextGenTemplates
📅 Last updated: April 2026


Reviews
There are no reviews yet.