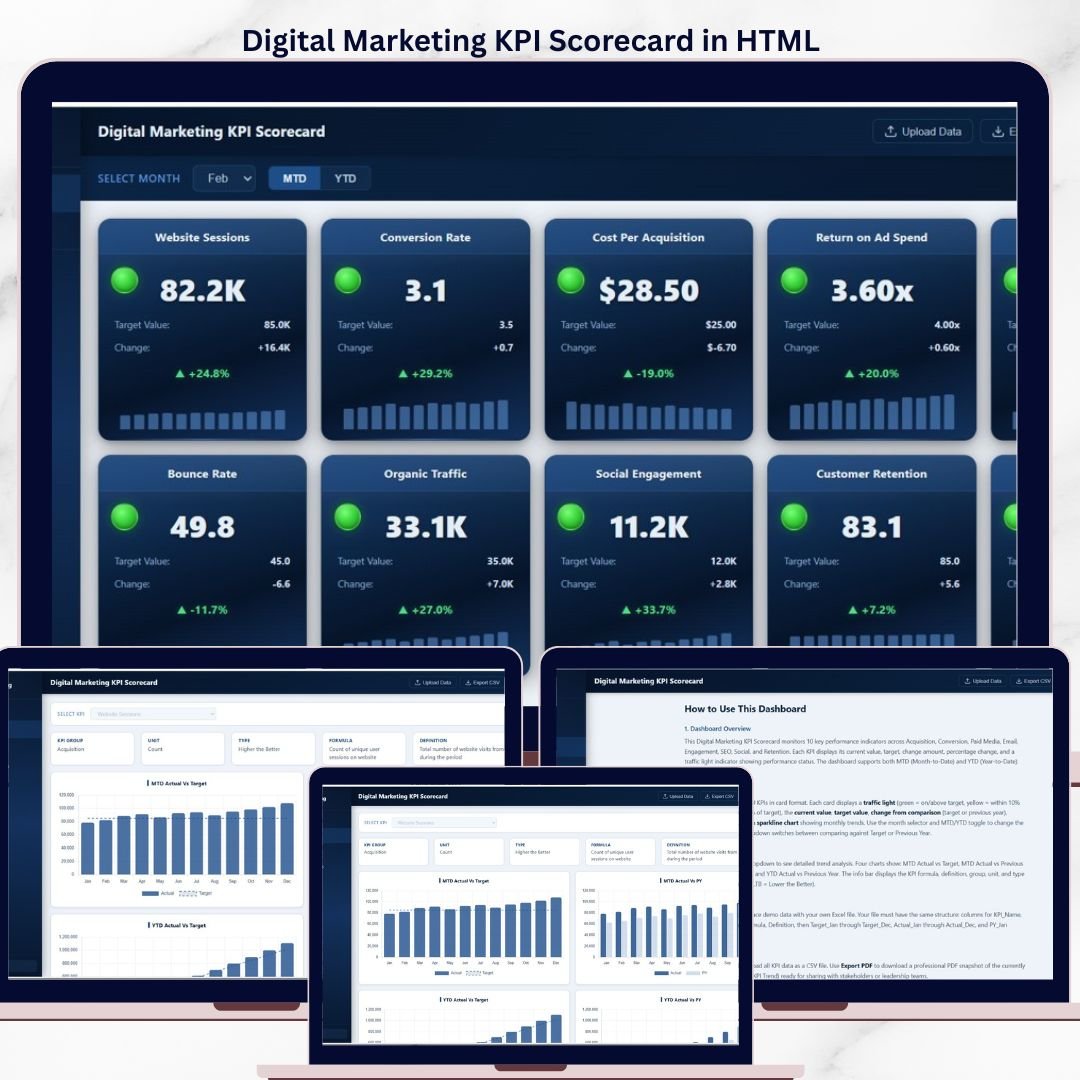

The Digital Marketing KPI Scorecard in HTML tracks 10 key performance indicators across 3 interactive pages, with traffic-light status indicators, sparkline trends, and MTD/YTD comparison toggles. Setup takes under 5 minutes — just upload your Excel data file and every scorecard metric updates automatically.
🌍 Join 8,400+ teams in 40+ countries using NextGenTemplates to replace paid SaaS tools with one-time-purchase Excel, Google Sheets, Power BI, and HTML templates.
✅ Instant download · One-time payment · No subscription · No per-user fees · Lifetime access
🔑 Key Features of Digital Marketing KPI Scorecard in HTML
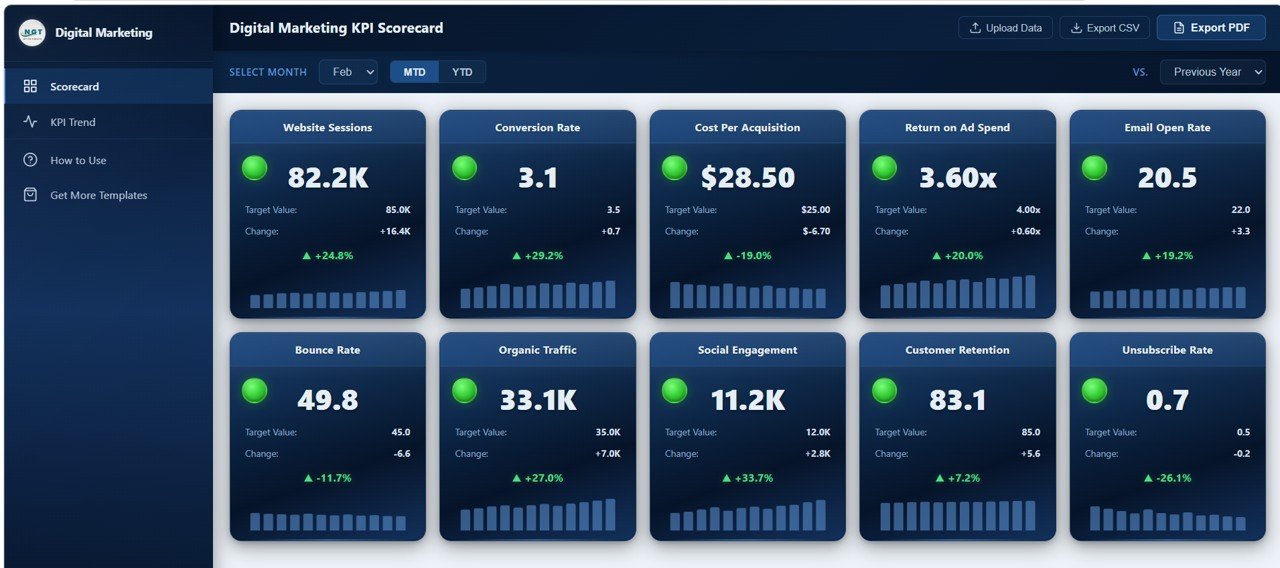
The Digital Marketing KPI Scorecard in HTML monitors 10 marketing metrics including Website Sessions, Conversion Rate, Cost Per Acquisition, Return on Ad Spend, Email Open Rate, Bounce Rate, Organic Traffic, Social Engagement, Customer Retention, and Unsubscribe Rate. Each metric card displays a traffic-light indicator (green, amber, red) based on target thresholds, making it easy to spot underperforming areas at a glance.
📌 The scorecard includes MTD (Month-to-Date) and YTD (Year-to-Date) toggles, allowing you to switch between short-term and long-term views instantly. A built-in comparison dropdown lets you benchmark current performance against Target values or Previous Year figures — no manual calculations needed.
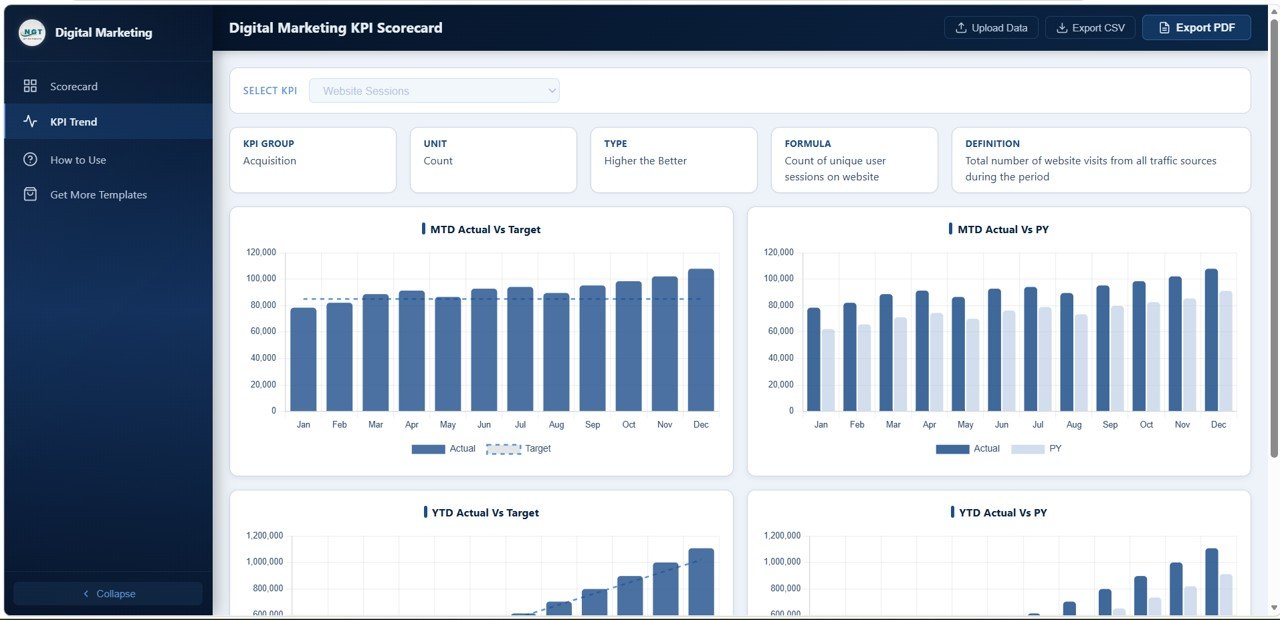
📊 Every KPI card shows the current value, target value, absolute change, percentage change, and a sparkline chart showing monthly trend data. The KPI Trend page offers detailed line-chart analysis for any selected metric, with an info bar displaying KPI Group, Unit, Type, Formula, and Definition. Explore more HTML Dashboard Templates built for instant browser-based analytics.
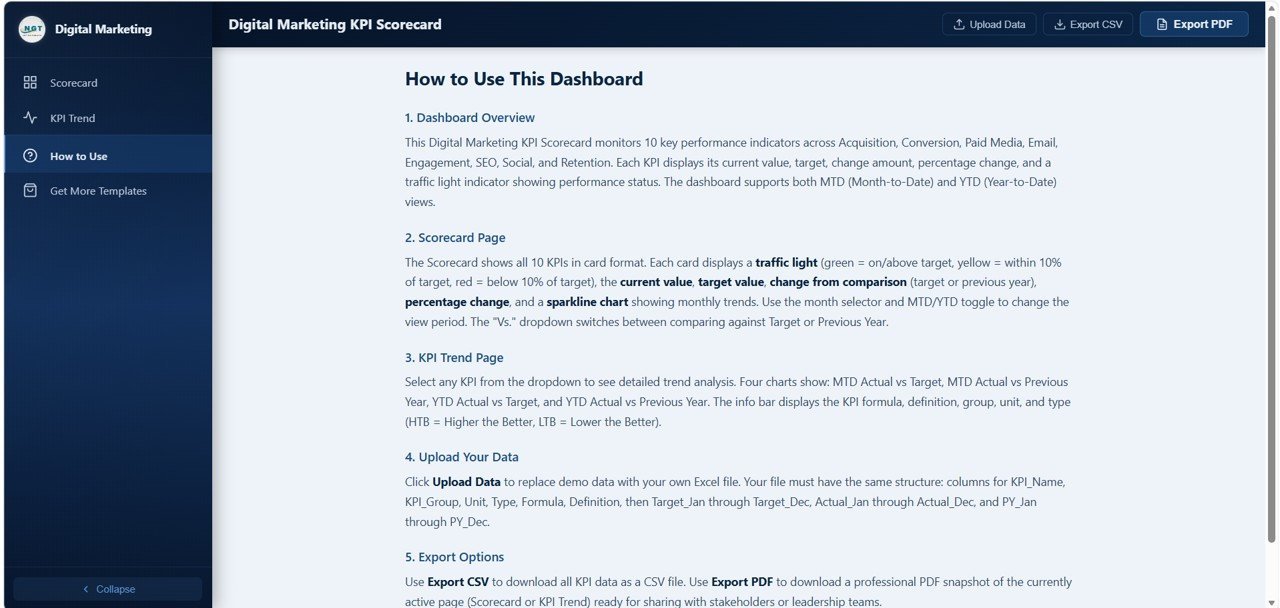
📂 A dedicated How to Use page walks you through the dashboard overview, scorecard navigation, KPI trend features, Excel data upload process, and export options including CSV and PDF downloads. This makes the template accessible to both technical and non-technical marketing teams.
📦 What’s Inside the Digital Marketing KPI Scorecard in HTML
📄 Page 1 — Scorecard Page: 10 KPI cards with traffic-light indicators, current value, target value, change from comparison, percentage change, and sparkline trends. Filters include a Month selector, MTD/YTD toggle, and a Vs. dropdown (Target or Previous Year).
 Digital Marketing KPI Scorecard
📄 Page 2 — KPI Trend Page: Select any KPI from a dropdown to view 4 trend analyses — MTD Actual vs Target by Month, MTD Actual vs Previous Year by Month, YTD Actual vs Target by Month, and YTD Actual vs Previous Year by Month. The info bar shows KPI Group, Unit, Type, Formula, and Definition for each selected metric.
 KPI Trend Page
📄 Page 3 — How to Use Page: Step-by-step instructions covering Dashboard Overview, Scorecard Page navigation, KPI Trend Page features, uploading your data via Excel file, and export options for CSV and PDF downloads.
 How to Use Page
📊 Digital Marketing KPI Scorecard in HTML vs. Google Sheets Scorecard vs. HubSpot Marketing Hub — Where This Fits
| Feature | Digital Marketing KPI Scorecard in HTML | Google Sheets Scorecard | HubSpot Marketing Hub |
|---|---|---|---|
| Cost | $6.99 one-time | $9.99 one-time | $800+ / month (Professional) |
| Platform | Any modern browser | Google Sheets | Cloud SaaS |
| Setup time | Under 5 minutes | Under 10 minutes | 2-4 weeks |
| Traffic-light indicators | ✅ Built-in | Conditional formatting | Custom reports |
| MTD / YTD toggle | ✅ One-click switch | Manual filter | ✅ Built-in |
| Offline access | ✅ Works offline | ❌ Requires internet | ❌ Requires internet |
| Customizable KPIs | ✅ Edit Excel data file | ✅ Edit cells | ✅ With setup |
| Export to PDF / CSV | ✅ Built-in | Google export | ✅ Built-in |
| Year-1 cost at 5 users | $6.99 total | $9.99 total | $9,600+ |
For marketing teams that want instant KPI visibility without paying $800/month for HubSpot, the Digital Marketing KPI Scorecard in HTML sits in the sweet spot.
👥 Who This Template Is For — and Who It’s Not For
✅ This template is built for:
- Digital marketing managers at small-to-medium businesses tracking campaign performance monthly
- Marketing agencies reporting KPI scorecards to clients using a clean, branded dashboard
- Startup founders monitoring marketing spend efficiency across channels
- Freelance marketers tracking SEO, PPC, email, and social metrics in one place
❌ This template is NOT for:
- Enterprise marketing teams needing real-time API connections to Google Analytics or ad platforms
- Organizations requiring multi-user role-based access with audit trails
- Teams needing automated data refresh — this template uses manual Excel uploads
⚙️ How to Use the Digital Marketing KPI Scorecard in HTML
1️⃣ Unzip the downloaded file and open index.html in any modern browser (Chrome, Edge, Firefox, Safari).
2️⃣ Open the included Excel data file and replace the sample KPI values with your actual marketing metrics.
3️⃣ Save the Excel file and upload it using the built-in data upload feature on the How to Use page.
4️⃣ Use the Month selector and MTD/YTD toggle on the Scorecard page to filter your view.
5️⃣ Select any KPI from the dropdown on the KPI Trend page to see detailed monthly trend analysis.
6️⃣ Export your scorecard as PDF or CSV using the built-in export options for reporting.
💼 Real-World Use Cases
Rachel leads digital marketing at a 45-person e-commerce company. She uses the Digital Marketing KPI Scorecard in HTML to present monthly performance reviews to her CEO. The traffic-light indicators instantly show which metrics are on target and which need attention — saving her 3 hours of manual reporting each month. The Digital Marketing Campaign Dashboard in Google Sheets handles her campaign-level analysis while this scorecard gives the executive summary view.
Tom runs a boutique marketing agency serving 8 clients. He customizes the Digital Marketing KPI Scorecard for each client by updating the Excel data file with their specific metrics. The professional HTML layout impresses clients during quarterly reviews, and the PDF export feature lets him attach scorecards directly to his reports. He also uses the Content Marketing KPI Scorecard in Excel for clients focused on content strategy.
Priya is a solo freelance marketer managing SEO, PPC, and email campaigns. She tracks all 10 KPIs in one scorecard instead of switching between Google Analytics, Mailchimp, and ad platform dashboards. The YTD comparison against targets keeps her accountable to quarterly goals, and the sparkline trends help her spot patterns early.
❓ Frequently Asked Questions
What KPIs does the Digital Marketing KPI Scorecard in HTML track?
The Digital Marketing KPI Scorecard in HTML tracks 10 key metrics: Website Sessions, Conversion Rate, Cost Per Acquisition, Return on Ad Spend, Email Open Rate, Bounce Rate, Organic Traffic, Social Engagement, Customer Retention, and Unsubscribe Rate. Each metric includes traffic-light status, target comparison, and sparkline trends.
How does this compare to using HubSpot for marketing KPI tracking?
HubSpot Marketing Hub Professional costs $800+ per month and requires weeks of setup. The Digital Marketing KPI Scorecard in HTML costs $6.99 one-time, works in any browser in under 5 minutes, and tracks 10 KPIs with traffic-light indicators. For teams that need a visual scorecard without a SaaS subscription, this template delivers the same KPI visibility at a fraction of the cost.
Can I customize the KPIs in this HTML scorecard?
Yes. All 10 KPIs are driven by an Excel data file included in the download. You can modify KPI names, targets, actual values, and comparison benchmarks by editing the Excel file and uploading it to the dashboard. No HTML or coding knowledge is required.
Does the Digital Marketing KPI Scorecard work offline?
Yes. Since this is a self-contained HTML file, it runs entirely in your browser without needing an internet connection. Once you open index.html, the full scorecard with all charts, filters, and KPI cards works offline.
How long does it take to set up this marketing scorecard?
Setup takes under 5 minutes. Unzip the download, open index.html in your browser, update the Excel data file with your marketing metrics, and upload it. All 10 KPI cards, traffic-light indicators, and trend charts update automatically.
What file format do I need for my marketing data?
The Digital Marketing KPI Scorecard in HTML accepts data through an Excel (.xlsx) file. The download includes a pre-formatted data template with sample values. Replace the sample data with your actual monthly KPI figures, save the file, and upload it through the dashboard interface.
Can I use this scorecard for client reporting?
Yes. The built-in PDF export feature lets you generate professional scorecard reports for client presentations. Many marketing agencies use this template to deliver monthly KPI reports to clients. The clean HTML layout and traffic-light indicators make the scorecard presentation-ready without additional formatting.
👤 About the Author
Built by PK — Microsoft Certified Professional with 15+ years of Excel, Google Sheets, and Power BI experience. Founder of NextGenTemplates, reaching 300K+ subscribers across YouTube channels (@PK-AnExcelExpert, @NextGenTemplates, @NeoTechNavigators). Every template is hand-built and tested before release.
🔗 Explore Related Templates
📊 Marketing Dashboard in HTML — Full multi-page marketing analytics dashboard with charts, KPIs, and interactive filters for campaign-level analysis.
📊 YouTube Channel Analytics Dashboard in HTML — Track video performance, subscriber growth, and engagement metrics in a browser-based dashboard.
📊 PPC Campaign KPI Dashboard in Google Sheets — Monitor paid advertising KPIs including CPC, CTR, and ROAS across multiple ad platforms.
Browse all HTML Dashboard Templates and Marketing Templates for more analytics solutions.
📖 Click here to read the Detailed Blog Post
Watch the step-by-step video tutorial:
🎥 Visit our YouTube channel for step-by-step video tutorials
👉 YouTube.com/@NextGenTemplates


Reviews
There are no reviews yet.