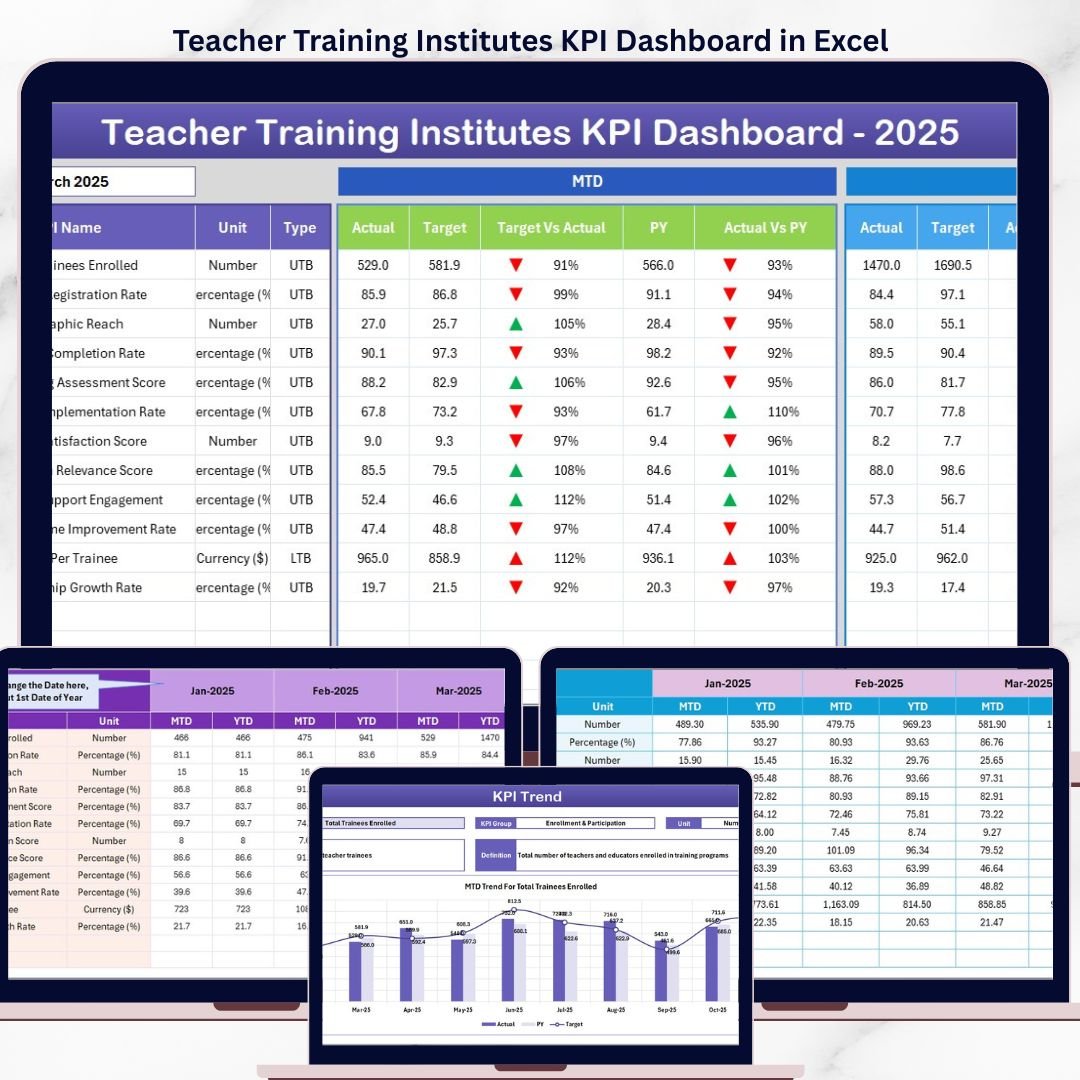
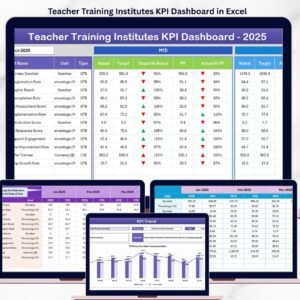
The Teacher Training Institutes KPI Dashboard in Excel monitors KPIs across 7 worksheets, covering MTD and YTD performance with target vs. actual and previous year comparisons. It includes conditional formatting arrows, trend charts, and a dedicated KPI definition sheet. Setup takes under 10 minutes — enter your data and the entire dashboard updates automatically.
🌍 Join 8,400+ teams in 40+ countries using NextGenTemplates to replace paid SaaS tools with one-time-purchase Excel, Google Sheets, Power BI, and HTML templates.
✅ Instant download · One-time payment · No subscription · No per-user fees · Lifetime access
🔑 Key Features of the Teacher Training Institutes KPI Dashboard in Excel
📊 MTD and YTD Tracking with Target and PY Comparison — The Dashboard sheet displays Month-to-Date Actual, Target, and Previous Year figures side by side, along with YTD equivalents. Conditional formatting arrows instantly show whether each KPI is trending up or down against targets and prior-year benchmarks.
📈 Individual KPI Trend Analysis — The KPI Trend sheet lets you select any KPI from a dropdown to view its MTD and YTD trend charts plotting Actual, Target, and Previous Year lines. Each KPI also displays its group, unit, type (Lower the Better or Upper the Better), formula, and definition.
📋 Structured Data Input Across 3 Dedicated Sheets — Separate input sheets for Actual Numbers, Target Numbers, and Previous Year Numbers keep your data organized. Enter values for each KPI by month, and the dashboard calculates everything automatically.
📝 KPI Definition Sheet for Full Transparency — Define each KPI’s name, group, unit, formula, definition, and type (LTB or UTB) in one central location. This ensures every stakeholder understands what each metric measures and how it is calculated.
🏠 Home Navigation Sheet with Quick-Jump Buttons — The Home sheet provides 6 navigation buttons that jump directly to any worksheet, making it easy to move between the Dashboard, KPI Trends, input sheets, and definitions without scrolling through tabs.
🔄 Dynamic Month Selection — Select any month from the dropdown on the Dashboard sheet (range D3), and all MTD and YTD numbers update instantly across the entire workbook. No formulas to edit, no manual recalculation needed.
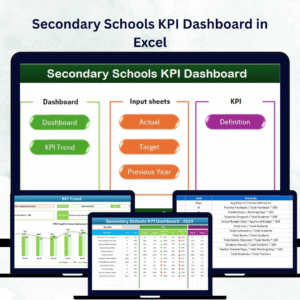
If you manage training programs across Excel and Power BI, check out the Teacher Training Institutes Dashboard in Power BI for advanced interactive filtering. For K-12 education metrics, the Secondary Schools KPI Dashboard in Excel tracks student performance and attendance KPIs.
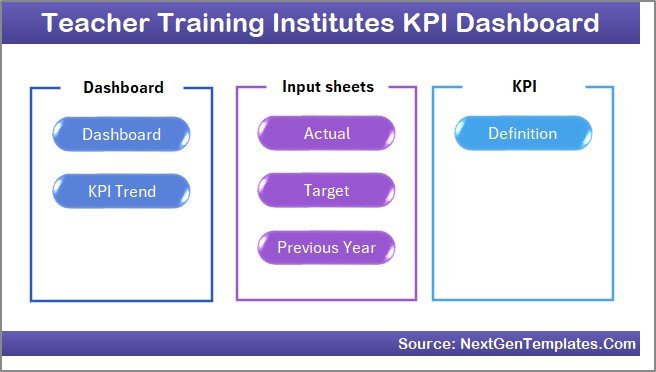
📦 What’s Inside the Teacher Training Institutes KPI Dashboard in Excel
The workbook contains 7 worksheets:
📌 Home Sheet — An index page with 6 navigation buttons to jump directly to the Dashboard, KPI Trend, Actual Numbers, Target Numbers, Previous Year Numbers, and KPI Definition sheets.
 Home Page
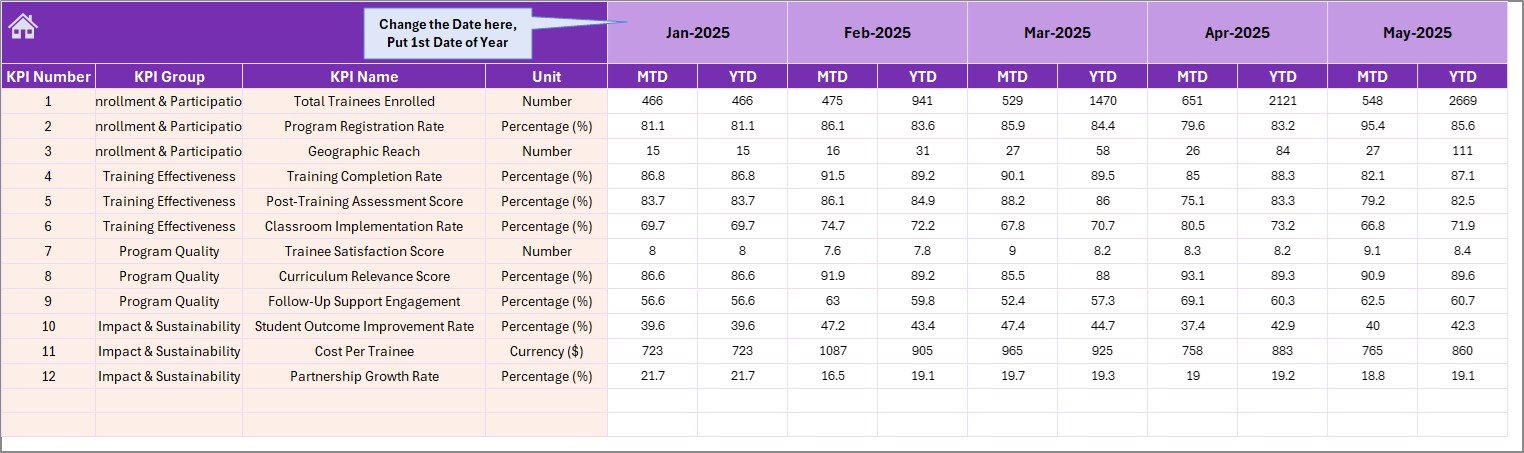
📌 Dashboard Sheet — The main analytics view. Select a month from the dropdown on D3 and see MTD Actual, Target, Previous Year data with Target vs Actual and PY vs Actual comparisons. Conditional formatting up/down arrows highlight performance at a glance.
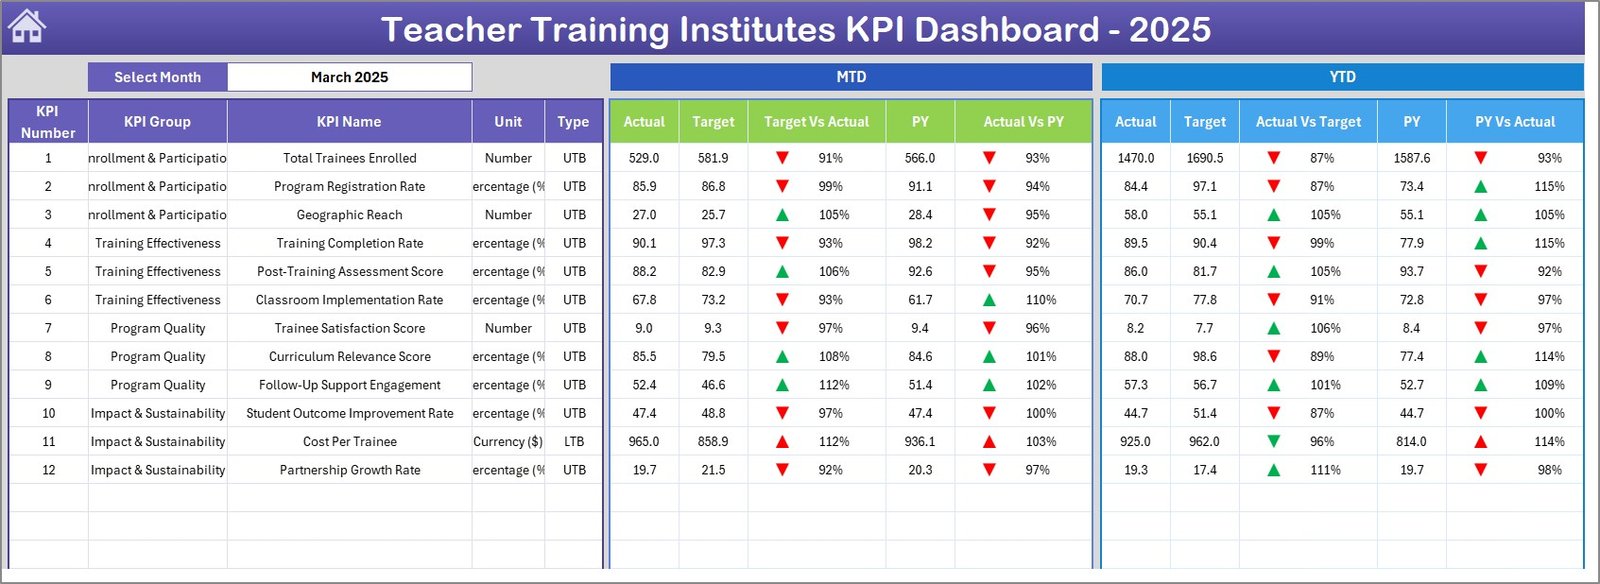 Teacher Training Institutes KPI Dashboard in Excel
📌 KPI Trend Sheet — Select any KPI from the dropdown on C3 to view its KPI Group, Unit, Type (LTB/UTB), Formula, and Definition. MTD and YTD trend charts plot Actual, Target, and PY numbers across months.
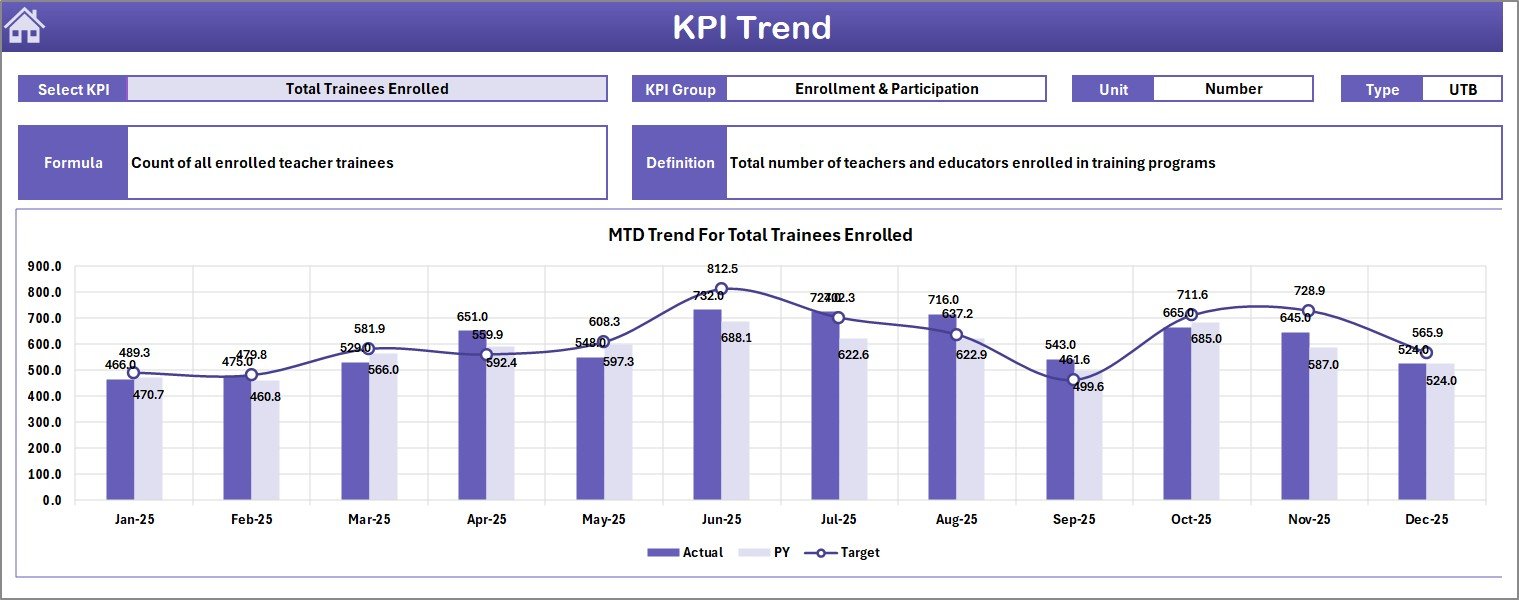 KPI Trend Sheet
📌 Actual Numbers Input Sheet — Enter MTD and YTD actual numbers for each KPI by month. Change the starting month on range E1 to align with your fiscal year.
 Actual Numbers Input Sheet
📌 Target Number Input Sheet — Enter target numbers for each KPI as MTD and YTD values for every month of the year.
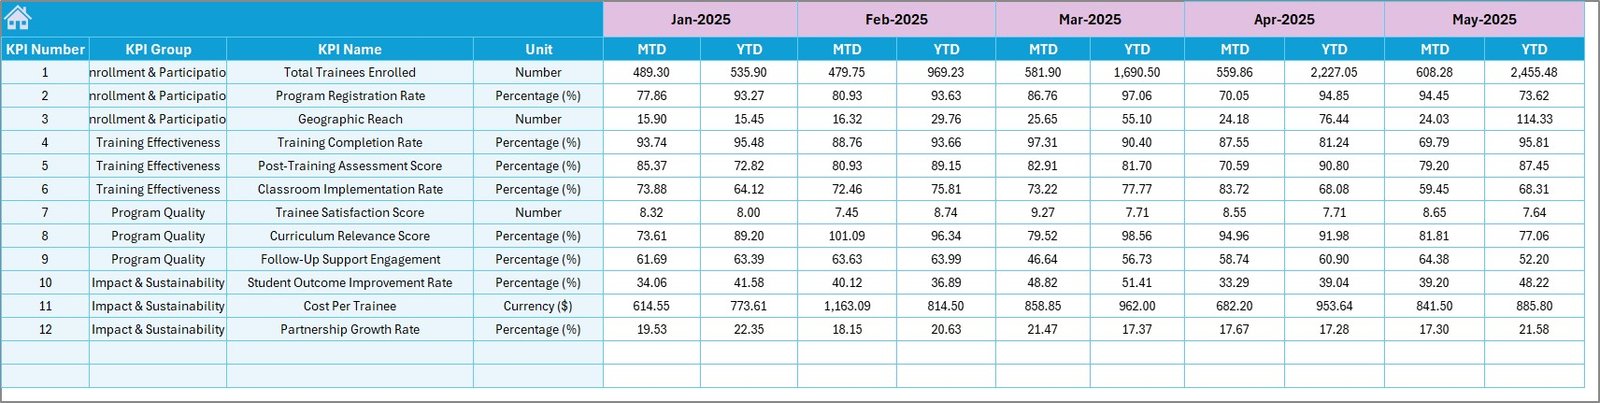 Target Number Input Sheet
📌 Previous Year Number Sheet — Enter previous year data in the same format as the current year to enable year-over-year comparisons on the Dashboard.
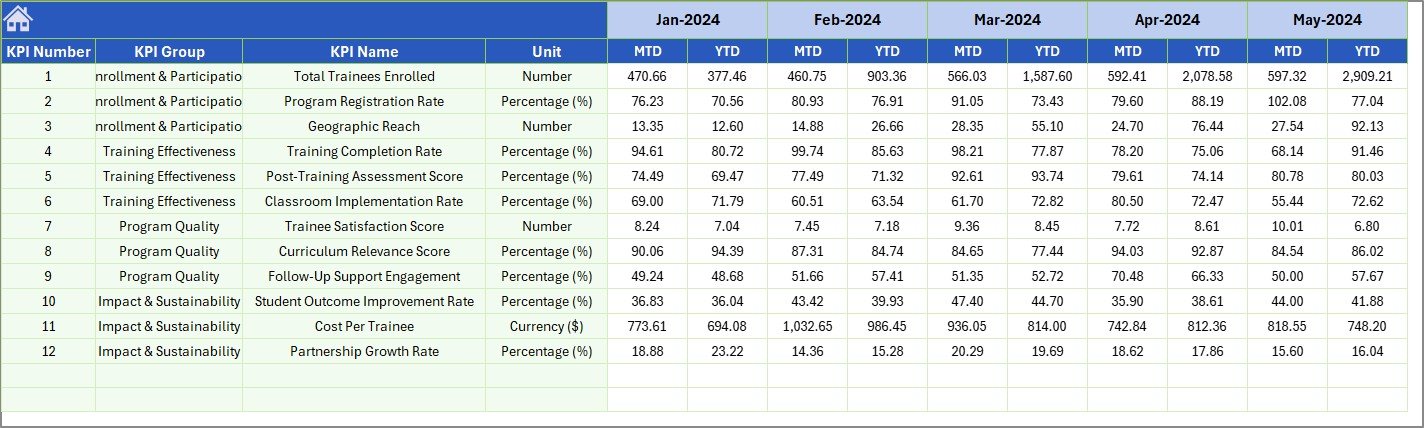 Previous Year Number Input Sheet
📌 KPI Definition Sheet — Define each KPI’s Name, Group, Unit, Formula, Definition, and Type (LTB or UTB). This sheet feeds the KPI Trend page and ensures consistency across the workbook.
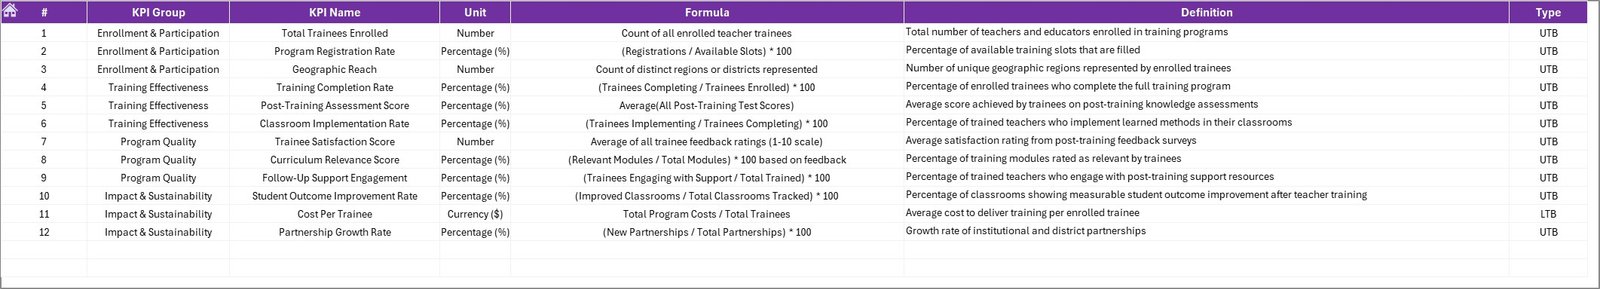 KPI Definition Sheet
Browse more education analytics templates in our Excel Dashboard Templates collection.
📊 Teacher Training Institutes KPI Dashboard vs. Google Sheets Alternative vs. TalentLMS — Where This Fits
| Feature | Teacher Training Institutes KPI Dashboard in Excel | Google Sheets KPI Tracker | TalentLMS / Absorb LMS |
|---|---|---|---|
| Cost | $14.99 one-time | Free (manual build) | $59–$399/month |
| Platform | Microsoft Excel (desktop + online) | Google Sheets (browser) | Cloud SaaS |
| Setup Time | Under 10 minutes | 4–8 hours (build from scratch) | 2–4 weeks onboarding |
| KPI Definitions Built-In | ✅ Yes — dedicated sheet | ❌ Manual | Partial |
| MTD + YTD with PY Comparison | ✅ Automatic | ❌ Manual formulas | ✅ Yes |
| Trend Charts per KPI | ✅ Dynamic dropdown | ❌ Build each chart | ✅ Built-in |
| Customizable KPIs | ✅ Unlimited — add your own | ✅ Manual | Limited to platform fields |
| Year-1 Cost (5 users) | $14.99 total | $0 (DIY effort) | $708–$4,788 |
| Works Offline | ✅ Full offline access | ❌ Requires internet | ❌ Requires internet |
For training institutes that want structured KPI tracking without paying monthly LMS fees, the Teacher Training Institutes KPI Dashboard in Excel sits in the sweet spot.
👥 Who This Template Is For — and Who It’s Not For
✅ This template is built for:
- Training institute directors and program coordinators tracking 10–50 KPIs across certification, attendance, and faculty performance
- Education consultants reporting quarterly training outcomes to school boards or government bodies
- Small to mid-size teacher training centers (5–200 staff) that need structured reporting without enterprise LMS costs
❌ This template is NOT for:
- Large universities needing LMS integration with SSO, API access, and real-time student portals
- Organizations requiring automated data feeds from HRIS or SIS systems — this template uses manual data entry
⚙️ How to Use the Teacher Training Institutes KPI Dashboard in Excel
1️⃣ Open the KPI Definition sheet — Enter your KPI names, groups, units, formulas, definitions, and type (LTB or UTB).
2️⃣ Enter Target Numbers — Go to the Target Number Input sheet and fill in monthly MTD and YTD targets for each KPI.
3️⃣ Enter Previous Year Data — Fill the Previous Year Number sheet with last year’s actual figures for comparison.
4️⃣ Enter Current Year Actuals — Update the Actual Numbers Input sheet monthly with your real MTD and YTD numbers.
5️⃣ View the Dashboard — Go to the Dashboard sheet, select a month from the dropdown on D3, and review all KPIs with target and PY comparisons.
6️⃣ Analyze Individual KPIs — Use the KPI Trend sheet to drill into any single KPI’s monthly trend with Actual vs Target vs PY charts.
💼 Real-World Use Cases
Ravi manages a teacher training institute in Pune with 45 faculty members. He uses this dashboard to track certification pass rates, trainer utilization, and session feedback scores by month. Each quarter, he exports the Dashboard sheet as a PDF for his board review — replacing a 3-hour manual report with a 10-minute data update.
Maria coordinates professional development for a network of 12 schools in Texas. She enters target and actual numbers for teacher attendance, curriculum completion, and post-training assessment scores. The PY comparison helps her demonstrate year-over-year improvement to district administrators without subscribing to a $200/month analytics platform.
Ahmed runs a private B.Ed college in Lahore. He tracks enrollment rates, dropout percentages, faculty-student ratios, and placement rates using this KPI dashboard. The LTB/UTB classification on the KPI Definition sheet helps his team understand which metrics they want to minimize (dropout rate) vs. maximize (placement rate).
❓ Frequently Asked Questions
What KPIs can I track with the Teacher Training Institutes KPI Dashboard in Excel?
You can track any KPI relevant to teacher training — certification pass rates, trainer utilization, session feedback scores, enrollment rates, dropout rates, placement rates, and more. The KPI Definition sheet lets you add unlimited custom KPIs with their formulas and definitions.
Does this dashboard work with Excel for Mac?
Yes. The Teacher Training Institutes KPI Dashboard in Excel uses standard formulas, conditional formatting, and charts. It works on Microsoft 365, Excel 2019, Excel 2021, Excel for Mac, and Excel Online without macros or VBA.
How long does it take to set up this KPI dashboard?
Setup takes under 10 minutes. Define your KPIs in the KPI Definition sheet, enter target and previous year numbers, then update actual numbers monthly. The Dashboard and KPI Trend sheets update automatically.
Can I add more KPIs beyond the sample ones included?
Yes. Add new rows in the KPI Definition sheet and corresponding rows in the Actual, Target, and Previous Year input sheets. The dashboard formulas pick up new KPIs automatically with no structural changes needed.
How does this compare to TalentLMS or Absorb LMS for tracking training KPIs?
TalentLMS and Absorb LMS cost $59–$399 per month and focus on course delivery. This Excel KPI dashboard costs $14.99 one-time and focuses specifically on KPI monitoring with MTD, YTD, target, and previous year tracking — ideal for institutes that already have a separate LMS.
What does LTB and UTB mean in the KPI Definition sheet?
LTB stands for Lower the Better (e.g., dropout rate, cost per trainee). UTB stands for Upper the Better (e.g., pass rate, placement rate). This classification helps the dashboard apply correct conditional formatting arrows for each metric.
Can I change the fiscal year start month?
Yes. On the Actual Numbers Input sheet, change the value on range E1 to your preferred starting month. All monthly columns across the input sheets will adjust accordingly.
👤 About the Author
Built by PK — Microsoft Certified Professional with 15+ years of Excel, Google Sheets, and Power BI experience. Founder of NextGenTemplates, reaching 300K+ subscribers across YouTube channels (@PK-AnExcelExpert, @NextGenTemplates, @NeoTechNavigators). Every template is hand-built and tested before release.
🔗 Explore Related Templates
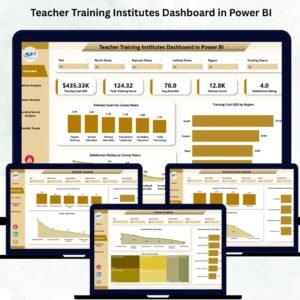
📌 Teacher Training Institutes Dashboard in Power BI — Interactive Power BI version with slicers and drill-through pages for the same training institute metrics.
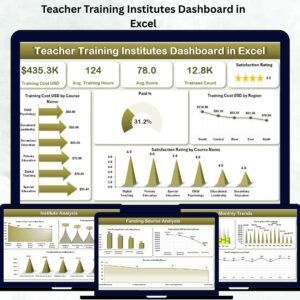
📌 Teacher Training Institutes Dashboard in Excel — A pivot-table-based Excel dashboard covering branch, program, and instructor analysis for training institutes.
📌 Vocational Schools KPI Dashboard in Excel — Track vocational education KPIs with the same MTD/YTD/PY structure.
📌 Education and Learning Process Improvement KPI Dashboard in Excel — Monitor learning process improvement metrics across educational institutions.Teacher Training Institutes KPI Dashboard in Excel
📌 E-learning Platform KPI Dashboard in Excel — Track e-learning platform performance KPIs in the same Excel format.
📖 Click here to read the Detailed Blog Post
🎥 Visit our YouTube channel for step-by-step video tutorials
👉 YouTube.com/@NextGenTemplates


Reviews
There are no reviews yet.