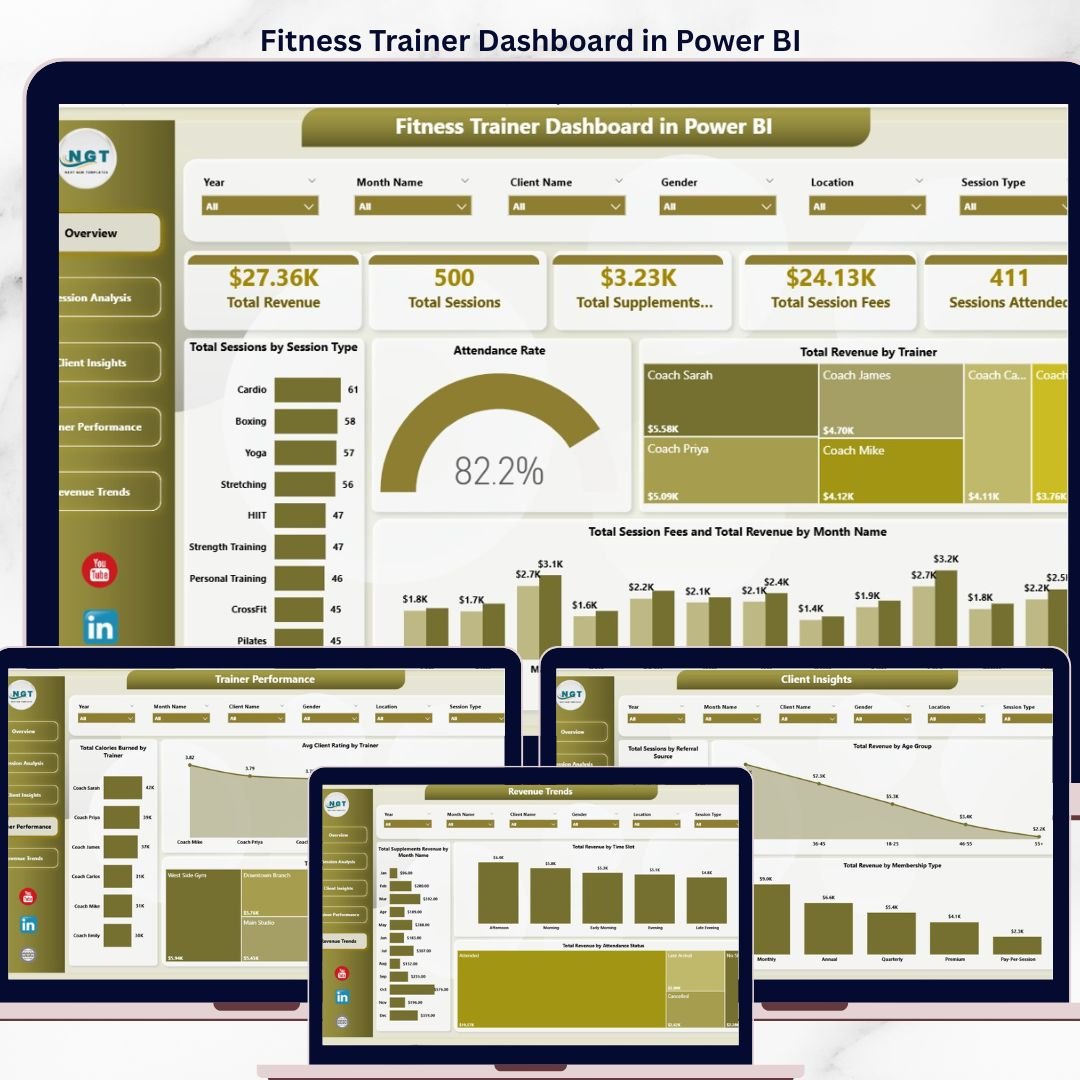

The Fitness Trainer Dashboard in Power BI tracks 5 core KPIs, 14 chart breakdowns, and 5 interactive analysis pages in a single .pbix file — engineered for personal trainers, studio owners, and boutique gym operators who need to see revenue per trainer, session attendance, supplement sales, and client ratings at a glance. Setup takes under 10 minutes: connect your session records, click Refresh, and every card, chart, and slicer updates instantly.
🌍 Join 8,400+ teams in 50+ countries using NextGenTemplates to replace paid SaaS tools with one-time-purchase Excel, Google Sheets, Power BI, and HTML templates.
✅ Instant download · One-time payment · No subscription · No per-user fees · Lifetime access
Overview
🔑 Key Features of Fitness Trainer Dashboard in Power BI
🔹 5 Dedicated Analysis Pages — Overview, Session Analysis, Client Insights, Trainer Performance, and Revenue Trends. Every page carries its own slicer pane so you can filter by trainer, date, location, or membership type without disturbing other views.
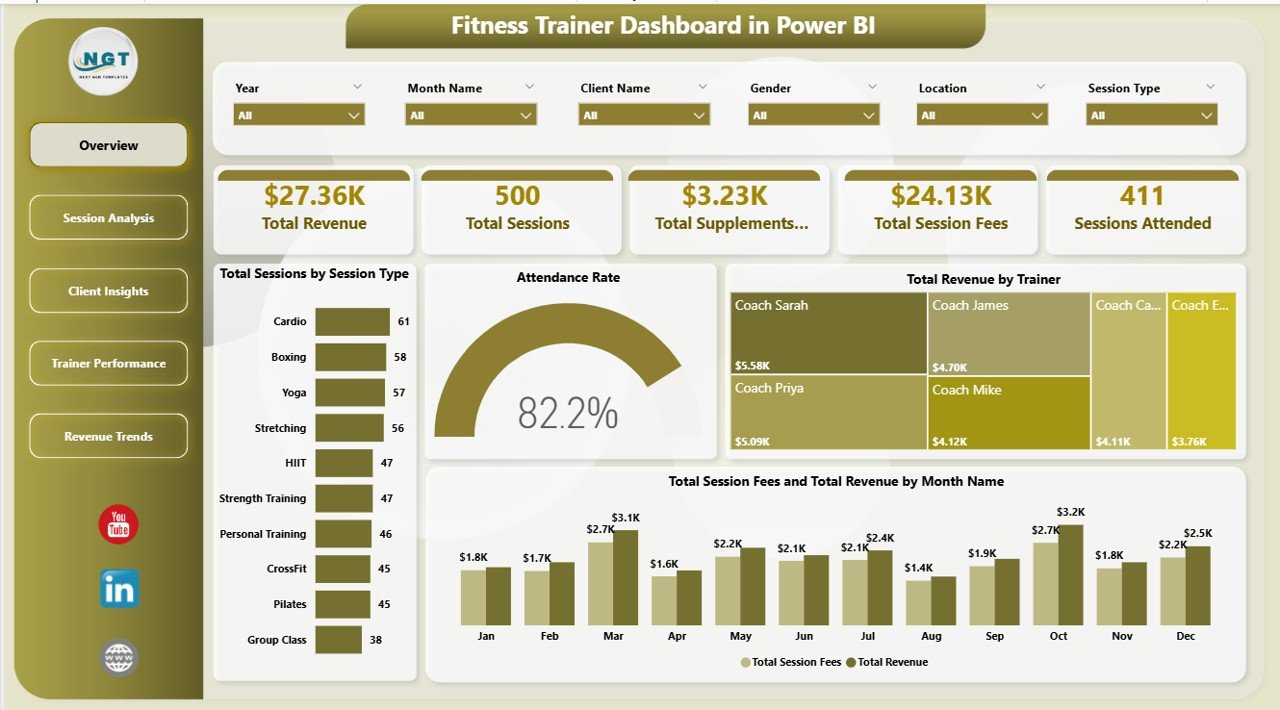
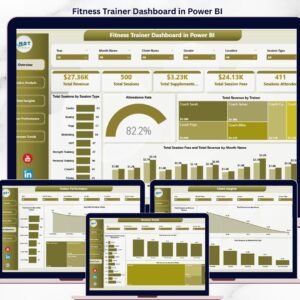
🔹 5 High-Level KPI Cards on the Overview Page — Total Revenue, Total Sessions, Total Supplements Revenue, Total Session Fees, and Sessions Attended. These five numbers give you a one-glance read on whether the business is growing or slipping, week over week.
🔹 14 Pre-Built Analytical Charts — From Total Sessions by Session Type and Attendance Rate on the Overview, to Total Revenue by Equipment Used, Time Slot, Referral Source, Age Group, and Membership Type across the other pages — each chart answers a specific operational question.
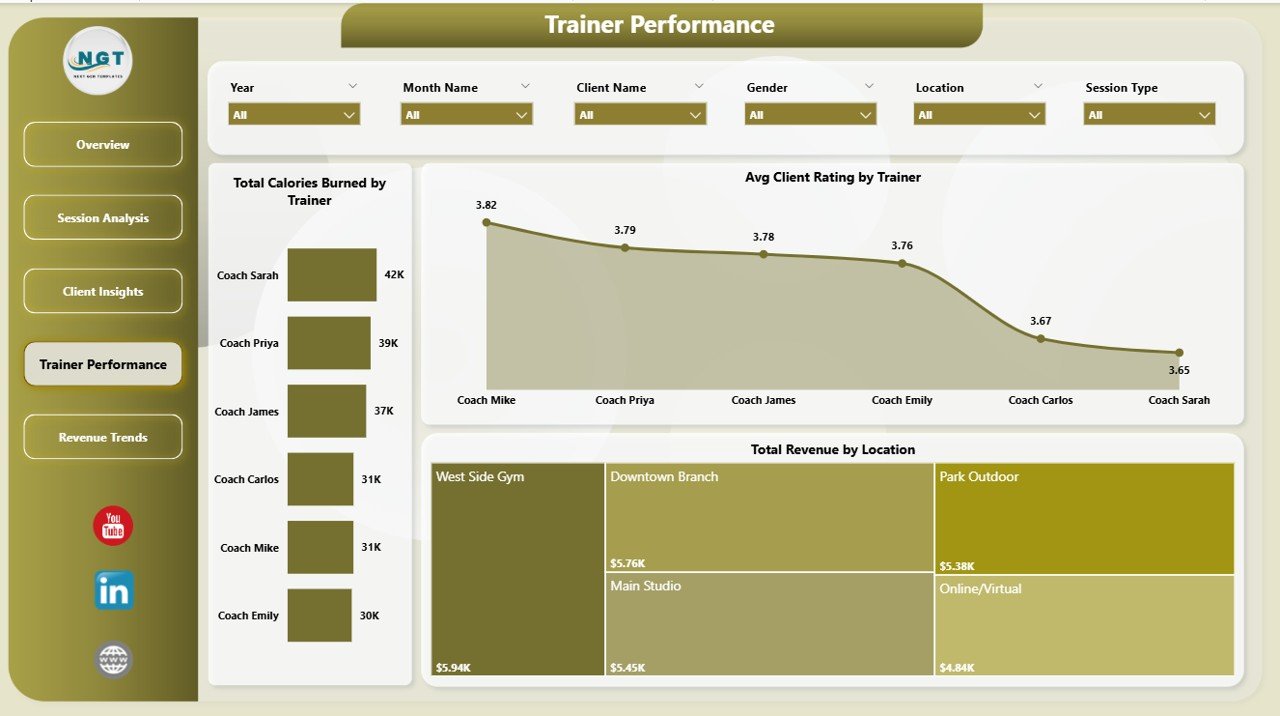
🔹 Trainer Performance Ranking — Compare trainers side-by-side on Total Calories Burned by Trainer, Average Client Rating by Trainer, and Total Revenue by Trainer. Identify your top performers and coaching gaps without pulling a single pivot manually.
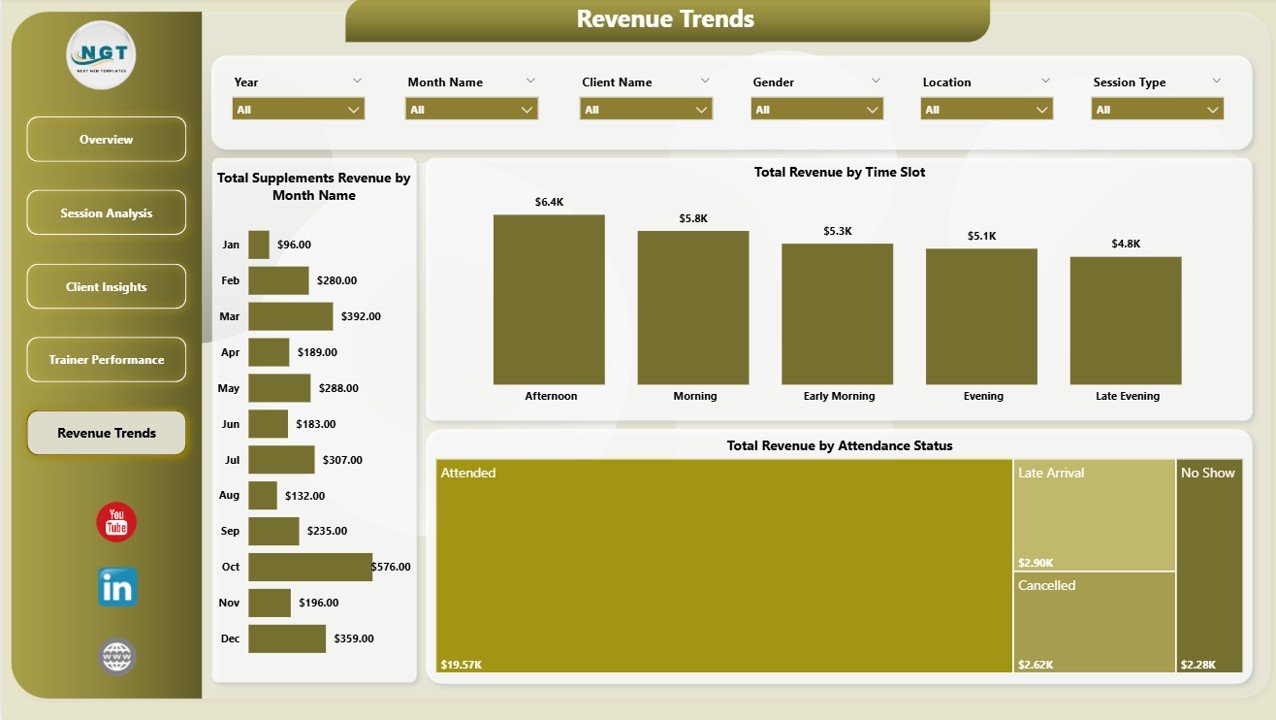
🔹 Revenue & Supplements Tracking — Separate lanes for session fees and supplements revenue, with monthly trend lines across Total Session Fees and Total Revenue by Month Name, plus Total Supplements Revenue by Month Name on the Revenue Trends page.
📦 What’s Inside the Fitness Trainer Dashboard in Power BI
Five interactive pages, 5 KPI cards, 14 visualizations, and cross-page slicer synchronization — all built on a clean Power BI data model you can extend.
1 — Overview Page
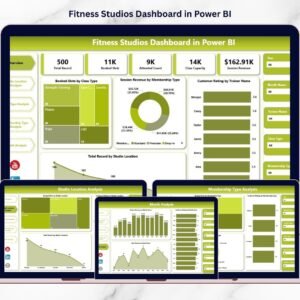
The landing page opens with five KPI cards (Total Revenue, Total Sessions, Total Supplements Revenue, Total Session Fees, Sessions Attended) on top and four analytical charts below — Total Sessions by Session Type (compares popularity across personal training, group classes, and speciality sessions), Attendance Rate (shows how many booked sessions actually happened), Total Revenue by Trainer (ranks trainers by revenue contribution), and Total Session Fees and Total Revenue by Month Name (monthly trend for both revenue streams). Slicers at the top let you filter the entire page instantly.
Overview
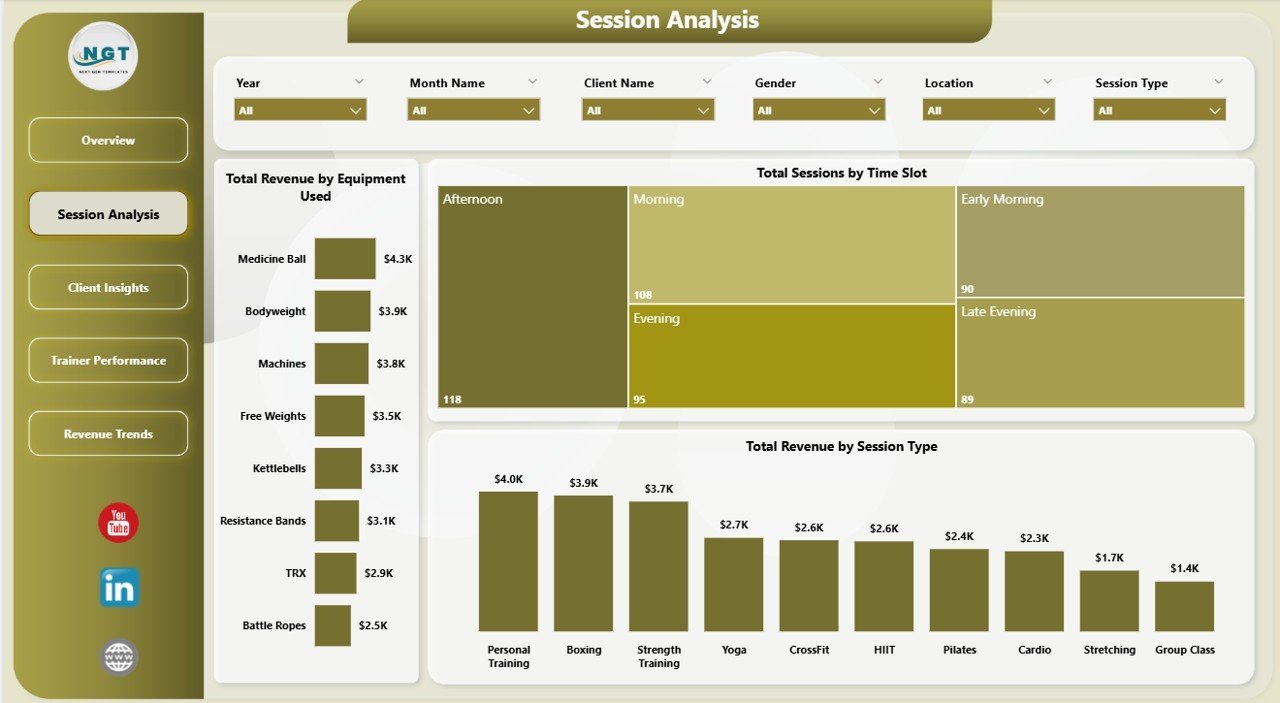
2 — Session Analysis
Operational deep-dive showing Total Revenue by Equipment Used (which machines and gear drive the most paid sessions), Total Sessions by Time Slot (when the studio is busiest), and Total Revenue by Session Type (which session formats produce the highest revenue). Use this page to plan equipment investments and staffing.

Session Analysis
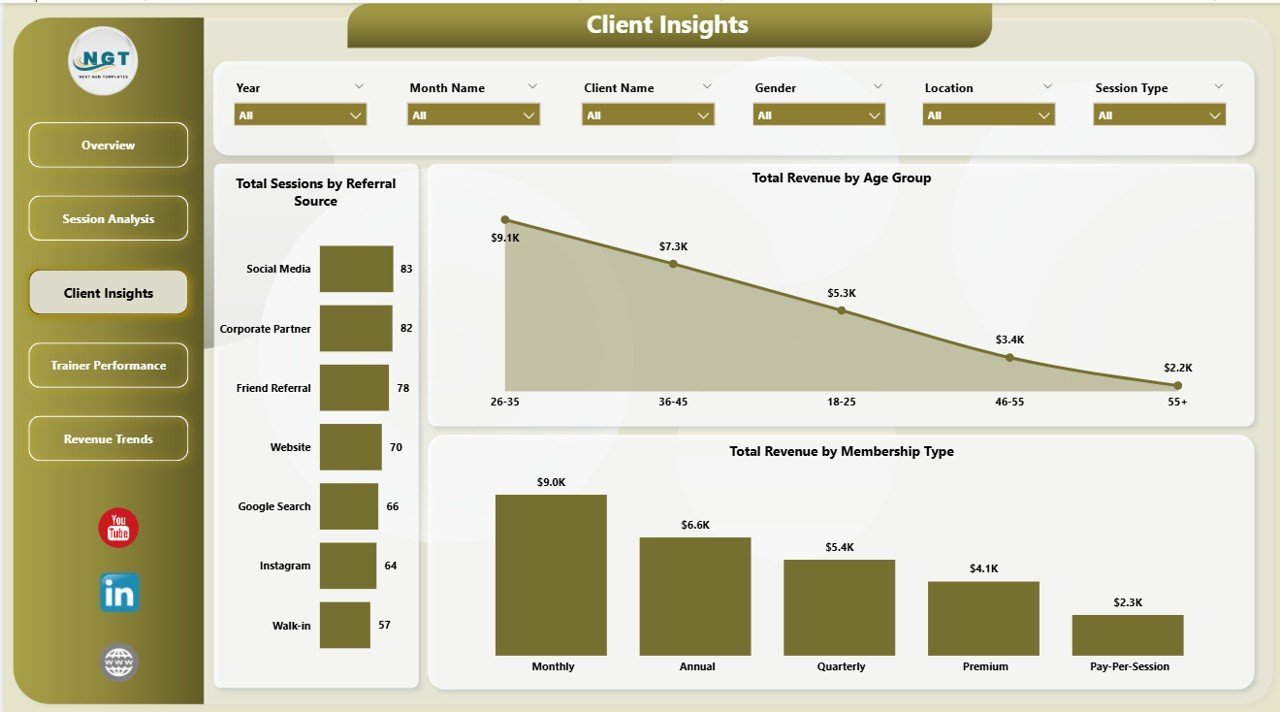
3 — Client Insights
Marketing and retention page featuring Total Sessions by Referral Source (which channel brings the most sessions — social, word of mouth, ads), Total Revenue by Age Group (who spends the most), and Total Revenue by Membership Type (whether premium, monthly, or drop-in drives the bulk of revenue). Guides acquisition spend and package design.

Client Insights
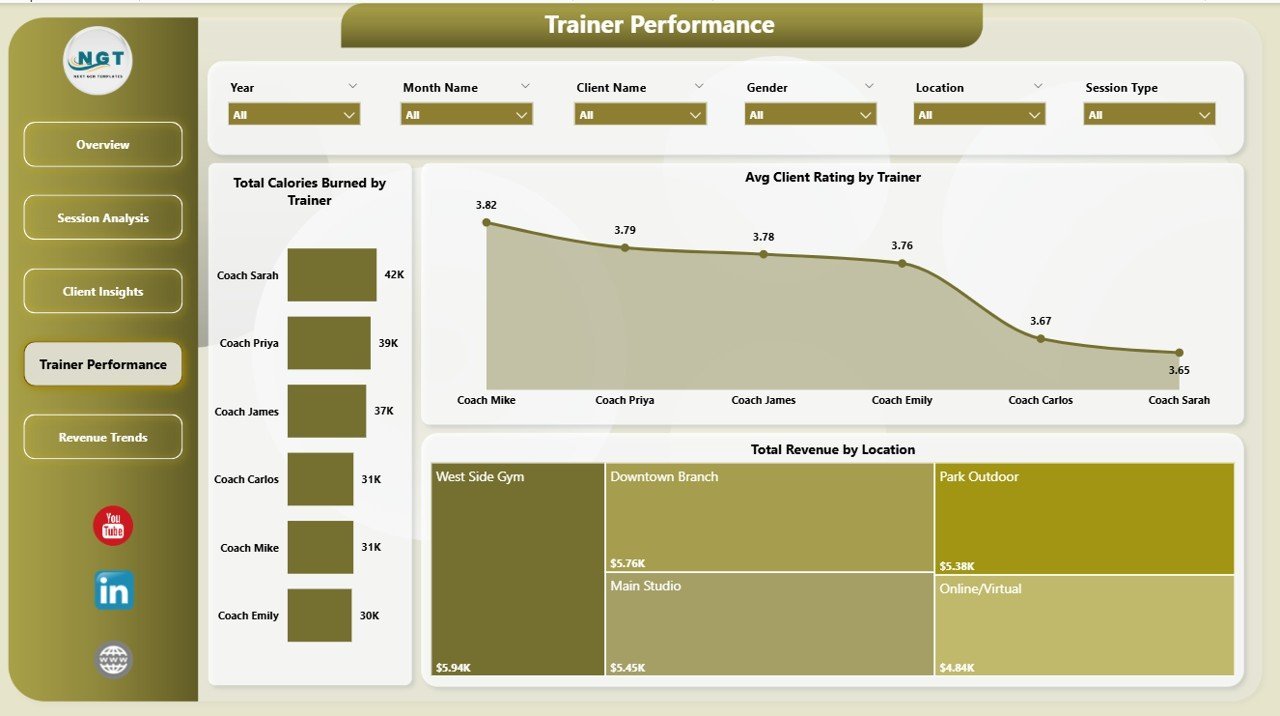
4 — Trainer Performance
Team management view showing Total Calories Burned by Trainer (workout intensity per trainer), Avg Client Rating by Trainer (satisfaction score), and Total Revenue by Location (which studio or outlet performs best). Use this page for quarterly trainer reviews and bonus calculations.
Trainer Performance
5 — Revenue Trends
Financial forecasting page with Total Supplements Revenue by Month Name (secondary income trend), Total Revenue by Time Slot (which hours pay the bills), and Total Revenue by Attendance Status (revenue lost to no-shows vs. revenue captured from attended sessions). Ideal for planning pricing and cancellation policies.
Revenue Trends
📊 Fitness Trainer Dashboard in Power BI vs. Tableau vs. Paid Gym SaaS — Where This Fits
| Feature | Fitness Trainer Dashboard in Power BI | Tableau / Qlik Equivalent | Paid Gym SaaS (Mindbody / Glofox / Trainerize) |
|---|---|---|---|
| Cost | $17.99 one-time | $70 / user / month | $129–$349 / month per studio |
| Platform | Power BI Desktop (free) | Tableau Desktop (paid) | Cloud SaaS (subscription) |
| Setup time | Under 10 minutes | Hours of data modeling | Days of onboarding + training |
| Pre-built KPIs | ✅ 5 KPIs, 14 charts, 5 pages | ❌ Build from scratch | ✅ But locked to vendor’s schema |
| Trainer-level revenue tracking | ✅ Included | Build manually | ✅ In higher tiers only |
| Supplements revenue split | ✅ Separate lane | Build manually | ❌ Often bundled with fees |
| Attendance Rate analysis | ✅ Page 1 KPI | Build manually | ✅ Varies by plan |
| Year-1 cost at 5 users | $17.99 total | $4,200 | $1,548–$4,188 |
| Data ownership | ✅ Your .pbix, your data | ✅ Local + cloud | ❌ Vendor-hosted |
For personal trainers, studio owners, and gym operators who want trainer-level revenue and attendance analytics without paying $1,500+ a year for Mindbody or Glofox, the Fitness Trainer Dashboard in Power BI sits in the sweet spot.
👥 Who This Template Is For — and Who It’s Not For
✅ This template is built for:
- Personal trainers managing 20–200 clients who want to see which sessions and time slots actually pay
- Boutique gym and studio owners with 2–15 trainers on payroll needing quarterly performance reviews
- Fitness franchise managers tracking 2–10 locations and comparing revenue per site
- Bootcamp, yoga, pilates, and crossfit studios selling supplements alongside sessions
- Power BI users who want a finished trainer-analytics template to customize rather than build from zero
❌ This template is NOT for:
- Large chains with 50+ locations needing enterprise SSO, SOC 2, and 24/7 support — go with Mindbody Enterprise
- Trainers who don’t already keep session records in a spreadsheet, CSV, or CRM export
- Teams that need a client-booking and payments system — this is an analytics dashboard, not a gym management platform
- Users who haven’t installed Power BI Desktop and aren’t open to downloading it (it’s free from Microsoft)
⚙️ How to Use the Fitness Trainer Dashboard in Power BI
- Download the .pbix file from your purchase confirmation and save it locally.
- Install Power BI Desktop (free from Microsoft) if you don’t already have it.
- Open the .pbix file — the sample dataset and all five pages load automatically.
- Replace the sample session data with your own records in the data source and click Refresh.
- Use the slicers at the top of each page to filter by trainer, location, session type, or month.
- Publish to Power BI Service if you want to share read-only dashboards with your team.
💼 Real-World Use Cases
Maya runs a 3-trainer personal training studio in Austin. She uses the Fitness Trainer Dashboard in Power BI to review the Trainer Performance page every Monday — Total Revenue by Trainer and Avg Client Rating by Trainer show her instantly who is over-delivering and who needs coaching, without paying $229 a month for Mindbody Core.
Arjun owns a small gym chain with four locations in Pune. He uses the Revenue Trends page and Total Revenue by Location chart to decide where to hire next. The supplements revenue split caught that his smallest outlet was outselling the biggest one on protein — he re-stocked and doubled that income stream in a quarter.
Chloe is a freelance fitness coach with 40 online clients. She drops her weekly Google Sheets export into the Power BI data source, refreshes, and uses Total Sessions by Time Slot and Attendance Rate to see which time blocks are worth keeping and which to drop. She replaced a $49/month booking analytics app with this one-time $17.99 template.
❓ Frequently Asked Questions
What KPIs does the Fitness Trainer Dashboard in Power BI track?
The Fitness Trainer Dashboard in Power BI tracks 5 core KPIs on the Overview page: Total Revenue, Total Sessions, Total Supplements Revenue, Total Session Fees, and Sessions Attended. It also includes 14 analytical charts covering trainer performance, attendance rate, session type, time slot, equipment, and client demographics.
Do I need a paid Power BI license to use this dashboard?
No. The Fitness Trainer Dashboard in Power BI runs fully in Power BI Desktop, which is 100% free from Microsoft. You only need a paid Power BI Pro or Premium license if you want to publish and share the dashboard online through Power BI Service. Local use is always free.
How does this compare to Mindbody or Glofox?
Mindbody and Glofox are full gym management systems costing $129–$349 a month. The Fitness Trainer Dashboard in Power BI is an analytics-only template for $17.99 one-time. If you already have a booking system, this dashboard gives you trainer-level revenue, attendance, and supplements insights Mindbody’s standard reports don’t surface.
How long does setup take?
Setup of the Fitness Trainer Dashboard in Power BI takes under 10 minutes. Download the .pbix, open it in Power BI Desktop, replace the sample data with your own session records, click Refresh, and the five pages, five KPI cards, and 14 charts all update automatically to reflect your business.
Can I add or remove KPIs from this Power BI dashboard?
Yes. The Fitness Trainer Dashboard in Power BI is fully editable. You can edit existing DAX measures, add new charts, change slicers, rebrand with your studio colours and logo, and connect it to SQL, Excel, Google Sheets, or a CSV export — the data model is open for customization.
Is this dashboard Mac-compatible?
Power BI Desktop itself runs only on Windows, so the Fitness Trainer Dashboard in Power BI requires Windows to edit. Mac users can access the published version through Power BI Service in a browser, or run Power BI Desktop inside Parallels, Boot Camp, or Windows on ARM.
Does the dashboard include supplements revenue tracking?
Yes. The Fitness Trainer Dashboard in Power BI has a dedicated Total Supplements Revenue KPI card on the Overview page plus a Total Supplements Revenue by Month Name trend on the Revenue Trends page — ideal for studios that sell protein, supplements, or branded merchandise alongside training sessions.
👤 About the Author
Built by PK — Microsoft Certified Professional with 15+ years of Excel, Google Sheets, and Power BI experience. Founder of NextGenTemplates, reaching 300K+ subscribers across YouTube channels (@PK-AnExcelExpert, @NextGenTemplates, @NeoTechNavigators). Every template is hand-built and tested before release.
🔗 Explore Related Templates
Also available as: Fitness Trainer Dashboard in Excel — same five pages and KPIs, built on pivot tables and slicers for Excel users.
Related picks from our Power BI Dashboard Templates collection:
- 🔹 Gym Fitness Business Dashboard in Power BI — broader gym-management view with membership, class, and retention analytics.
- 🔹 Coaching Business Dashboard in Power BI — for life, health, and business coaches running 1:1 sessions.
- 🔹 Gym Fitness Business Dashboard in HTML — web-based version for embedding in member portals.
📖 Click here to read the Detailed Blog Post
🎥 Visit our YouTube channel for step-by-step video tutorials
👉 YouTube.com/@NextGenTemplates
Watch the step-by-step video tutorial:


Reviews
There are no reviews yet.