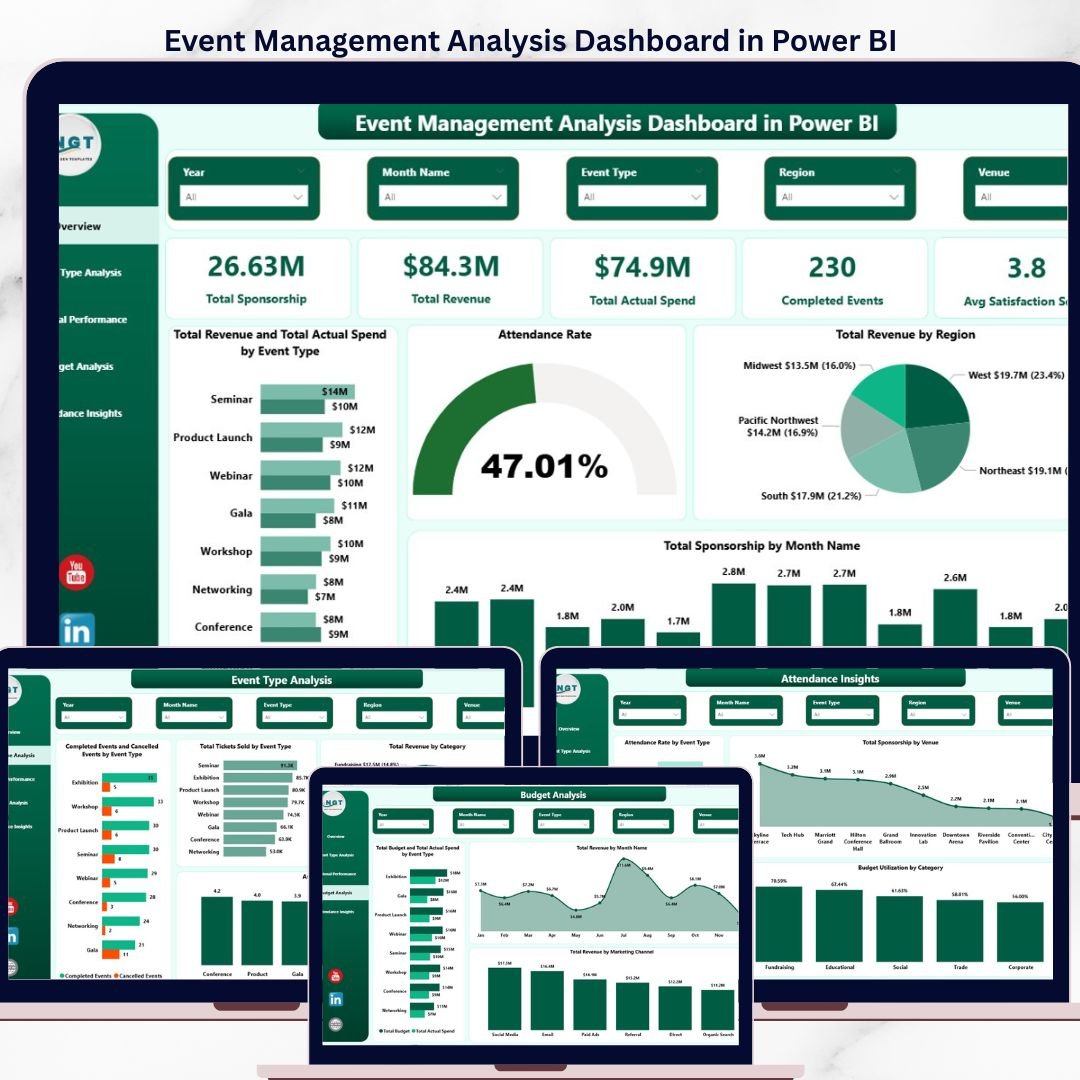


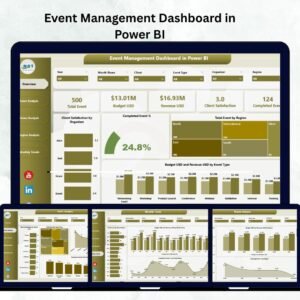
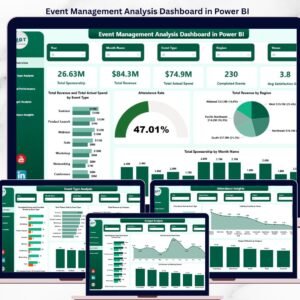
The Event Management Analysis Dashboard in Power BI tracks 5 headline KPIs across 5 interactive pages, with 15+ pre-built charts and 6 slicer filters. Setup takes under 10 minutes — replace the sample event log with your own data, click Refresh, and every visual updates automatically.
🌍 Join 8,400+ teams in 40+ countries using NextGenTemplates to replace paid SaaS tools with one-time-purchase Excel, Google Sheets, Power BI, and HTML templates.
✅ Instant download · One-time payment · No subscription · No per-user fees · Lifetime access
🔑 Key Features of Event Management Analysis Dashboard in Power BI
📊 5-Page Analytical Structure – The dashboard separates the event book of work into five focused pages: Overview, Event Type Analysis, Regional Performance, Budget Analysis, and Attendance Insights. Each page answers a specific set of questions event managers ask weekly, so you stop scrolling through one giant sheet.
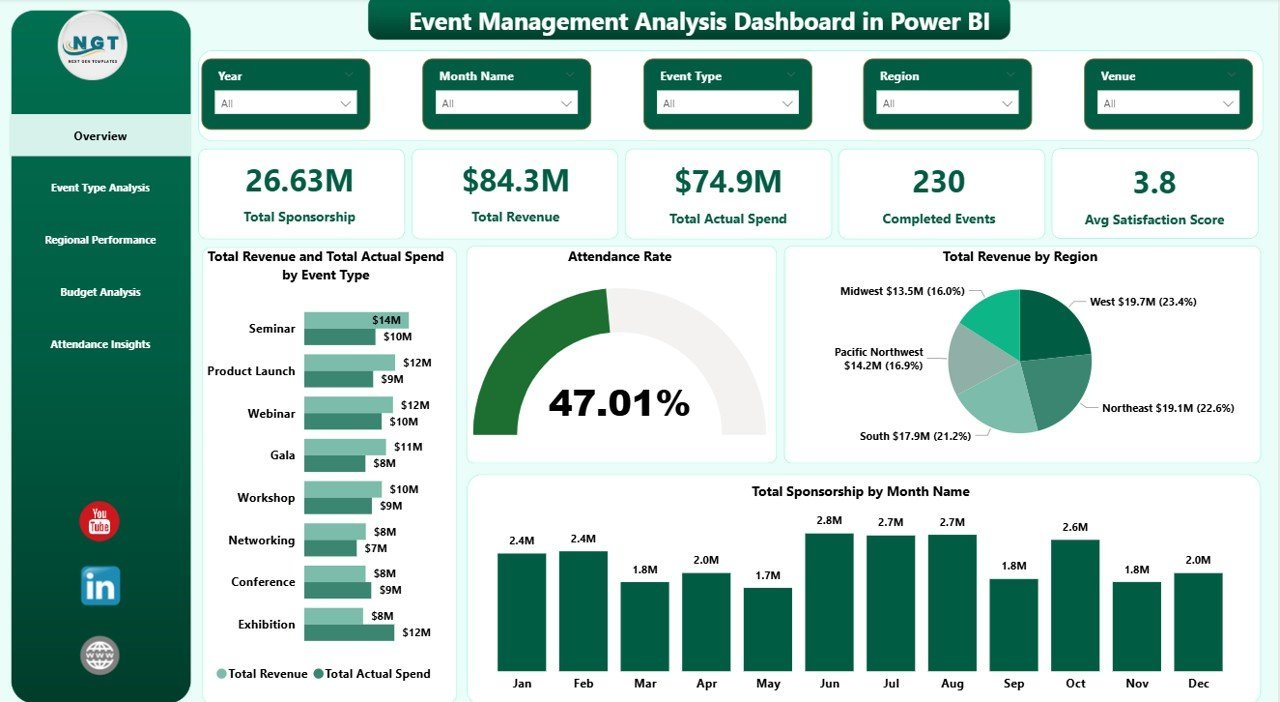
💰 5 Headline KPI Cards on the Overview – Total Sponsorship, Total Revenue, Total Actual Spend, Completed Events, and Avg Satisfaction Score sit at the top of the Overview page. Every card recalculates the moment you apply a slicer filter, so executives get a filtered snapshot in one click.
🎯 Budget vs Actual Spend Tracking – The Budget Analysis page compares Total Budget and Total Actual Spend side-by-side per Event Type, making overruns visible in seconds. Budget Utilization by Category on Attendance Insights adds a category-level view of where money is actually being consumed.
🗺️ Regional and City-Level Drill-down – Regional Performance breaks out Completed vs Cancelled Events by Region, Attendance Rate by Region, and Total Actual Spend by City, so you can pinpoint which cities are losing money and which regions are carrying the program.
📣 Marketing Channel ROI View – Budget Analysis includes Total Revenue by Marketing Channel, showing which channels (Email, Social, Paid Ads, Partners, Direct) actually drive ticket revenue — a 1:1 map between spend and return.
🎟️ Ticket and Attendance Analytics – Event Type Analysis shows Total Tickets Sold by Event Type and Avg Satisfaction Score by Event Type. Attendance Insights shows Attendance Rate by Event Type and Total Sponsorship by Venue so you can see which venues over-deliver.
🎛️ Interactive Slicer Filtering – Every page is wired to cross-filtering slicers: Event Type, Region, Category, Month Name, Marketing Channel, and Venue. Click any chart element and the rest of the page recalculates instantly.
📅 Time-series Sponsorship and Revenue Trends – Total Sponsorship by Month Name (Overview) and Total Revenue by Month Name (Budget Analysis) expose seasonality so you can plan next year’s calendar using last year’s curve.
🔄 Power BI Desktop Native .pbix File – Built in Power BI Desktop (free from Microsoft). No Power BI Pro license needed to open and edit locally. Publish to Power BI Service if you need web sharing.
📦 What’s Inside the Event Management Analysis Dashboard in Power BI
The download is a single .pbix file containing 5 report pages, a data model with sample event data, and all pre-built DAX measures and visuals.
Page 1 — Overview. The Overview page opens with 5 KPI cards showing Total Sponsorship, Total Revenue, Total Actual Spend, Completed Events, and Avg Satisfaction Score. Below the cards are four analytical visuals: Total Revenue and Total Actual Spend by Event Type (side-by-side so you can see profitability per type), Attendance Rate (gauge-style summary of sold vs attended tickets), Total Revenue by Region (geographic revenue mix), and Total Sponsorship by Month Name (seasonality curve). Six slicers on the side let you filter the entire page by Event Type, Region, Category, Month, Marketing Channel, and Venue.

Event Management Analysis Dashboard in Power BI
Page 2 — Event Type Analysis. This page zooms into per-type performance. The four visuals are Completed Events and Cancelled Events by Event Type (stacked comparison to see cancellation ratio), Total Tickets Sold by Event Type (volume view), Total Revenue by Category (revenue mix), and Avg Satisfaction Score by Event Type (quality view). Together they answer the question: which event types are profitable, popular, and loved by attendees?
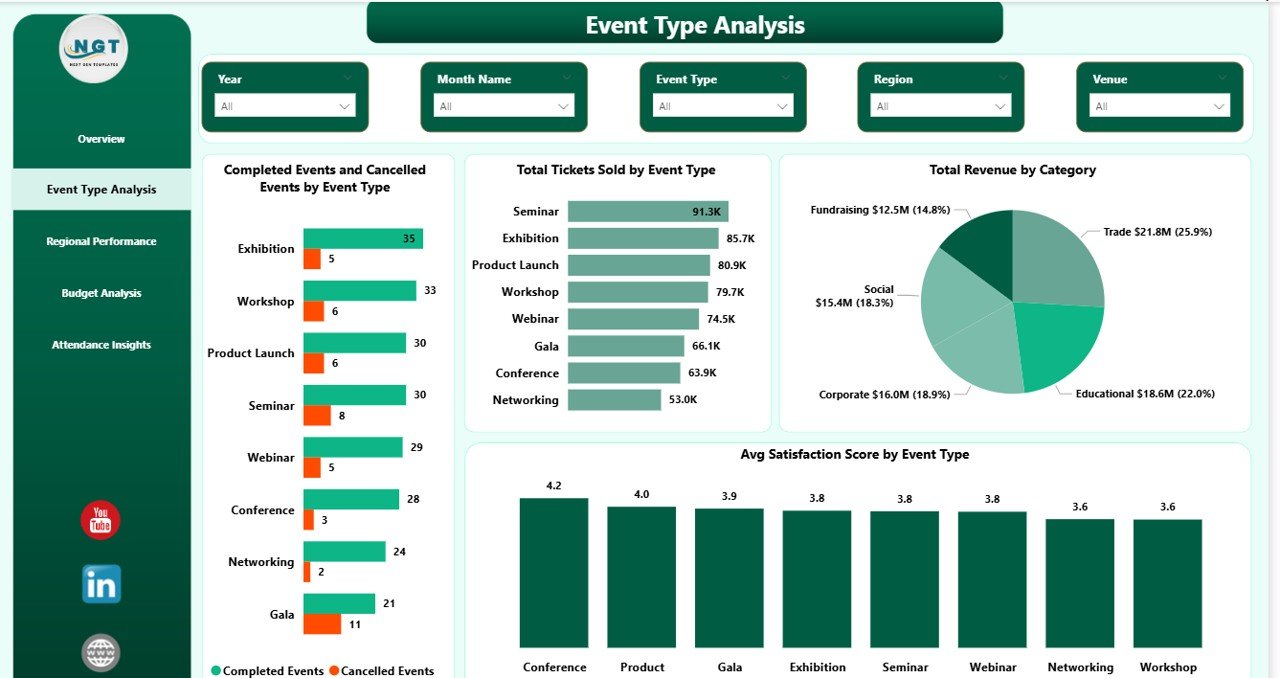
Event Type Analysis
Page 3 — Regional Performance. Breaks out the event portfolio geographically. Completed Events and Cancelled Events by Region shows which regions deliver reliably, Total Actual Spend by City surfaces where money is concentrated, and Attendance Rate by Region measures how well each region fills seats. Use this page in quarterly regional reviews.
Page 4 — Budget Analysis. Answers the CFO’s questions. Total Budget and Total Actual Spend by Event Type exposes over- and under-budget event categories. Total Revenue by Month Name shows the revenue seasonality curve, and Total Revenue by Marketing Channel maps spend to return across Email, Social, Paid Ads, Partners, and Direct. Pair this page with your next budget approval meeting.
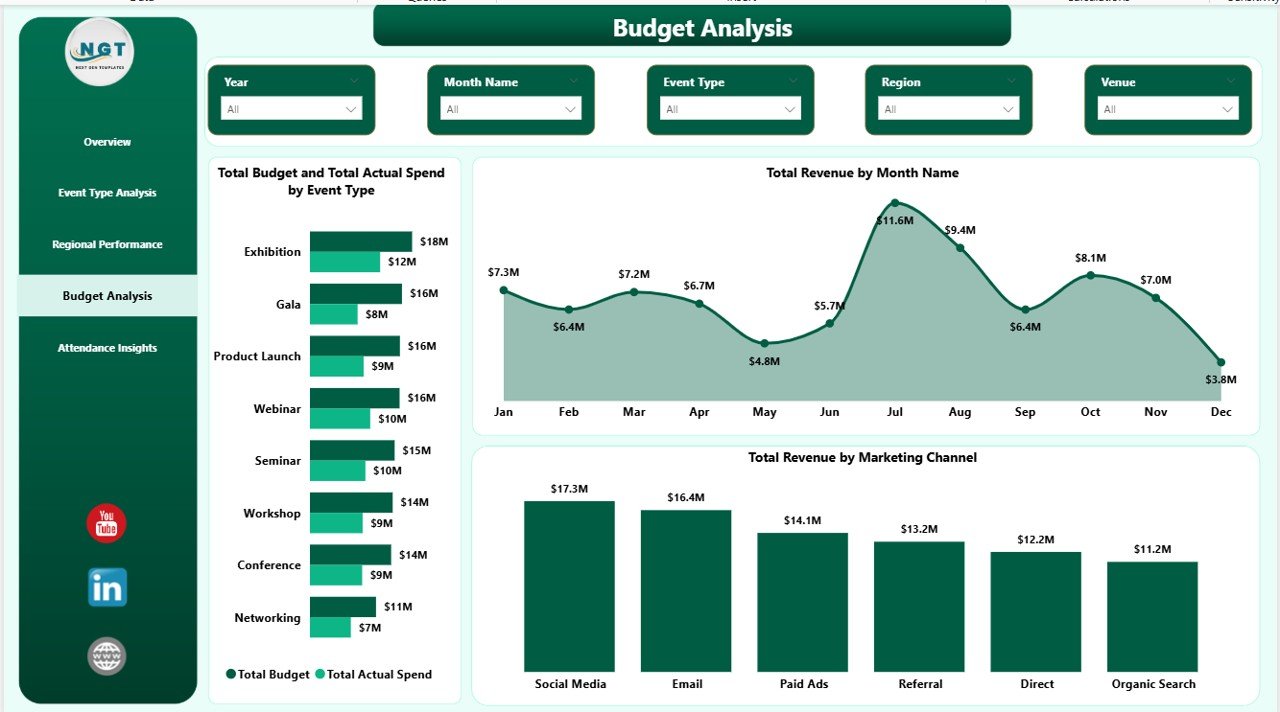
Budget Analysis
Page 5 — Attendance Insights. Focuses on the audience experience. Attendance Rate by Event Type highlights which formats fill seats consistently, Total Sponsorship by Venue identifies which venues attract the most sponsor dollars, and Budget Utilization by Category ties back to the budget page with a consumption view. Ideal for post-event retrospectives and vendor negotiations.
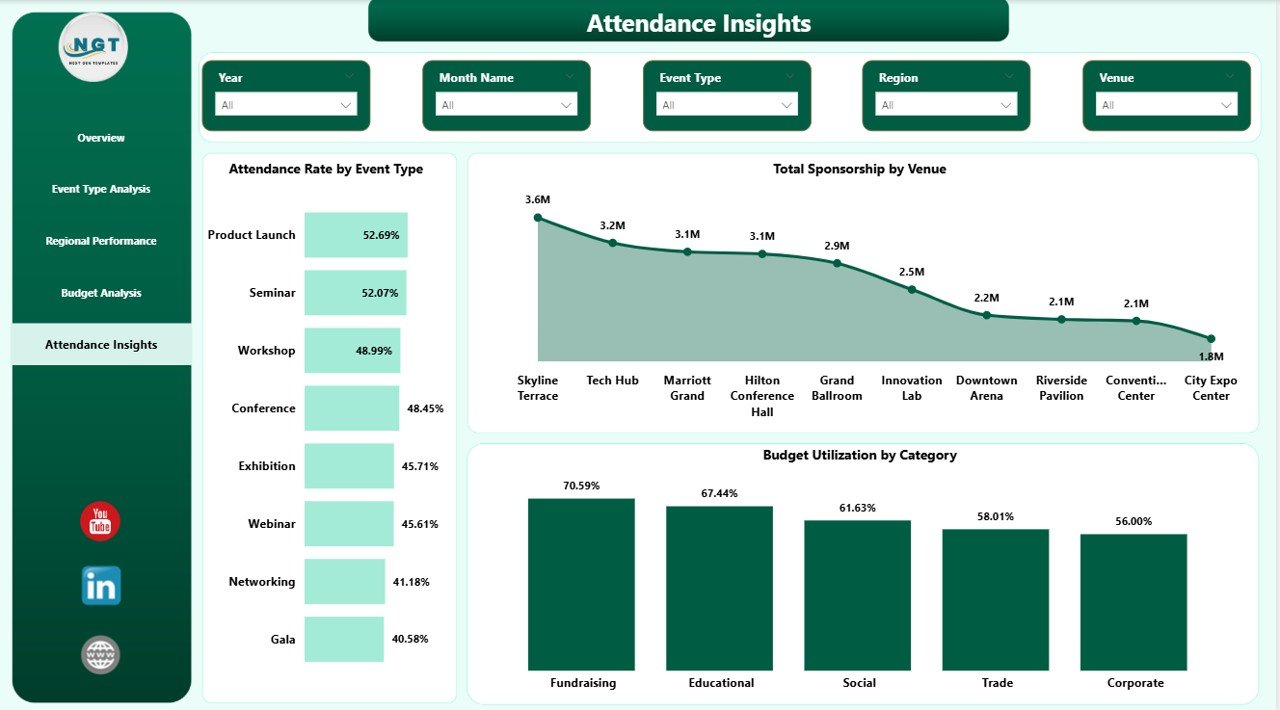
Attendance Insights
📊 Event Management Analysis Dashboard in Power BI vs. Excel Dashboard vs. Paid Event SaaS — Where This Fits
| Feature | Event Management Analysis Dashboard in Power BI | Excel Event Dashboard | Cvent / Bizzabo / Eventbrite Pro |
|---|---|---|---|
| Cost | $17.99 one-time ✅ | $17.99 one-time | $500 – $5,000+ per year |
| Platform | Power BI Desktop (free) ✅ | Microsoft Excel | Web SaaS, vendor-hosted |
| Setup time | Under 10 minutes ✅ | Under 15 minutes | 2–6 weeks onboarding |
| Real-time slicer filtering | Yes — all pages ✅ | Partial (pivot filters) | Yes |
| Pre-built DAX measures | 15+ measures included ✅ | No — formulas only | Proprietary metrics only |
| Data ownership | 100% local .pbix file ✅ | 100% local file | Vendor-hosted cloud |
| Customizable visuals | Fully editable ✅ | Fully editable | Template-locked |
| Year-1 cost at 5 users | $17.99 total ✅ | $17.99 total | $2,500 – $25,000+ |
| Publish to web | Power BI Service (free tier) | Manual export | Built-in |
For event teams that want Cvent-style analytics without the Cvent invoice, the Event Management Analysis Dashboard in Power BI sits in the sweet spot.
👥 Who This Template Is For — and Who It’s Not For
✅ This template is built for:
- Event managers running 10–200 events per year across multiple regions
- Corporate event teams tracking sponsorship, budget, and attendance in one view
- Marketing teams measuring event ROI by channel and category
- Agencies reporting to clients on completed vs cancelled events and satisfaction scores
- Analysts who already use Power BI and want a pre-built event data model
❌ This template is NOT for:
- Teams needing live attendee check-in and badge printing — use Cvent or Bizzabo
- Users on Mac without a Windows VM — Power BI Desktop is Windows-only
- Solo hobby event hosts running 1–2 events a year — the setup overhead isn’t worth it
- Organizations that require SOC 2, HIPAA, or enterprise SSO for all dashboards
⚙️ How to Use the Event Management Analysis Dashboard in Power BI
- Download the .pbix file and open it in Power BI Desktop (free download from Microsoft).
- Open the Data view and replace the sample event table with your own event log (same column structure).
- Click Home → Refresh to recalculate every KPI, chart, and slicer across all 5 pages.
- Use slicers on any page to filter by Event Type, Region, Category, Month, Marketing Channel, or Venue.
- Customize visuals, colors, and DAX measures as needed — the entire report is editable.
- Publish to Power BI Service or export to PDF/PowerPoint for stakeholder reviews.
💼 Real-World Use Cases
Priya runs events at a 120-person B2B SaaS company. She uses the Event Management Analysis Dashboard in Power BI to report quarterly on trade-show ROI — filtering the Overview page by Marketing Channel to show which channels drove the $2.4M in sponsorship pipeline she generated last year. Before the template, she spent two days per quarter rebuilding this view in Excel.
David is a regional event director at a hospitality group managing 40 venues. He uses the Regional Performance and Attendance Insights pages to compare Completed Events and Attendance Rate across cities, identify under-performing venues, and decide which contracts to renew. The Total Sponsorship by Venue chart makes venue negotiations easier because he walks in with real numbers.
Maya runs a 6-person event agency serving non-profits. She drops each client’s event log into the dashboard, saves a PDF of all 5 pages, and hands it over as a quarterly report — replacing her previous $180/month Eventbrite Pro subscription for reporting only.
❓ Frequently Asked Questions
What KPIs does the Event Management Analysis Dashboard in Power BI track?
The Event Management Analysis Dashboard in Power BI tracks 5 headline KPIs on the Overview page — Total Sponsorship, Total Revenue, Total Actual Spend, Completed Events, and Avg Satisfaction Score — plus secondary metrics like Attendance Rate, Budget Utilization, and Total Tickets Sold across 4 analytical pages.
How does this compare to Cvent or Bizzabo?
Cvent and Bizzabo cost $2,500–$25,000+ per year and focus on live event operations. The Event Management Analysis Dashboard in Power BI is a one-time $17.99 purchase focused purely on post-event analytics and reporting. It does not handle check-in, badging, or live attendee apps — use it alongside your operational tool, not to replace it.
How long does setup take?
Setup takes under 10 minutes. Open the .pbix file in Power BI Desktop, replace the sample event log with your own data keeping the same column headers, click Refresh, and every visual on all 5 pages updates automatically. No DAX rewriting required for basic use.
Do I need a Power BI Pro license?
No. The Event Management Analysis Dashboard in Power BI opens and runs fully in Power BI Desktop, which is free from Microsoft. You only need Power BI Pro ($10/user/month) if you want to publish the dashboard to Power BI Service and share it with other users on the web.
Can I add my own KPIs and visuals?
Yes. The .pbix file is fully editable — you can add new DAX measures, new visuals, new pages, or modify existing ones. The underlying data model uses standard event columns (Event ID, Type, Region, City, Budget, Actual Spend, Tickets Sold, Attended, Satisfaction) so most additions are a matter of dragging new fields onto the canvas.
Does it work on Mac?
Power BI Desktop is Windows-only, so the Event Management Analysis Dashboard in Power BI needs a Windows machine or a Windows VM (Parallels, VMware Fusion) to open and edit. The published Power BI Service version can be viewed on any browser, including Mac Safari and Chrome.
Is the data secure?
Yes — 100%. The .pbix file is stored locally on your machine. No data is sent to NextGenTemplates servers, no telemetry, no third-party integrations. Your event data stays on your disk until you decide to publish to Power BI Service.
👤 About the Author
Built by PK — Microsoft Certified Professional with 15+ years of Excel, Google Sheets, and Power BI experience. Founder of NextGenTemplates, reaching 300K+ subscribers across YouTube channels (@PK-AnExcelExpert, @NextGenTemplates, @NeoTechNavigators). Every template is hand-built and tested before release.
🔗 Explore Related Templates
💎 Also available as: Event Management Analysis Dashboard in Excel and Event Management Analysis Dashboard in HTML — same analytics, different platforms.
🔹 Wedding Budget Dashboard in Power BI — event-adjacent budget tracking for weddings and private events.
🔹 Staffing Agency Dashboard in Power BI — if your events team also runs a temp-staffing operation.
🔹 Browse all Power BI Dashboard Templates or explore the full Dashboard Templates catalog.
📖 Click here to read the Detailed Blog Post
Watch the step-by-step video tutorial:
🎥 Visit our YouTube channel for step-by-step video tutorials
👉 YouTube.com/@NextGenTemplates
📅 Last updated: April 2026


Reviews
There are no reviews yet.