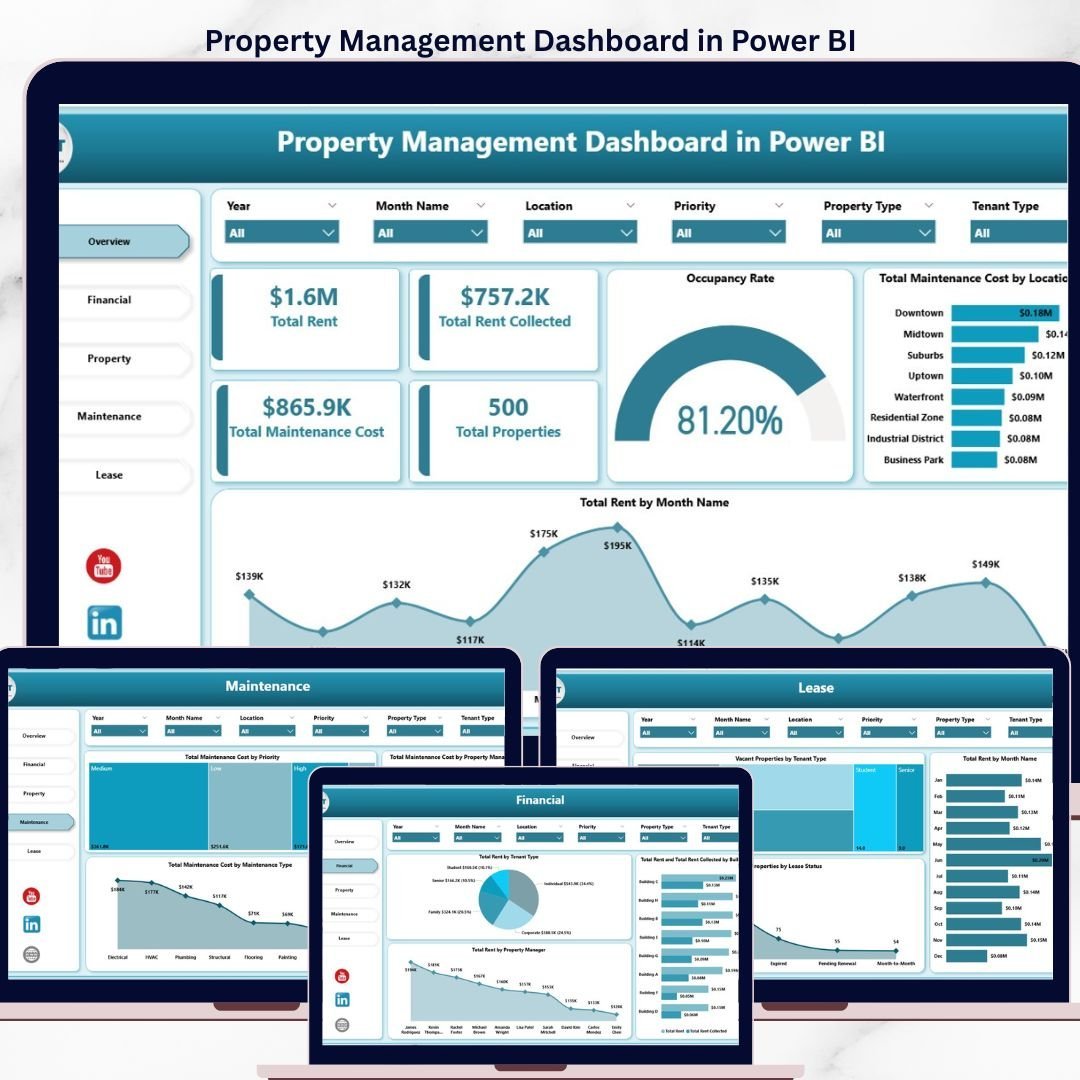
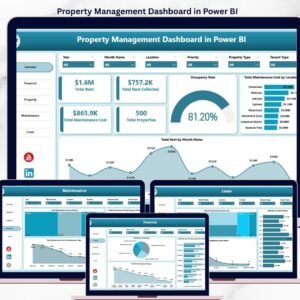
The Property Management Dashboard in Power BI tracks 5 core KPIs across 5 interactive report pages, with 15+ pre-built visuals and cross-page slicers. Setup takes under 10 minutes — connect the sample data source, refresh the model, and every chart updates automatically.
🌍 Join 8,400+ teams in 40+ countries using NextGenTemplates to replace paid SaaS tools with one-time-purchase Excel, Google Sheets, Power BI, and HTML templates.
✅ Instant download · One-time payment · No subscription · No per-user fees · Lifetime access
🔑 Key Features of Property Management Dashboard in Power BI
📊 Five dedicated report pages — Overview, Financial, Property, Maintenance, and Lease — each built to answer a different question a property manager faces daily. Every visual uses DAX measures, so swapping the data source refreshes the entire workbook without manual edits.
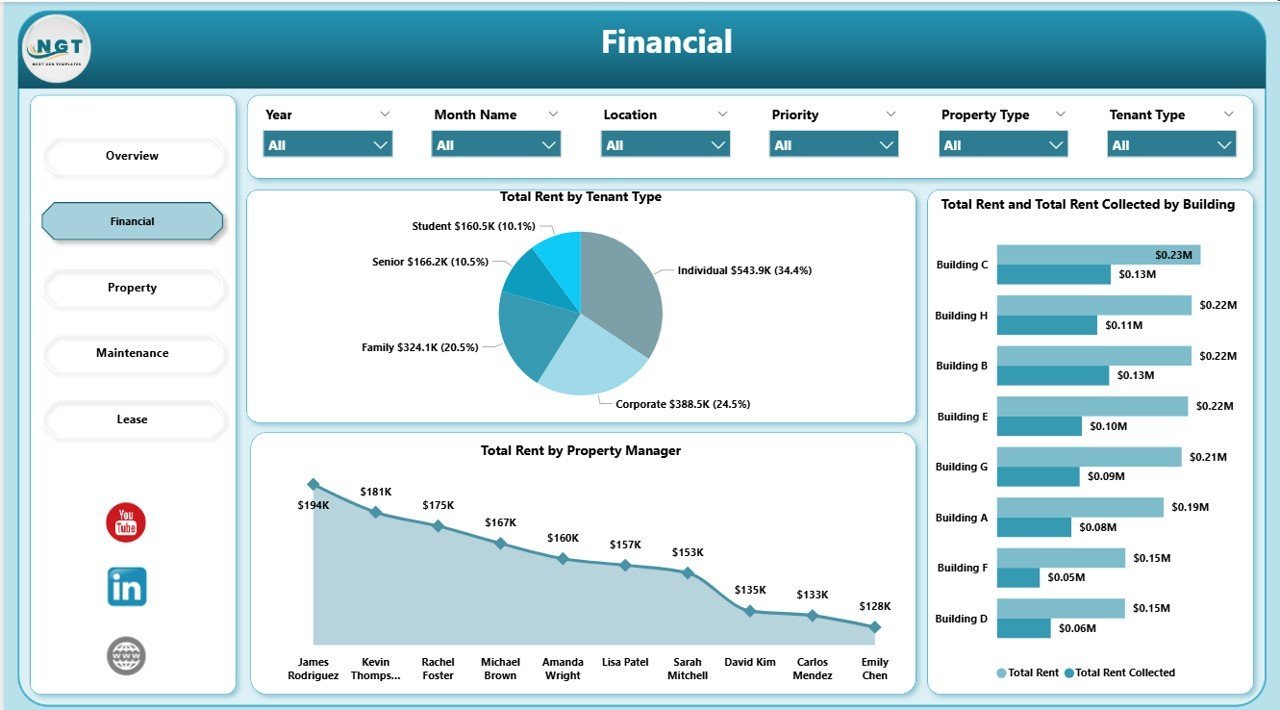
💰 Rent and collection tracking — The Financial page shows Total Rent vs Total Rent Collected split by Building, Tenant Type, and Property Manager, making it easy to spot which units are under-collected and which manager is hitting targets.
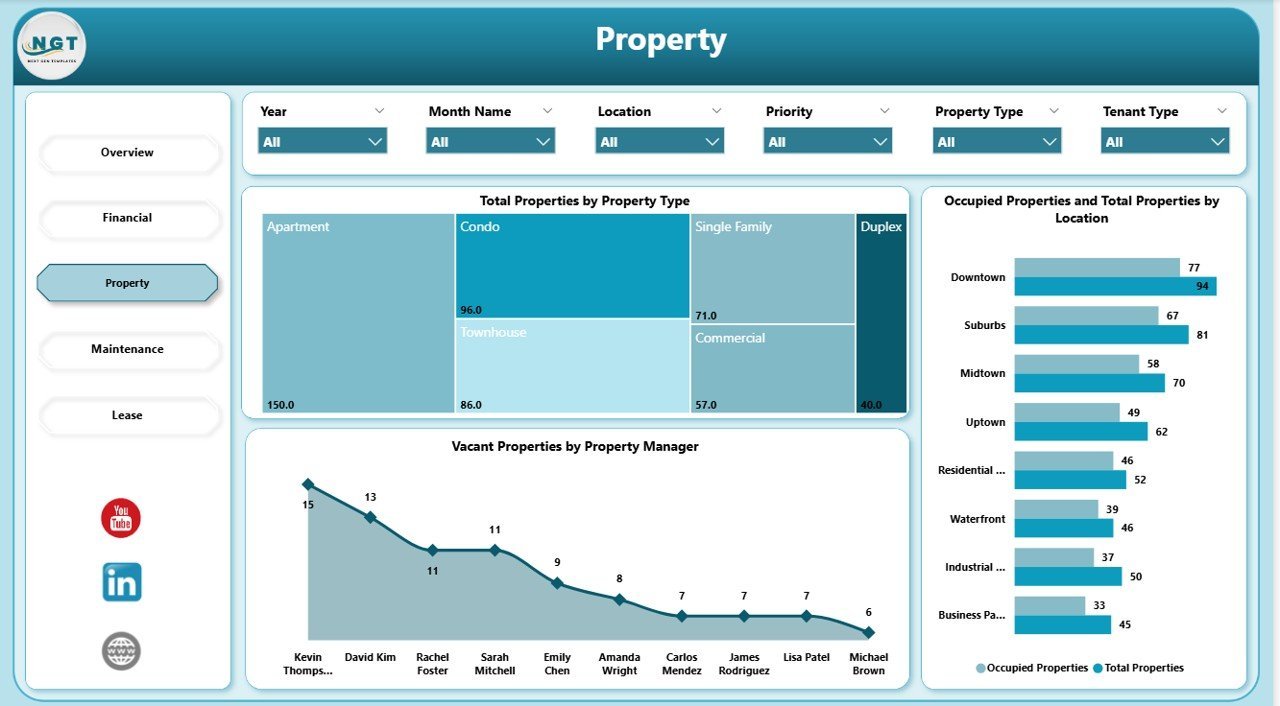
🏘️ Occupancy and vacancy analytics — The Property page breaks down Occupied vs Total properties by Location, with a dedicated visual for Vacant Properties by Property Manager so you can assign leasing priorities by portfolio.
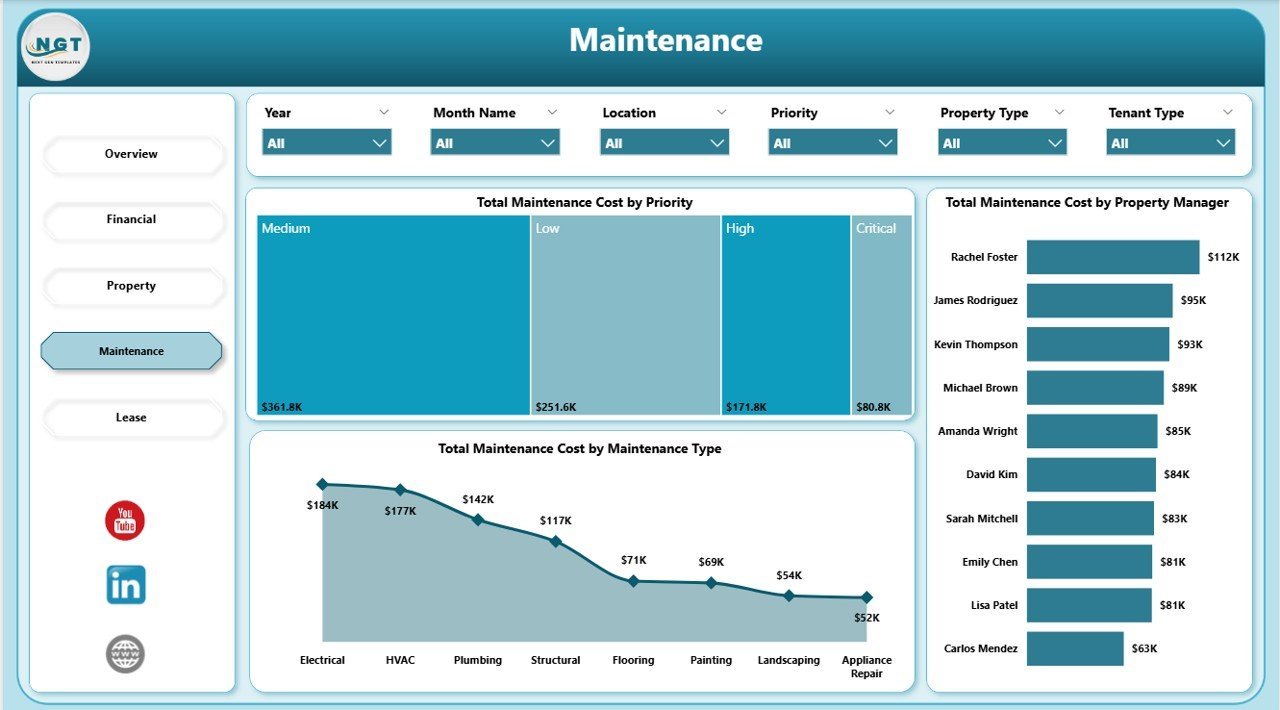
🔧 Maintenance cost control — The Maintenance page analyses Total Maintenance Cost by Priority, Maintenance Type, and Property Manager, exposing the expense categories and locations driving repair budgets.
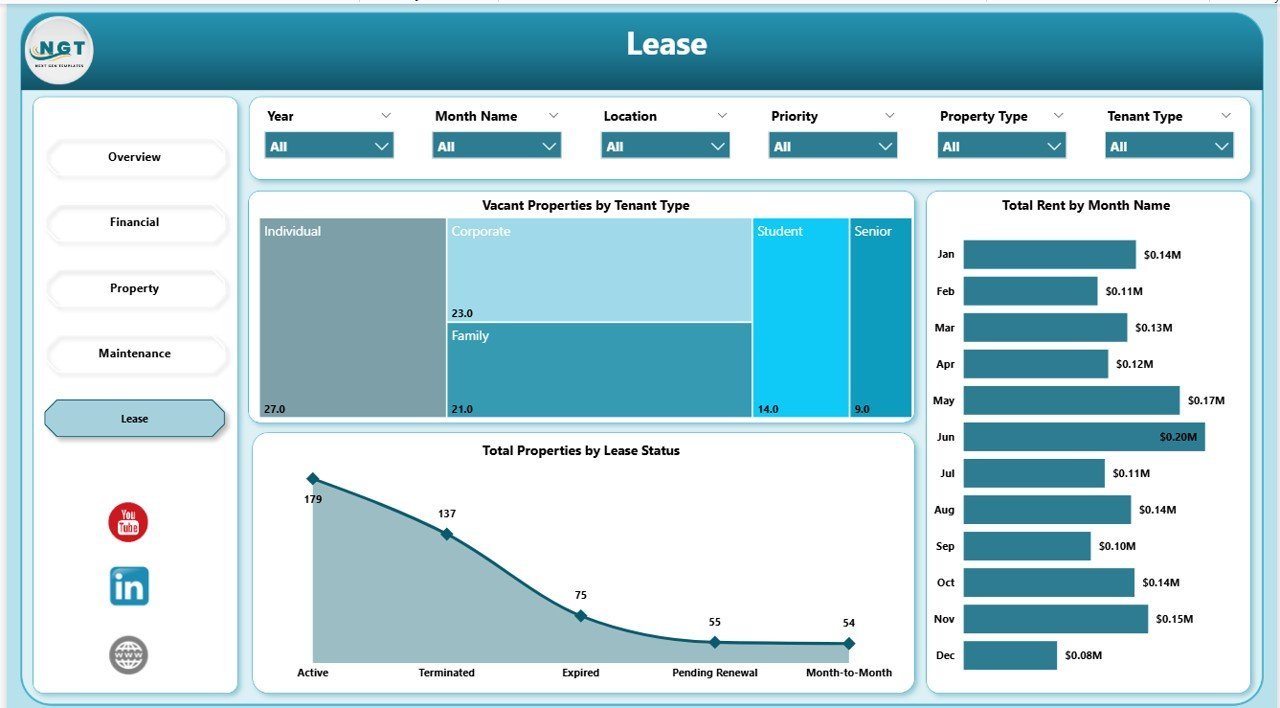
📝 Lease status monitoring — The Lease page tracks Total Properties by Lease Status, Total Rent by Month, and Vacant Properties by Tenant Type for renewal planning and churn reduction.
🎛️ Cross-page slicers — Filter every report page by Location, Property Manager, or Tenant Type with a single click. Slicer selections sync across all pages for consistent analysis.
📦 What’s Inside the Property Management Dashboard in Power BI
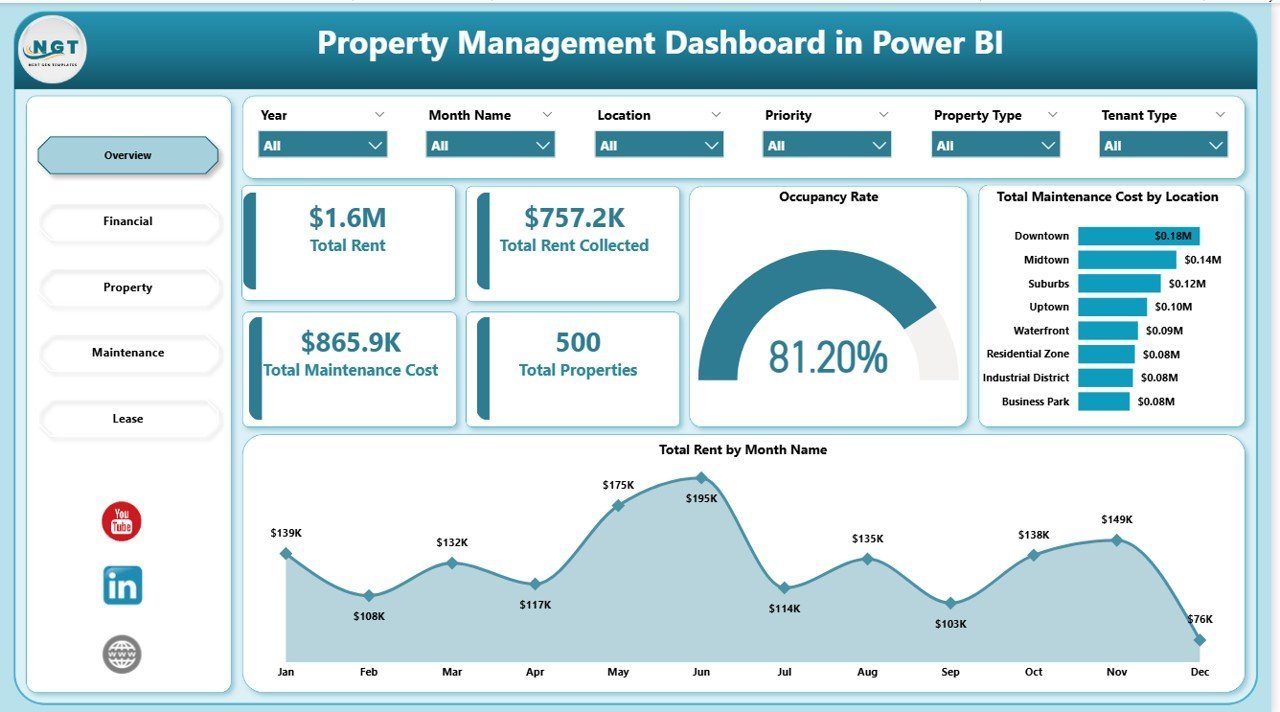
📄 Page 1 — Overview: Five executive KPI cards (Total Rent, Total Rent Collected, Total Maintenance Cost, Total Properties, Occupancy Rate) plus Total Maintenance Cost by Location and Total Rent by Month Name visuals.

Overview Page — Property Management Dashboard in Power BI
📄 Page 2 — Financial: Total Rent by Tenant Type, Total Rent and Total Rent Collected by Building, and Total Rent by Property Manager visuals for deep revenue analysis.

Financial Page — Rent & Collection Analysis
📄 Page 3 — Property: Total Properties by Property Type, Occupied Properties and Total Properties by Location, and Vacant Properties by Property Manager.

Property Page — Portfolio Breakdown
📄 Page 4 — Maintenance: Total Maintenance Cost by Priority, Total Maintenance Cost by Property Manager, and Total Maintenance Cost by Maintenance Type for cost control and contractor review.

Maintenance Page — Cost Analysis
📄 Page 5 — Lease: Vacant Properties by Tenant Type, Total Rent by Month Name, and Total Properties by Lease Status for renewal and churn planning.

Lease Page — Status & Renewal Planning
📊 Property Management Dashboard in Power BI vs. Tableau/Qlik vs. Buildium/AppFolio — Where This Fits
| Feature | Property Management Dashboard in Power BI | Tableau / Qlik Real Estate Dashboard | Buildium / AppFolio |
|---|---|---|---|
| Cost | $17.99 one-time | $70-$150 / user / month | $55-$450 / month + per-unit fees |
| Platform | Power BI Desktop (free) | Tableau Desktop / Qlik Sense | Cloud SaaS |
| Setup time | Under 10 minutes | 2-4 weeks with a BI consultant | 1-2 weeks onboarding |
| Offline use | ✅ Works offline in Power BI Desktop | ❌ Needs Tableau Server for sharing | ❌ Cloud only |
| Customizable visuals & DAX | ✅ Full edit access | ✅ Yes | ❌ Fixed reports only |
| Per-user pricing | ✅ None — one license, unlimited users | ❌ Yes | ❌ Yes, per unit |
| Data ownership | ✅ Your .pbix, your data | ✅ Yes | ❌ Vendor-hosted |
| Year-1 cost at 5 users | $17.99 | $4,200-$9,000 | $3,000-$12,000+ |
| Rent, occupancy & maintenance tracking | ✅ Built-in across 5 pages | ⚠️ Build from scratch | ✅ Yes, but locked to vendor UI |
For landlords, property managers, and real-estate teams who want portfolio analytics without paying $3,000-$12,000 a year for Buildium or AppFolio, the Property Management Dashboard in Power BI sits in the sweet spot.
👥 Who This Template Is For — and Who It’s Not For
✅ This template is built for:
- Independent landlords and property owners managing 5-500 rental units across residential or commercial portfolios
- Small-to-mid property management firms reporting to investors or REITs who want portfolio-level rent, occupancy, and maintenance visibility
- Real estate analysts and accountants who already use Power BI and need a starting .pbix with a proven real-estate data model
- Property managers tired of manual Excel exports and monthly board reports built from scratch
❌ This template is NOT for:
- Enterprise REITs with 5,000+ units needing SOC 2, SSO, and custom ERP integrations
- Teams that need lease accounting under ASC 842 / IFRS 16 — this dashboard is analytics, not accounting software
- Users who don’t have Excel, CSV, or SQL as a data source — the model expects tabular input
⚙️ How to Use the Property Management Dashboard in Power BI
- Download the .pbix file from your order and open it in Power BI Desktop (free from Microsoft).
- Replace the sample data source with your own property list, rent roll, and maintenance log.
- Click Refresh — all 5 report pages, KPI cards, and visuals recalculate automatically.
- Use the slicers at the top of each page to filter by Location, Property Manager, or Tenant Type.
- Publish to Power BI Service or export to PDF for investor and board reports.
💼 Real-World Use Cases
David runs a 60-unit rental portfolio across three cities. He uses the Property Management Dashboard in Power BI every Monday to check the Overview page for occupancy rate, open the Financial page to see which buildings are behind on collections, and send his leasing manager the Vacant Properties by Location visual — without paying $450 a month for AppFolio.
Priya is a real estate analyst at a boutique investment firm. She replaces the sample data with her client’s 180-unit multifamily portfolio, then uses the Maintenance page to benchmark cost-per-unit by Property Manager across three acquisition targets in her quarterly investor review.
Marcus manages commercial leases for a family-office real estate fund. He relies on the Lease page to track Total Properties by Lease Status and flag upcoming renewals by Tenant Type — replacing a Buildium subscription he was paying $220/month for.
❓ Frequently Asked Questions
What KPIs does the Property Management Dashboard in Power BI track?
The Property Management Dashboard in Power BI tracks 5 headline KPIs on the Overview page — Total Rent, Total Rent Collected, Total Maintenance Cost, Total Properties, and Occupancy Rate — plus 10+ secondary visuals across Financial, Property, Maintenance, and Lease pages. All metrics update automatically when you replace sample data.
Do I need Power BI Pro or a paid license to use this dashboard?
No. The Property Management Dashboard in Power BI runs in Power BI Desktop, which is free from Microsoft. You only need Power BI Pro if you want to publish reports to the Power BI Service for team sharing — local use and PDF export are fully free.
How is this different from Buildium or AppFolio?
Buildium and AppFolio are full SaaS property management platforms with tenant portals, built-in accounting, and ongoing per-unit fees ranging from $55 to $450+ per month. The Property Management Dashboard in Power BI is a one-time $17.99 analytics layer you own and customize — no subscription, no per-unit fees, no vendor lock-in.
How long does setup take?
Setup typically takes under 10 minutes. Open the .pbix in Power BI Desktop, point the data source at your property list and rent roll (Excel, CSV, or SQL), and click Refresh. All 5 pages, KPI cards, and visuals rebuild automatically against your live data.
Can I add new cities, buildings, or tenant types?
Yes. The Property Management Dashboard in Power BI uses a flexible star-schema data model. Add rows to your source table for new buildings, locations, or tenant types, refresh, and all slicers and visuals automatically include the new values — no visual edits required.
Is this a one-time payment or a subscription?
One-time payment of $17.99. You get instant download, full .pbix file ownership, lifetime access, and no per-user fees. There’s no subscription, no recurring charges, and no expiration on the template.
👤 About the Author
Built by PK — Microsoft Certified Professional with 15+ years of Excel, Google Sheets, and Power BI experience. Founder of NextGenTemplates, reaching 300K+ subscribers across YouTube channels (@PK-AnExcelExpert, @NextGenTemplates, @NeoTechNavigators). Every template is hand-built and tested before release.
🔗 Explore Related Templates
🏠 Also available as: Property Management Dashboard in Excel (Excel version) and Property Management Dashboard in HTML (browser-based version).
🏢 Related real estate templates: Real Estate Agent Dashboard in Excel tracks agent-side sales and listings, while Rental Property Investment Dashboard in Google Sheets focuses on investor ROI and cash-flow analysis.
📊 Browse more: Power BI Dashboard Templates and Excel Dashboard Templates.
📖 Click here to read the Detailed Blog Post
Watch the step-by-step video tutorial:
🎥 Visit our YouTube channel for step-by-step video tutorials
👉 YouTube.com/@NextGenTemplates


Reviews
There are no reviews yet.