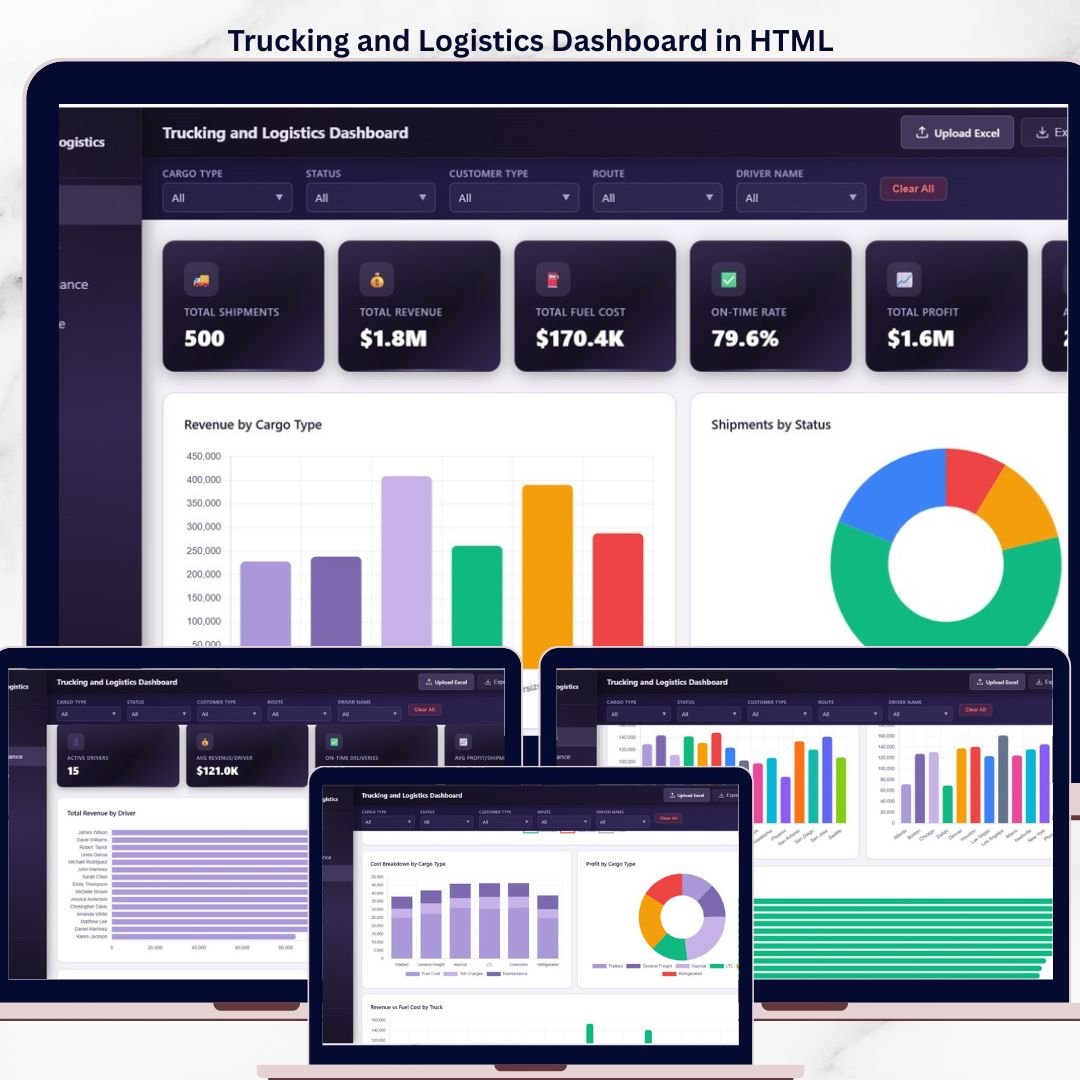
The Trucking and Logistics Dashboard in HTML tracks 6 fleet KPIs across 5 interactive pages, with 13 pre-built charts, 4 slicers, and a searchable data table with CSV export. Setup takes under 5 minutes — unzip, open index.html in any modern browser, swap in your shipment data, and every chart, card, and filter updates automatically. No Excel, no Power BI, no login, no database required.
🌍 Join 8,400+ teams in 40+ countries using NextGenTemplates to replace paid SaaS tools with one-time-purchase Excel, Google Sheets, Power BI, and HTML Dashboard Templates.
✅ Instant download · One-time payment · No subscription · No per-user fees · Lifetime access · Works offline

Trucking and Logistics Dashboard Overview
🔑 Key Features of Trucking and Logistics Dashboard in HTML
🚚 6 Executive KPI Cards — Total Shipments, Total Revenue, Total Fuel Cost, On-Time Rate, Total Profit, and Average Weight (lbs) are calculated live from your shipment records and displayed at the top of the Overview page for instant fleet visibility.
📊 5 Interactive Pages — Overview, Route Analysis, Driver Performance, Fleet and Finance, and Data View. Each page uses the same slicer filters so one click (e.g., cargo type or month) updates every chart and table across the entire dashboard.
📈 13 Dynamic Charts — Includes Revenue by Cargo Type, Shipments by Status, Monthly Revenue Trend, Revenue by Customer Type, Top 10 Routes by Revenue, Revenue by Origin City, Revenue by Destination City, On-Time Rate by Route, Revenue by Driver, Shipment Count by Driver, Monthly Profit Trend, Cost Breakdown by Cargo Type, and Revenue vs Fuel Cost by Truck.
🔎 Searchable Data View — A full shipment-level data table with instant text search, column sort, paginated rows, and one-click CSV export of filtered data.
🧩 Zero Dependencies — No Microsoft 365 license, no Power BI Desktop install, no Google Workspace subscription. Works in Chrome, Edge, Firefox, and Safari on Windows, macOS, and Linux.
🔐 100% Offline & Private — Data never leaves your device. Open the file from a USB stick, a local drive, or your internal network and your shipment numbers stay exactly where you put them.
📱 Responsive Layout — The dashboard reflows cleanly on laptops, tablets, and larger phones, so dispatchers, drivers, and owners can check on-time rate and profit on the road.
📦 What’s Inside the Trucking and Logistics Dashboard in HTML
The ZIP download ships with an index.html file, a separate data file, a CSS stylesheet, and a JavaScript file — everything needed to run the dashboard locally in a browser.
1. Overview Page — 6 KPI cards (Total Shipments, Total Revenue, Total Fuel Cost, On-Time Rate, Total Profit, Avg Weight in lbs) and 5 charts: Revenue by Cargo Type, Shipments by Status, Monthly Revenue Trend, Revenue by Customer Type, and Top 10 Routes by Revenue. Slicers for cargo type, customer type, month, and delivery status apply across the whole dashboard.
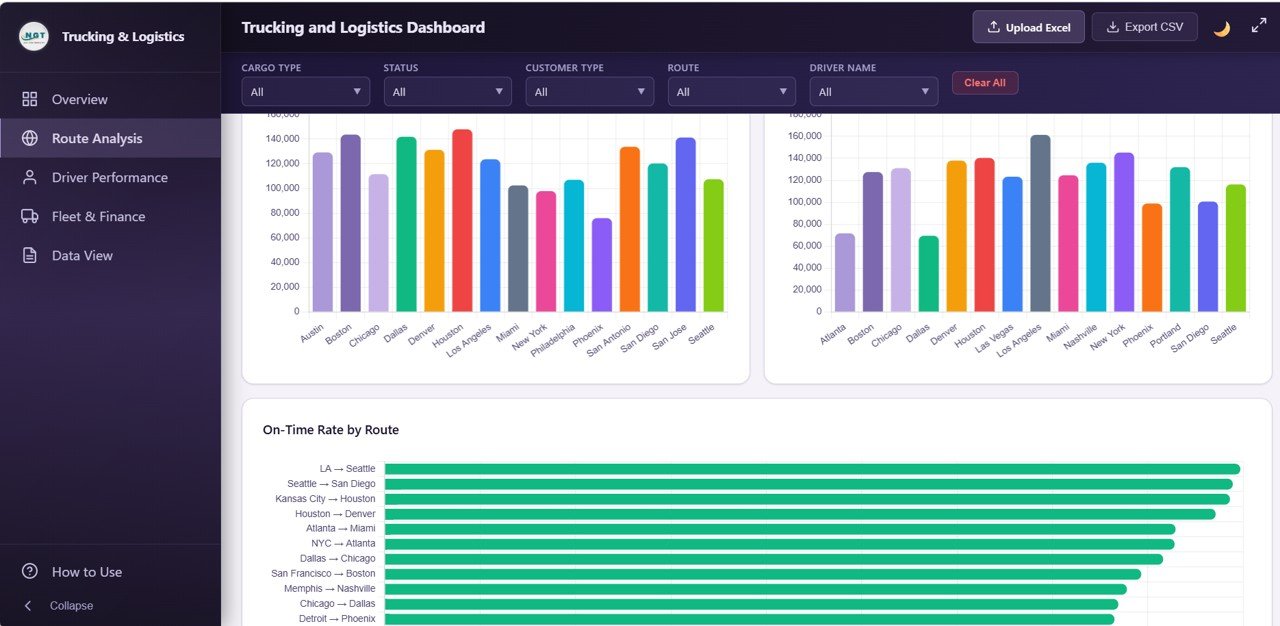
Route Analysis
2. Route Analysis — Four charts built for dispatchers and route planners: Average Distance by Route, Revenue by Origin City, Revenue by Destination City, and On-Time Rate by Route. Quickly spot which lanes are high-revenue, which origins feed the best margins, and which routes are slipping on service level.
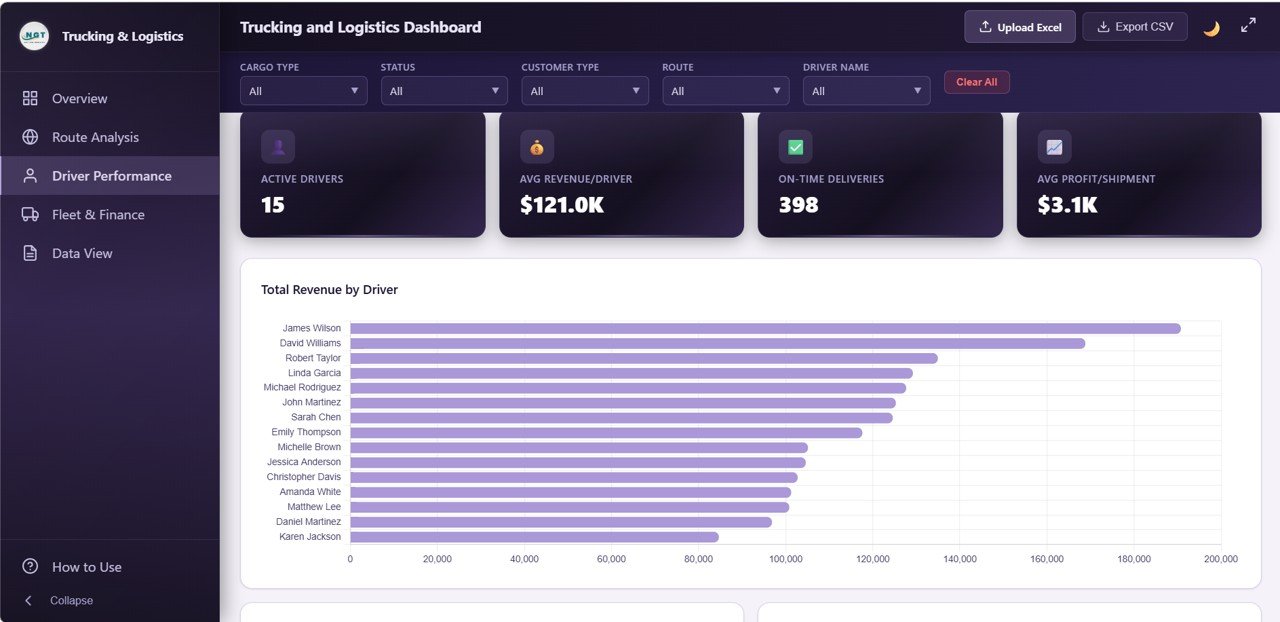
Driver Performance
3. Driver Performance — Four charts for fleet managers: Total Revenue by Driver, On-Time Rate by Driver, Average Delivery Days by Driver, and Shipment Count by Driver. Identify top performers, coaching candidates, and workload imbalance across the roster.
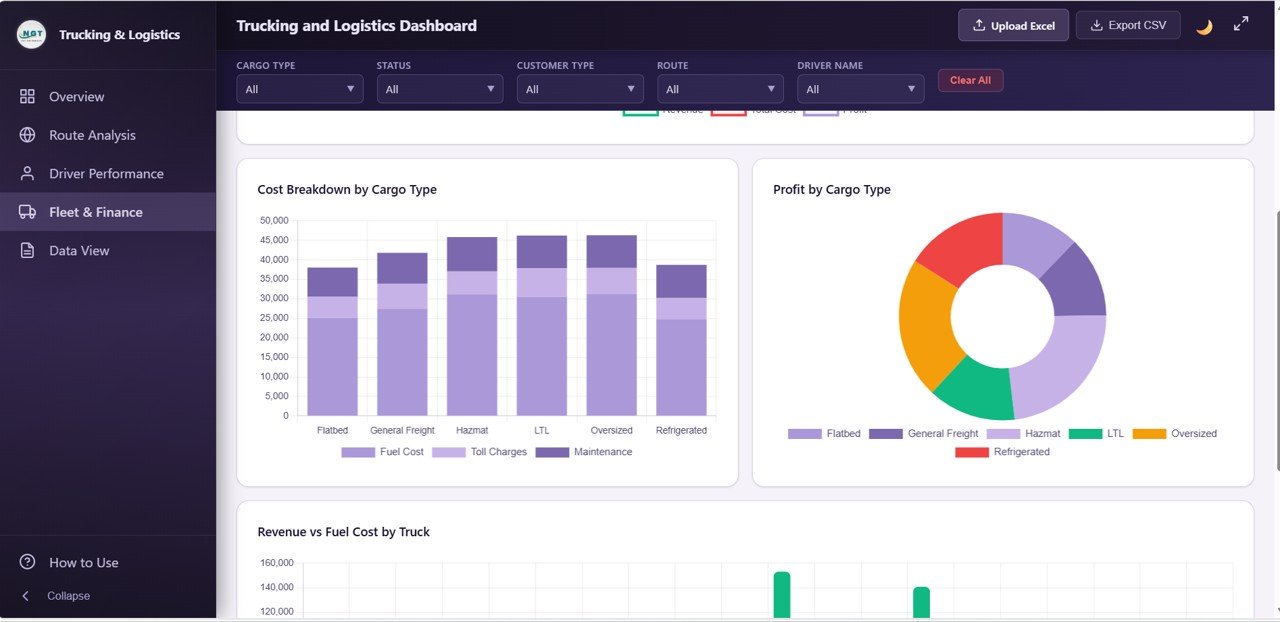
Fleet and Finance
4. Fleet and Finance — Four profitability charts: Monthly Profit Trend, Cost Breakdown by Cargo Type, Profit by Cargo Type, and Revenue vs Fuel Cost by Truck. Surfaces which cargo mix pays best, which trucks are burning margin on fuel, and how profit is trending month over month.
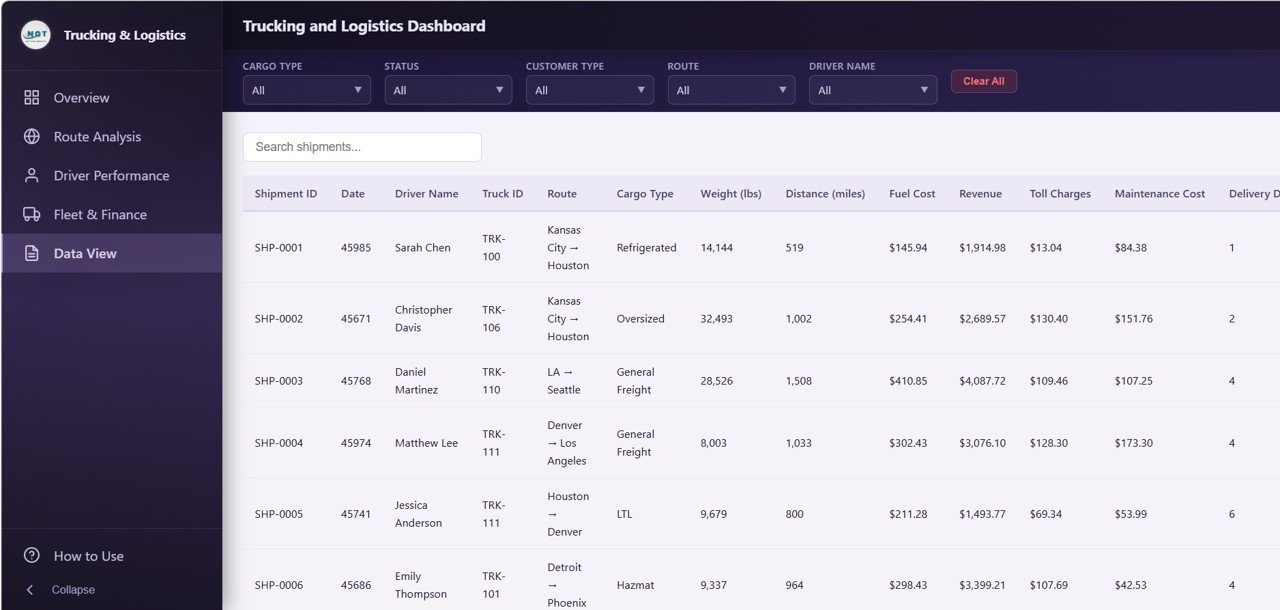
Data View tab
5. Data View — A detailed, shipment-level data table with live text search, column sort, pagination, and a CSV export button. Filter the dashboard first, then export only the rows you care about — perfect for audit trails, driver payroll, and customer invoicing.
📊 Trucking and Logistics Dashboard in HTML vs. Standalone SaaS Dashboard vs. Fleet Management Software — Where This Fits
| Feature | Trucking and Logistics Dashboard in HTML | Standalone SaaS Dashboard (Metabase Cloud / Geckoboard) | Fleet Management SaaS (Samsara / Motive) |
|---|---|---|---|
| Cost | $12.99 one-time | $50-$200 / user / month | $30-$80 / truck / month |
| Platform | Runs in any browser — no install, no login | Cloud-hosted, requires account + login | Cloud + ELD hardware per truck |
| Setup time | Under 5 minutes | 1-2 weeks (data source wiring) | 2-6 weeks (hardware install) |
| Works offline | ✅ | ❌ | ❌ |
| Data privacy | ✅ 100% local — never leaves your device | Stored on vendor servers | Stored on vendor servers |
| Mobile responsive | ✅ | ✅ | ✅ |
| CSV export of filtered data | ✅ | ✅ (paid tiers) | Limited |
| Year-1 cost at 5 users / 10 trucks | $12.99 flat | $3,000-$12,000 | $3,600-$9,600 |
| Full source code included | ✅ | ❌ | ❌ |
For owner-operators, small fleets, and logistics analysts who want live charts and filters without paying per user or per truck, the Trucking and Logistics Dashboard in HTML sits in the sweet spot.
👥 Who This Template Is For — and Who It’s Not For
✅ This template is built for:
- Owner-operators and small trucking companies (1-50 trucks) who need shipment-level visibility without a SaaS contract
- Freight brokers and 3PL analysts who want to review route profitability and on-time performance weekly
- Logistics consultants delivering a branded client dashboard without building one from scratch
- Operations managers at manufacturers or retailers tracking inbound/outbound carriers
- MBA students, data analysts, and interview candidates who need a real trucking analytics portfolio piece
❌ This template is NOT for:
- Enterprise fleets (500+ trucks) that need ELD hours-of-service compliance, GPS geofencing, and real-time telematics ingestion
- Teams that require SOC 2, SSO, role-based permissions, or multi-user concurrent editing
- Companies that want the dashboard embedded inside an existing web app with live database connections
⚙️ How to Use the Trucking and Logistics Dashboard in HTML
- Download and unzip the package to any folder on your computer or internal drive.
- Open the data file (CSV or embedded JS data file) and replace the sample shipment records with your own — keep column headers intact.
- Double-click
index.htmlto open the dashboard in Chrome, Edge, Firefox, or Safari. - Use the slicers at the top (cargo type, customer type, month, status) to filter every chart and table on every page simultaneously.
- Switch pages via the top navigation to move between Overview, Route Analysis, Driver Performance, Fleet and Finance, and Data View.
- Export filtered data from the Data View tab using the CSV export button for payroll, invoicing, or deeper analysis.
💼 Real-World Use Cases
Rajesh runs a 12-truck regional trucking business in Ohio. He drops his monthly shipment export into the data file, opens index.html, and within 2 minutes can see which of his 4 drivers have the best on-time rate, which routes are eating fuel, and whether profit is trending up — without paying Samsara $720 per month.
Priya is a freight broker managing 30 carrier partners. She uses the Trucking and Logistics Dashboard in HTML to benchmark revenue per route, identify her top 10 lanes, and flag origin cities where on-time rate is dropping. She emails the filtered CSV to her operations team every Friday.
Marcus is a supply chain analyst at a mid-size distributor. He uses the Data View page to audit carrier invoices, sort by delivery days, and export filtered rows into his monthly carrier scorecard — replacing a $150/month Geckoboard subscription that only gave him static KPIs.
❓ Frequently Asked Questions
What is the Trucking and Logistics Dashboard in HTML?
The Trucking and Logistics Dashboard in HTML is a browser-based dashboard template with 5 pages, 6 KPI cards, and 13 interactive charts for tracking shipments, revenue, fuel cost, on-time performance, driver metrics, and fleet profitability. It runs entirely in a web browser with no server, no login, and no subscription.
Do I need a web server or any software to use this HTML dashboard?
No. The Trucking and Logistics Dashboard in HTML runs 100% client-side. Just unzip and open index.html in Chrome, Edge, Firefox, or Safari. No web server, no Node.js, no database, and no internet connection is required after download.
How do I replace the sample data with my own shipments?
Open the included data file (CSV or JavaScript data file) in any text editor or Excel, replace the sample rows with your own shipment records, keep the column headers intact, and save. Refresh the dashboard in your browser and all 13 charts and KPI cards recalculate automatically.
How does this compare to Samsara, Motive, or Geckoboard?
The Trucking and Logistics Dashboard in HTML is a one-time $12.99 purchase with no recurring fees, while Samsara and Motive charge $30-$80 per truck per month and Geckoboard charges per user. This template is ideal for analysis and reporting — for real-time GPS and ELD hours-of-service, you still need a telematics SaaS.
Can I customize the charts, colors, and branding?
Yes. The full HTML, CSS, and JavaScript source is included and fully unlocked. You can edit colors, fonts, chart types, add your company logo, rename KPIs, or add new charts. Basic HTML/CSS knowledge is helpful for deeper customization.
How long does setup take?
Under 5 minutes. Download the ZIP, unzip, replace the sample data with your own shipments, and open index.html in any modern browser. The Trucking and Logistics Dashboard in HTML renders instantly — no install, no configuration, no account setup.
Can I use this dashboard offline or on a private network?
Yes. The Trucking and Logistics Dashboard in HTML works completely offline. Open it from a USB stick, a local folder, or a corporate intranet. Your shipment data stays on your device and is never transmitted to any third-party server.
👤 About the Author
Built by PK — Microsoft Certified Professional with 15+ years of Excel, Google Sheets, Power BI, and HTML dashboard experience. Founder of NextGenTemplates, reaching 300K+ subscribers across YouTube channels (@PK-AnExcelExpert, @NextGenTemplates, @NeoTechNavigators). Every template is hand-built and tested before release.
🔗 Explore Related Templates
🚚 Trucking and Logistics Dashboard in Excel — The Excel version with 5 pages, pivot-powered charts, and slicers for desktop users who prefer Microsoft Excel.
🚚 Trucking and Logistics Dashboard in Power BI — A Power BI edition of the same dashboard for teams standardized on Microsoft Fabric and Power BI Desktop.
🚚 Trucking and Logistics Dashboard in Google Sheets — A cloud-based Google Sheets version with shared editing and a Shipment Lookup search sheet.
🚚 Fleet Management Dashboard in HTML — A broader fleet analytics dashboard covering vehicle health, utilization, and maintenance KPIs.
🚚 Transportation and Logistics Dashboard in HTML — An alternative HTML logistics dashboard focused on carrier-level performance and shipment analytics.
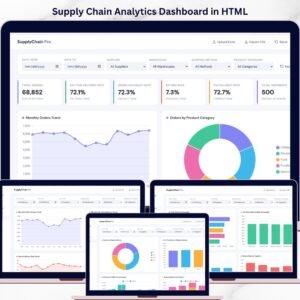
🚚 Supply Chain Analytics Dashboard in HTML — End-to-end supply chain KPI tracker covering procurement, inventory, and distribution in a single HTML dashboard.
🚚 Browse the full Supply Chain & Logistics Templates collection for more dashboards across Excel, Google Sheets, Power BI, and HTML.
📖 Click here to read the Detailed Blog Post about the Trucking and Logistics Dashboard in HTML
🎥 Visit our YouTube channel for step-by-step video tutorials
👉 YouTube.com/@NextGenTemplates
Watch the step-by-step video tutorial:


Reviews
There are no reviews yet.