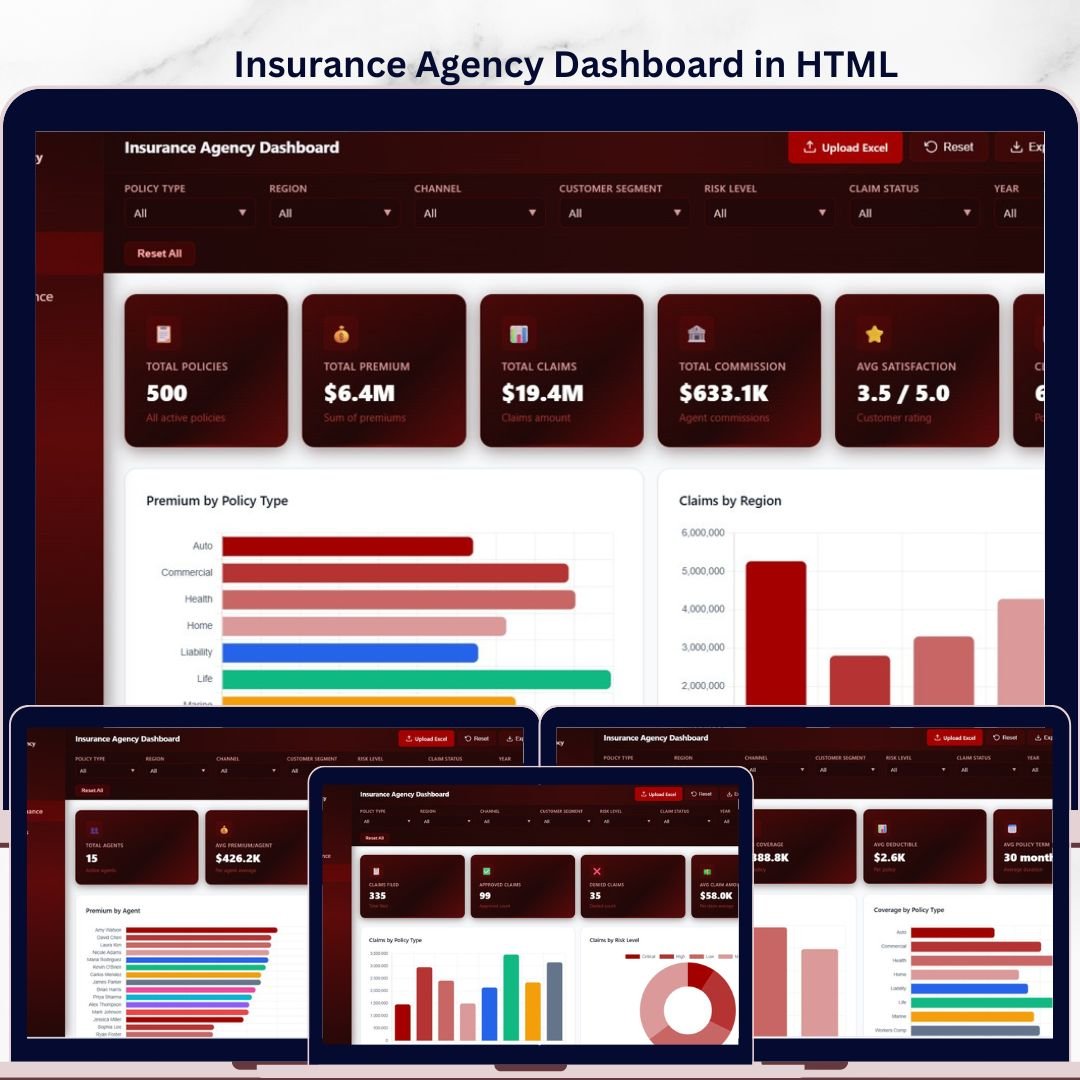
🔑 Key Features of Insurance Agency Dashboard in HTML
Insurance Agency Dashboard in HTML is a powerful, interactive, browser-based analytics dashboard template designed for insurance agencies, brokers, underwriters, and risk managers who need instant visibility into policy performance, premium collection, claims activity, agent productivity, and customer satisfaction — all from a single HTML file that runs in any modern web browser. This professionally built HTML dashboard template includes 5 interactive pages covering Overview, Agent Performance, Claims Analysis, Policy Insights, and a detailed Data View page with search, sort, pagination, and CSV export features. The dashboard tracks 6 key metrics including Total Policies, Total Premium, Total Claims, Total Commission, Avg Satisfaction, and Claim Rate — all updated dynamically through interactive charts and filters.
Whether you manage a small insurance brokerage or a large multi-agent agency across multiple regions, this dashboard delivers instant clarity on premium trends by policy type, claims distribution by region, policy acquisition by channel, claim status breakdowns, and monthly premium vs claims trends. Simply open it in your favorite browser, load your data, and start making smarter decisions about your insurance operations today. If you prefer Excel, check out the Insurance Agency Dashboard in Excel, or for Power BI users, the Insurance Agency Dashboard in Power BI. Explore more HTML Dashboard Templates from our collection.
📦 What’s Inside the Insurance Agency Dashboard in HTML
This dashboard template includes 5 interactive analytical pages, each designed to give you deep insights into different areas of insurance agency management.
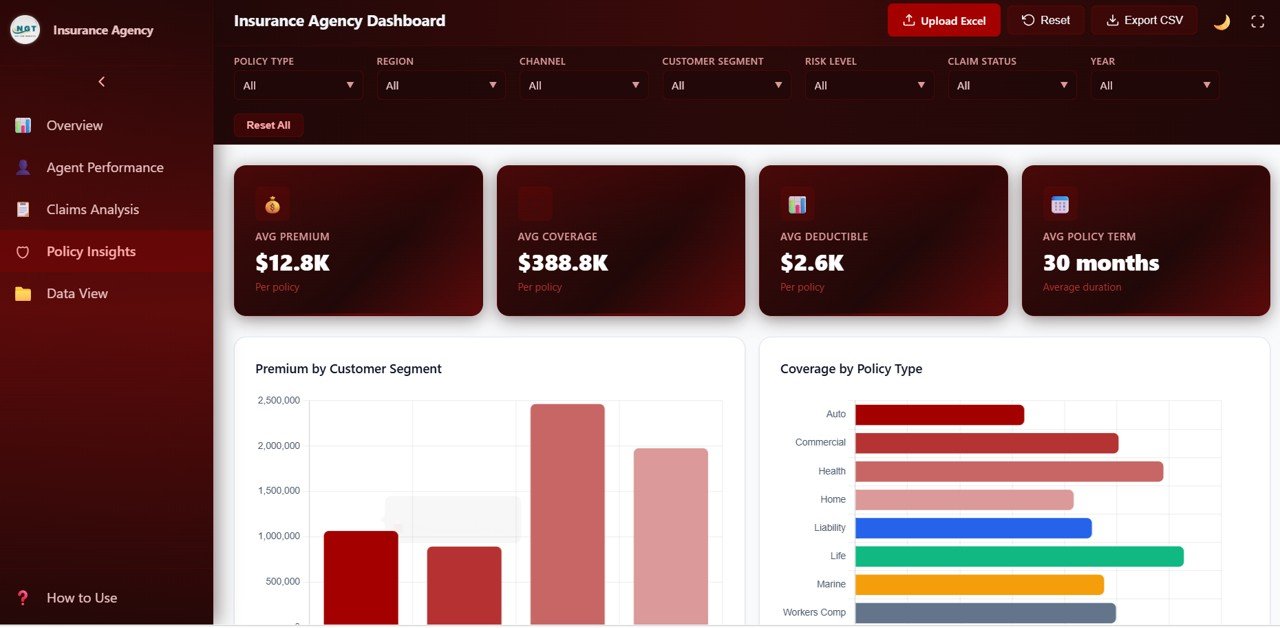
📊 Overview Page — The command center of your insurance analytics. Six high-level KPI cards display Total Policies, Total Premium, Total Claims, Total Commission, Avg Satisfaction, and Claim Rate at the top. Below the cards, interactive charts show Premium by Policy Type, Claims by Region, Policies by Channel, Claim Status Distribution, and Monthly Premium vs Claims Trend. Multiple slicers let you filter the entire dashboard instantly by policy type, region, channel, and other dimensions.
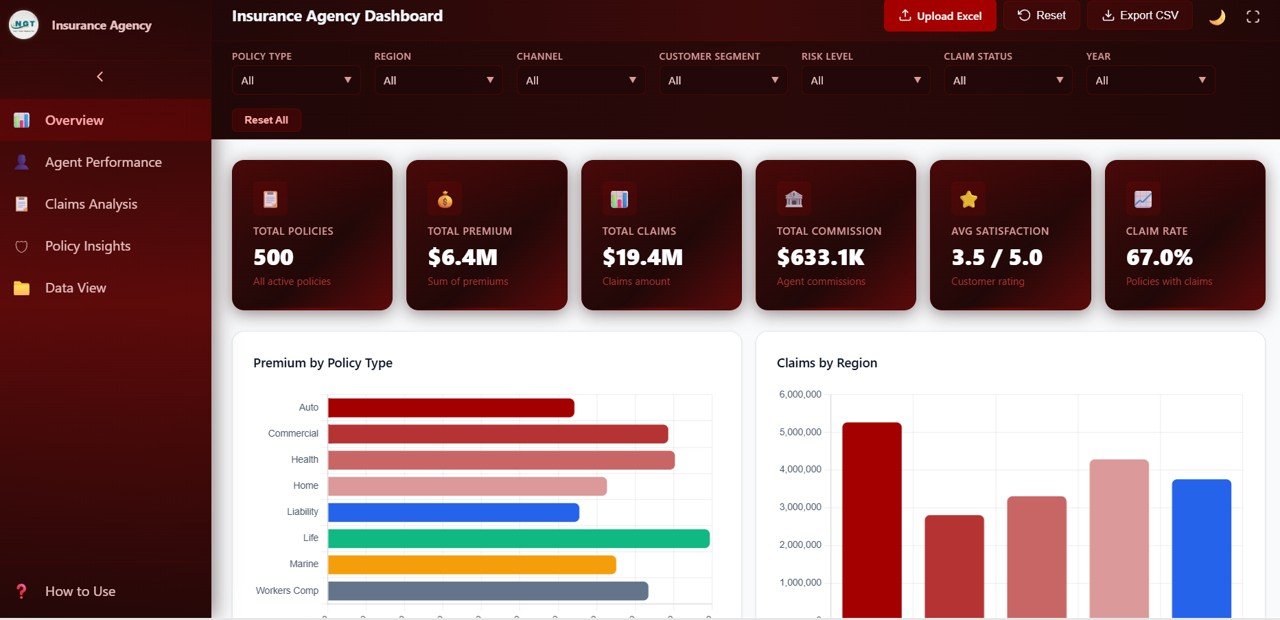
Insurance Agency Dashboard Overview
📊 Agent Performance — Evaluate individual agent productivity and effectiveness with detailed analysis including Premium by Agent, Claims by Agent, Commission by Agent, and Satisfaction Score by Agent. These insights help agency managers identify top performers, compare agent workloads, and spot coaching opportunities across the team.
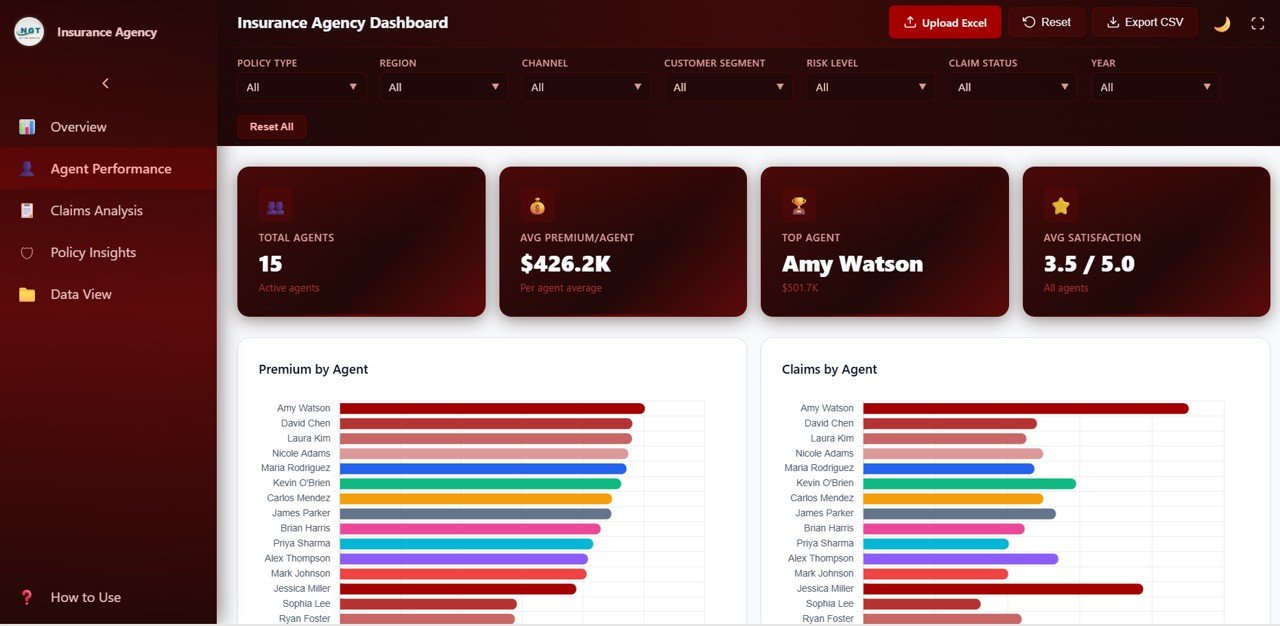
Agent Performance
📊 Claims Analysis — Deep dive into claims behavior and risk patterns with charts for Claims by Policy Type, Claims by Risk Level, Claims by Customer Segment, and Claim Amount by Region. This page helps underwriters and risk teams identify high-risk segments, monitor claim frequency, and optimize claims management strategies.
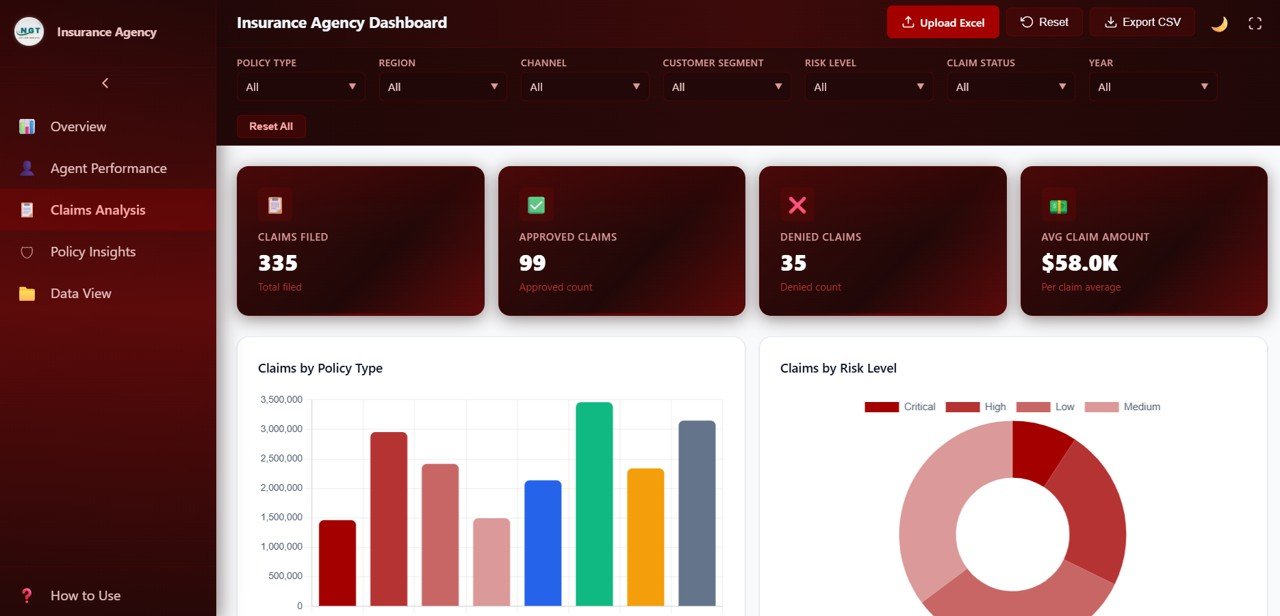
Claims Analysis
📊 Policy Insights — Understand your policy portfolio composition and customer distribution with charts for Premium by Customer Segment, Coverage by Policy Type, Policies by Payment Frequency, and Premium by Region. This page is essential for marketing strategy, product development, and regional expansion decisions. For Google Sheets-based insurance analytics, explore our Policy Performance and Risk Analysis Dashboard in Google Sheets.
Policy Insights
📊 Data View Page — A detailed data table page where you can see all insurance records with search, sort, and pagination features. You can also export the filtered data to CSV for use in Excel, Power BI, or any other reporting tool.
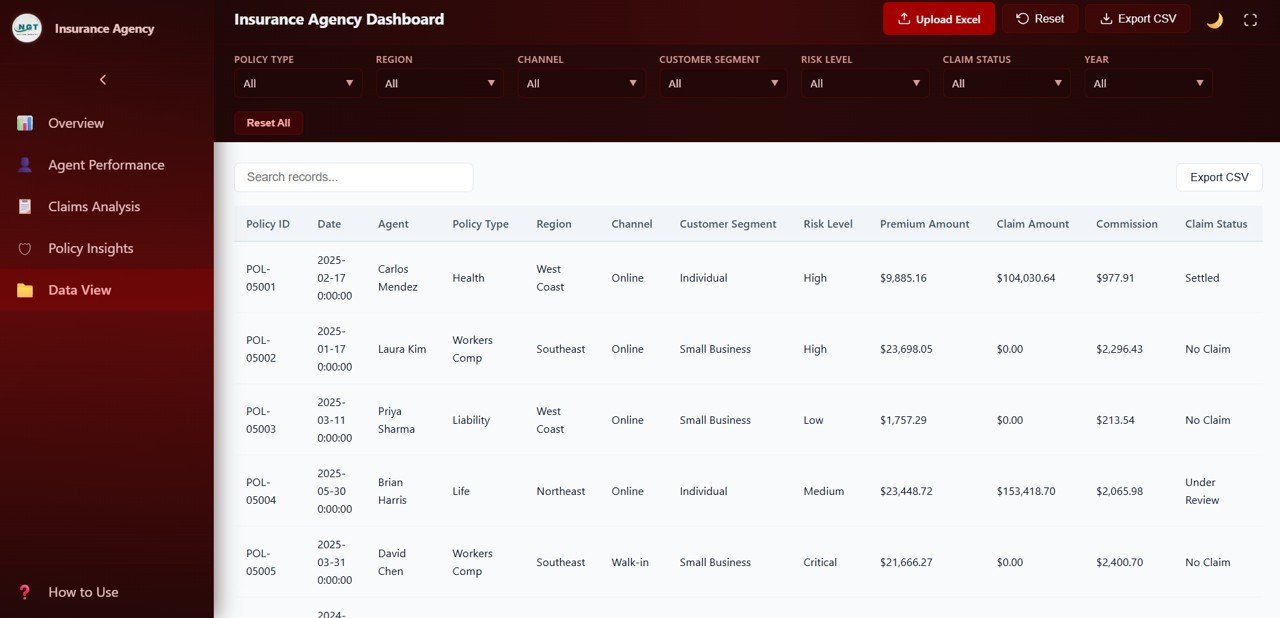
Data View
⚙️ How to Use the Insurance Agency Dashboard in HTML
📌 Step 1: Download and unzip the file to your computer.
📌 Step 2: Open the index.html file in any modern browser like Chrome, Firefox, Edge, or Safari.
📌 Step 3: Explore the 5 dashboard tabs to review the sample data and understand the layout.
📌 Step 4: Replace the sample data with your own insurance agency records in the data file.
📌 Step 5: Use the built-in slicers and filters to drill down into specific policy types, regions, channels, or agents.
📌 Step 6: Export filtered records from the Data View page to CSV for further analysis or sharing.
👥 Who Can Benefit from This Insurance Agency Dashboard in HTML
📌 Insurance agency owners and managers tracking premium collection, claims activity, and agent performance across regions
📌 Insurance brokers monitoring policy portfolios, channel distribution, and customer segment analysis
📌 Underwriters and risk analysts evaluating claim frequency, risk levels, and claims patterns by region
📌 Finance teams tracking commission earnings, premium trends, and payment frequency analysis
📌 Insurance consultants preparing interactive, data-driven performance reports for agency clients
📌 Students and educators using this as a learning tool for data analytics and insurance management courses
❓ Frequently Asked Questions
What KPIs does the Insurance Agency Dashboard in HTML track?
The Insurance Agency Dashboard in HTML tracks 6 key performance indicators on the Overview page: Total Policies, Total Premium, Total Claims, Total Commission, Avg Satisfaction, and Claim Rate. It also provides detailed analysis across 5 interactive pages covering agent performance, claims analysis, policy insights, and a searchable data view with CSV export.
Do I need any special software to use this HTML dashboard?
No. This dashboard runs entirely in your web browser. Simply unzip the downloaded file and open index.html in Chrome, Firefox, Edge, or Safari. No Excel, Power BI, or any other software installation is required.
Can I filter the dashboard by specific agent or policy type?
Yes. The dashboard includes multiple slicers and filters that let you filter all charts and KPIs by policy type, channel, region, risk level, customer segment, and other dimensions instantly.
How many dashboard pages are included in this template?
This template includes 5 interactive dashboard pages — Overview, Agent Performance, Claims Analysis, Policy Insights, and Data View — each packed with focused charts, KPI cards, and visual analysis for insurance agency operations.
What is the best HTML dashboard template for tracking insurance agency performance?
The Insurance Agency Dashboard in HTML from NextGen Templates is one of the most comprehensive browser-based insurance analytics solutions available. It covers policy tracking, claims analysis, agent performance, customer segmentation, and premium trends across 5 interactive pages with dynamic filters and CSV export — making it ideal for any insurance agency looking to make data-driven decisions without installing any software.
Is this dashboard available in other formats?
Yes. We also offer the Insurance Agency Dashboard in Excel and the Insurance Agency Dashboard in Power BI for users who prefer other platforms.
🔗 Explore Related Templates
📌 Insurance Agency Dashboard in Excel — Pivot-driven Excel version with 7 sheet tabs, slicers, and KPI cards for insurance agencies who prefer spreadsheet analytics.
📌 Insurance Agency Dashboard in Power BI — Interactive Power BI version with 5 dashboard pages and dynamic slicers for advanced insurance analytics.
📌 Policy Performance and Risk Analysis Dashboard in Google Sheets — Track policy performance, risk exposure, premiums, and claims in a collaborative Google Sheets dashboard.
📖 Click here to read the Detailed Blog Post
🎥 Visit our YouTube channel to learn step-by-step video tutorials
👉 YouTube.com/@NextGenTemplates
Watch the step-by-step video tutorial:
YouTube


Reviews
There are no reviews yet.