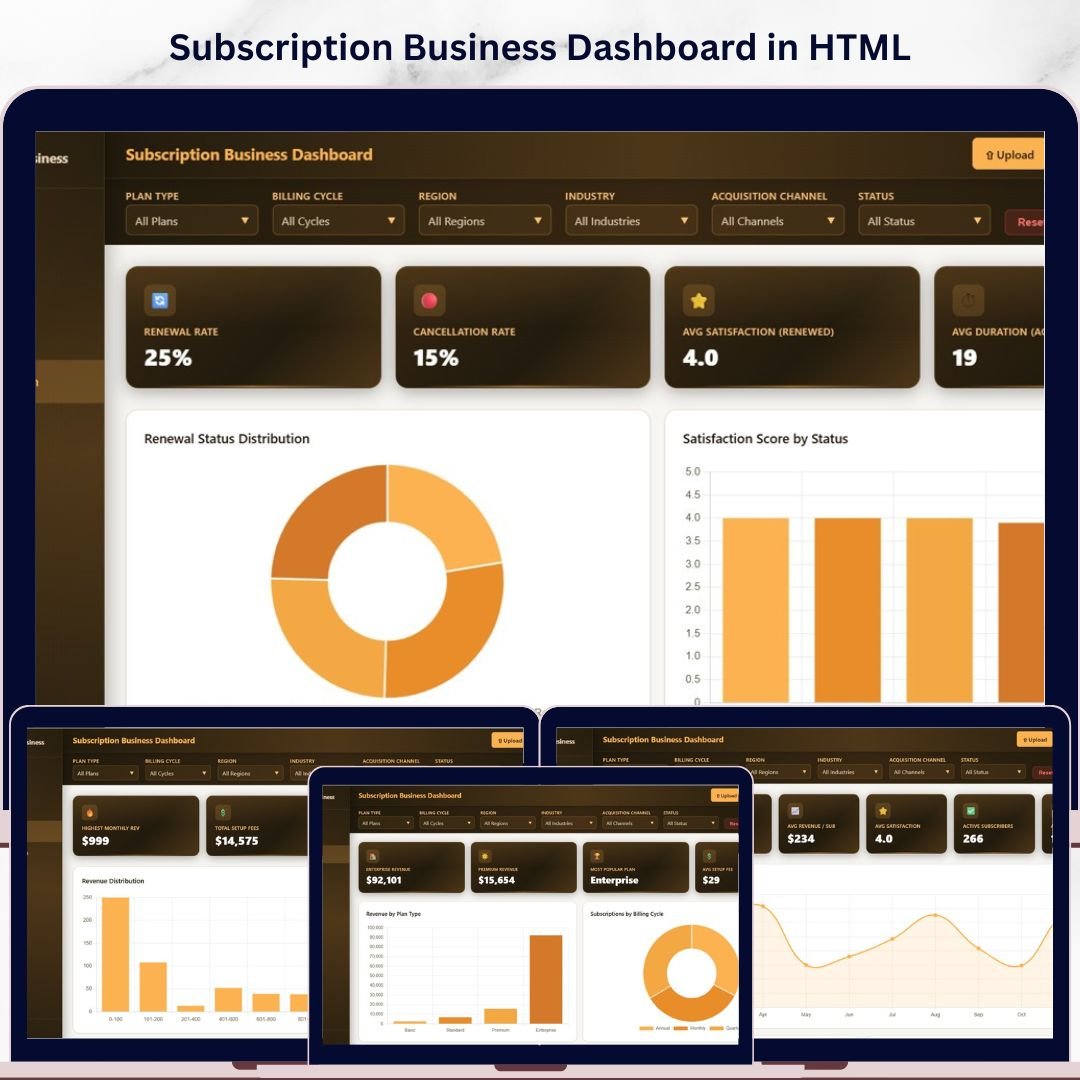
🔑 Key Features of Subscription Business Dashboard in HTML
Subscription Business Dashboard in HTML is a premium, browser-based analytics template designed for SaaS founders, subscription box operators, and recurring revenue teams who need a crystal-clear view of their subscription health. This dashboard includes 5 interactive pages, 6 executive KPI cards, and over 15 dynamic charts covering everything from monthly recurring revenue and churn rate to customer lifetime value and plan distribution. Whether you are preparing for an investor pitch, board review, or strategic planning session, this template delivers the subscription intelligence you need in seconds.
Unlike traditional spreadsheets, this HTML dashboard runs directly in any modern browser — no Excel, no Power BI, no software installation required. Simply unzip the downloaded file, open index.html, and your subscription analytics command center is ready. It is the fastest way to build a professional subscription business dashboard without any coding or advanced technical skills. Explore our full collection of HTML Dashboard Templates for every business domain.
📦 What’s Inside the Subscription Business Dashboard in HTML
This template contains 5 purpose-built dashboard pages that cover every critical dimension of a subscription business:
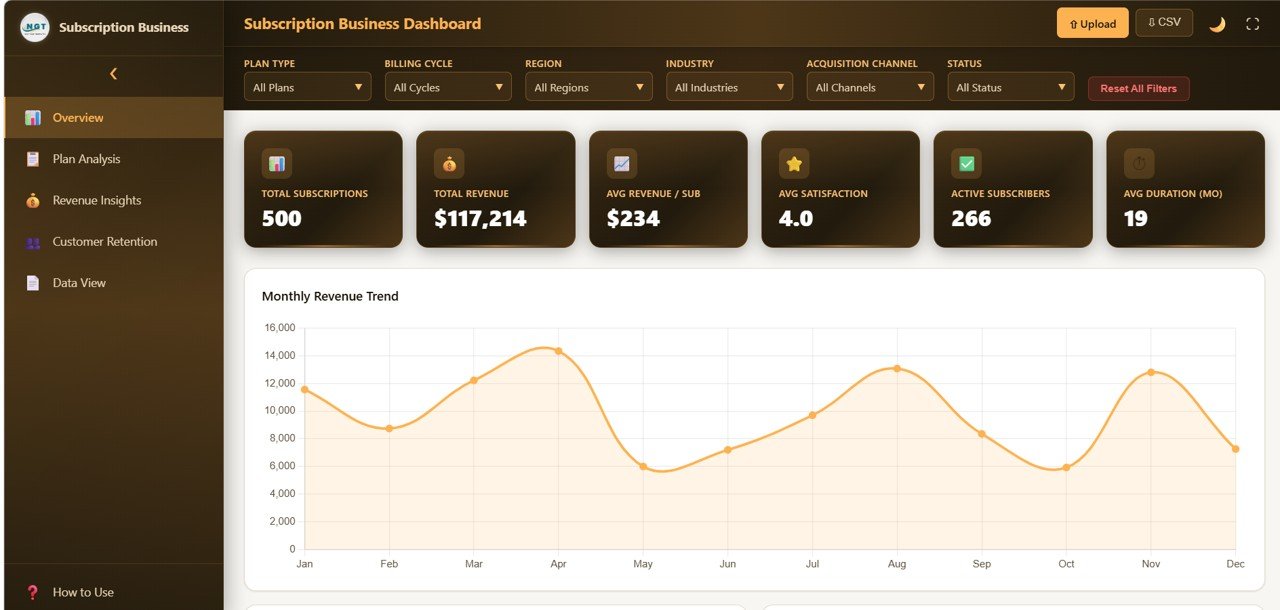
📌 Executive Overview Page — Displays top-level KPI cards for MRR (Monthly Recurring Revenue), ARR (Annual Recurring Revenue), Active Subscribers, Churn Rate, ARPU (Average Revenue Per User), and Customer Lifetime Value. Below the cards you will find trend charts showing MRR Growth over time and Subscribers by Plan Tier, giving you an instant pulse check on business health.
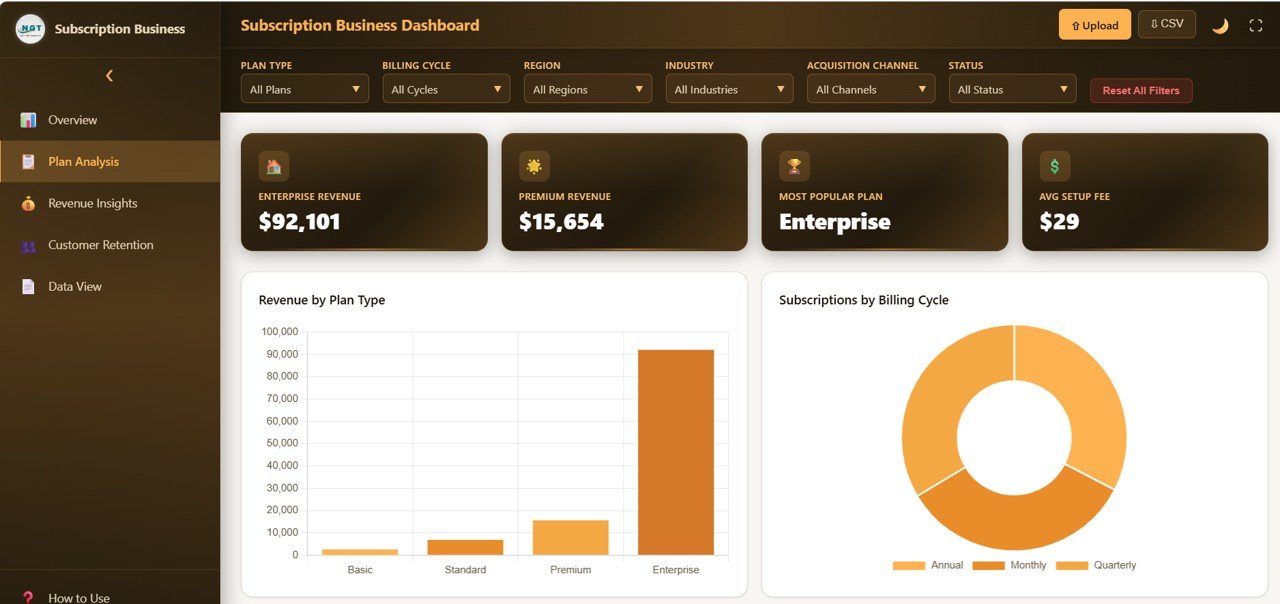
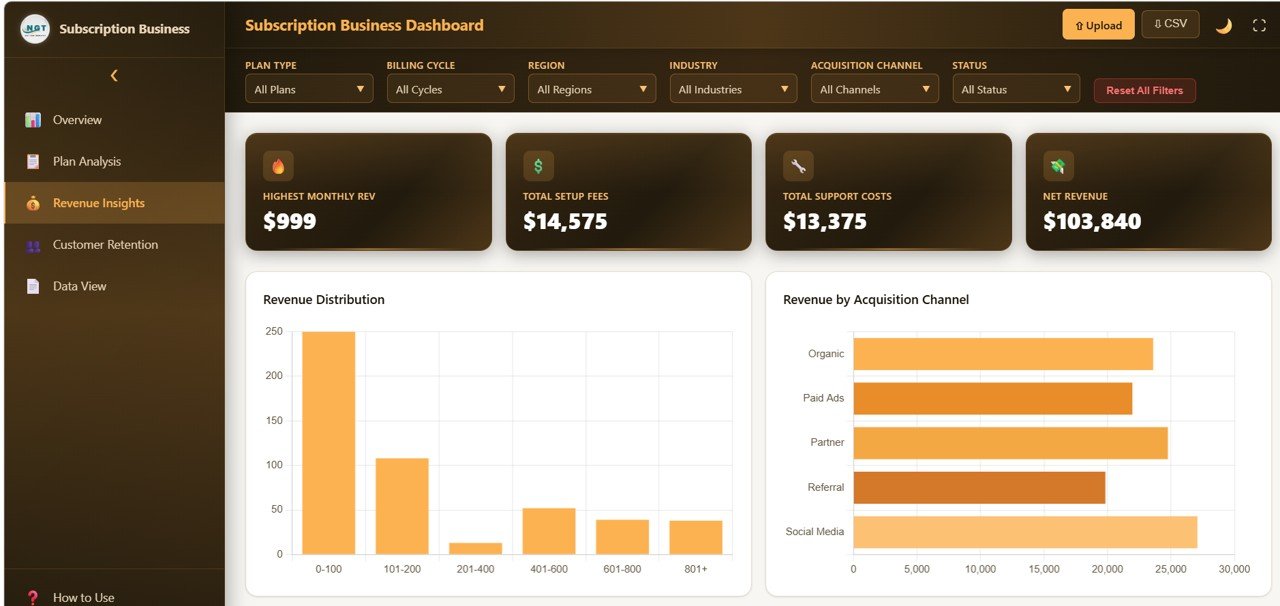
📌 Revenue Analytics Page — Deep dives into revenue performance with charts for Revenue by Subscription Plan, MRR Trend Analysis, Expansion and Contraction Revenue, ARPU Trend, and Revenue by Region. This page helps you understand exactly where your money comes from and where growth opportunities exist.
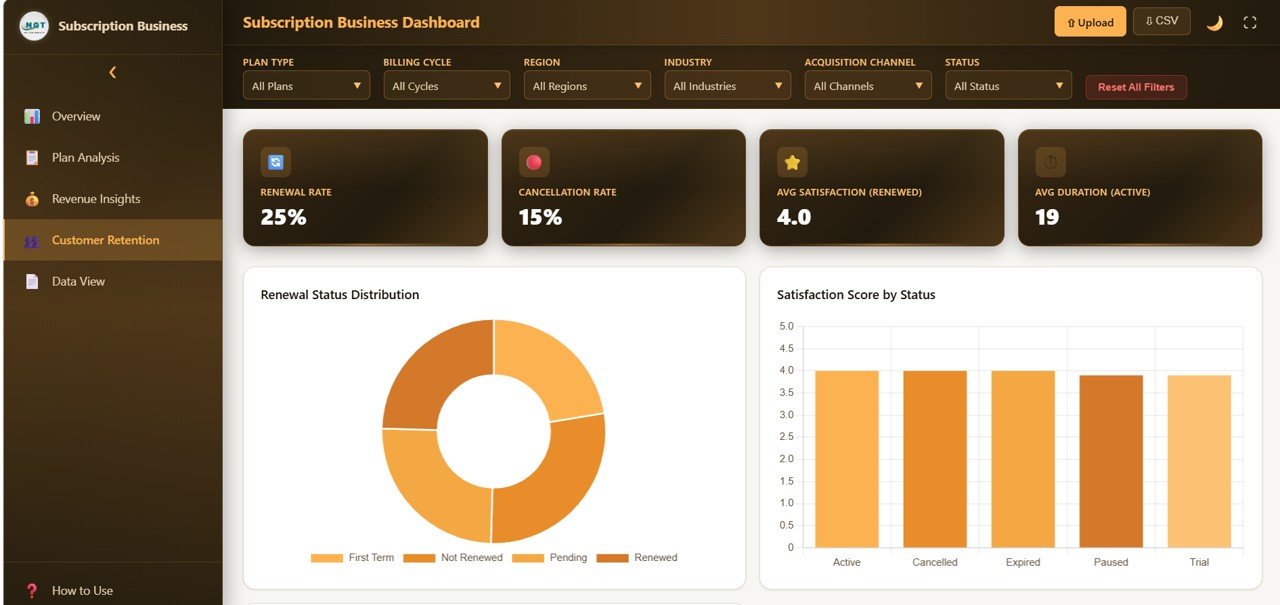
📌 Customer Analytics Page — Visualizes subscriber behavior including New Subscribers vs Churned Subscribers, Net Subscriber Growth, Retention Rate by Cohort, Customer Segmentation by Plan, and Average Subscription Duration. This is your go-to page for understanding customer acquisition and engagement patterns.
📌 Churn Analysis Page — Dedicated to understanding and reducing attrition with charts for Churn Rate Trend, Revenue Churn vs Logo Churn, Churn Reasons Breakdown, At-Risk Subscriber Identification, and Churn by Plan Tier. This page is essential for any subscription business serious about reducing cancellations.
📌 Growth and Forecasting Page — Forward-looking analytics including Subscriber Growth Projection, Revenue Forecast, Plan Migration Flow, Monthly Cohort Analysis, and Customer Acquisition Cost vs LTV Ratio. Use this page to set realistic growth targets and evaluate marketing ROI.
If you are running a subscription business on a different platform, check out the Subscription Business Dashboard in Excel or the Subscription Business Dashboard in Power BI for alternative formats.
⚙️ How to Use the Subscription Business Dashboard in HTML
1️⃣ Download and unzip the template file to any folder on your computer.
2️⃣ Open the index.html file in any modern web browser such as Chrome, Firefox, or Edge.
3️⃣ Explore the 5 dashboard pages using the tab navigation at the top.
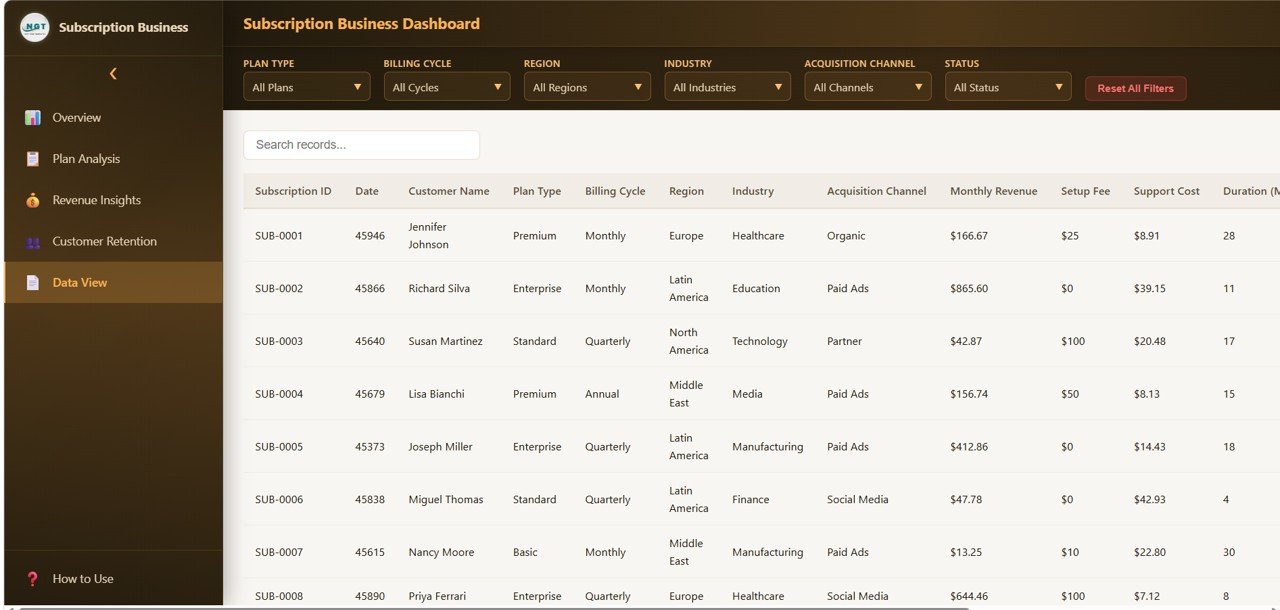
4️⃣ Replace the sample data in the included data file with your own subscription metrics — all charts and KPI cards update automatically.
5️⃣ Use the interactive filters to slice data by time period, plan tier, region, or customer segment.
6️⃣ Screenshot or print any page directly from your browser for presentations and reports.
👥 Who Can Benefit from This Subscription Business Dashboard in HTML
📌 SaaS founders and CEOs tracking MRR, churn, and growth metrics
📌 Finance teams monitoring subscription revenue and forecasting ARR
📌 Product managers analyzing customer retention and plan migration
📌 Subscription box businesses tracking subscriber acquisition and attrition
📌 Investors and board members reviewing subscription business performance
📌 Marketing teams evaluating CAC vs LTV and campaign effectiveness
📌 Operations managers at membership and recurring revenue companies
❓ Frequently Asked Questions
What KPIs does the Subscription Business Dashboard in HTML track?
The Subscription Business Dashboard in HTML tracks 6 core KPIs including Monthly Recurring Revenue (MRR), Annual Recurring Revenue (ARR), Active Subscribers, Churn Rate, Average Revenue Per User (ARPU), and Customer Lifetime Value (LTV). It also includes over 15 charts covering revenue trends, customer segmentation, churn analysis, and growth forecasting across 5 dashboard pages.
Do I need coding skills to use this HTML dashboard template?
No. Simply unzip the downloaded file and open index.html in any modern web browser. The dashboard is fully built and ready to use. You only need to replace the sample data with your own subscription data and all visualizations update automatically.
Can I customize the Subscription Business Dashboard for my brand?
Yes. Since it is a standard HTML file, you can edit colors, fonts, logos, and layout using any text editor or code editor. No advanced programming knowledge is required for basic customizations.
What is the best dashboard template for tracking subscription revenue and churn?
The Subscription Business Dashboard in HTML from NextGenTemplates is one of the best options for tracking subscription revenue and churn. It includes dedicated pages for revenue analytics and churn analysis with over 15 interactive charts that help you identify trends, at-risk subscribers, and growth opportunities.
Is this template compatible with all browsers?
Yes. This HTML dashboard works in all modern browsers including Google Chrome, Mozilla Firefox, Microsoft Edge, Safari, and Opera. No plugins or extensions are required.
How is this different from the SaaS Financial Model Dashboard?
The Subscription Business Dashboard focuses on operational subscription metrics like subscriber growth, churn patterns, and plan distribution. The SaaS Financial Model Dashboard focuses more on financial modeling, cash flow projections, and investor-ready financial metrics. Both are excellent for SaaS companies but serve different analytical purposes.
🔗 Explore Related Templates
📌 SaaS Financial Model Dashboard in HTML — Complete financial modeling template for SaaS companies with revenue projections, burn rate tracking, and investor-ready metrics.
📌 Startup Burn Rate Dashboard in HTML — Track your startup’s cash runway, monthly expenses, and funding milestones in a clean browser-based dashboard.
📌 Subscription Business Dashboard in Google Sheets — The same subscription analytics power in a cloud-based Google Sheets format for collaborative teams.
📖 Click here to read the Detailed Blog Post
🎥 Visit our YouTube channel to learn step-by-step video tutorials
👉 YouTube.com/@NextGenTemplates


Reviews
There are no reviews yet.