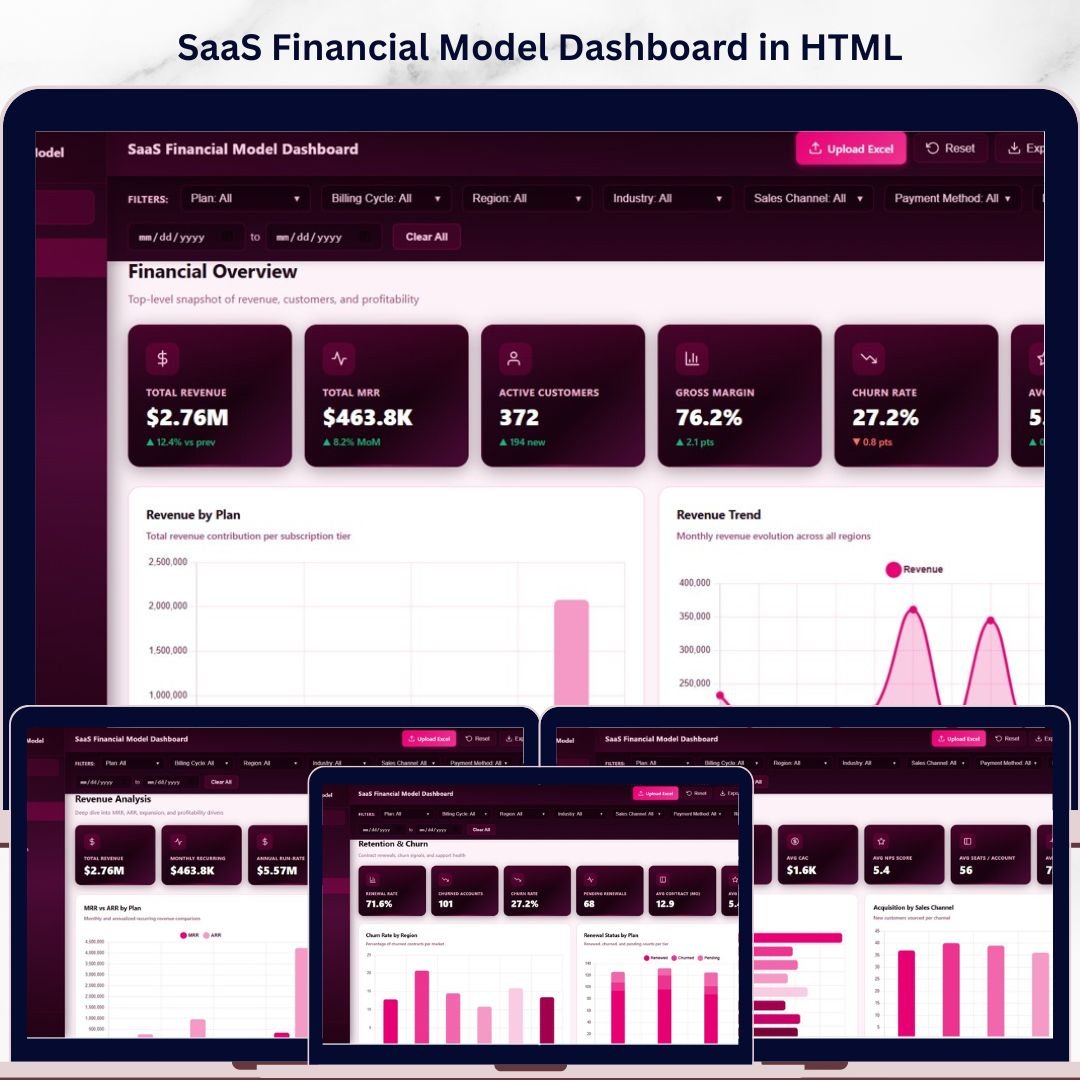


🔑 Key Features of SaaS Financial Model Dashboard in HTML
SaaS Financial Model Dashboard in HTML is a powerful, browser-based analytics template built for SaaS founders, CFOs, and finance teams who need a clear picture of their subscription business health. This dashboard includes 5 interactive pages, 6 executive KPI cards, and over 15 dynamic charts that visualize everything from monthly recurring revenue to customer churn patterns. Whether you are preparing for a board meeting, investor pitch, or quarterly business review, this template gives you instant access to all the SaaS metrics that matter most.
Unlike spreadsheet-based tools, this HTML dashboard runs directly in your browser — no Excel, no Power BI, no software installation required. Simply unzip the file, open index.html, and you are ready to go. It is the fastest way to build a professional SaaS financial dashboard without any coding or technical skills. If you are looking for more HTML Dashboard Templates, we have a growing collection covering every business domain.
📦 What’s Inside the SaaS Financial Model Dashboard in HTML
This template contains 5 purpose-built dashboard pages that cover every angle of SaaS financial analysis:
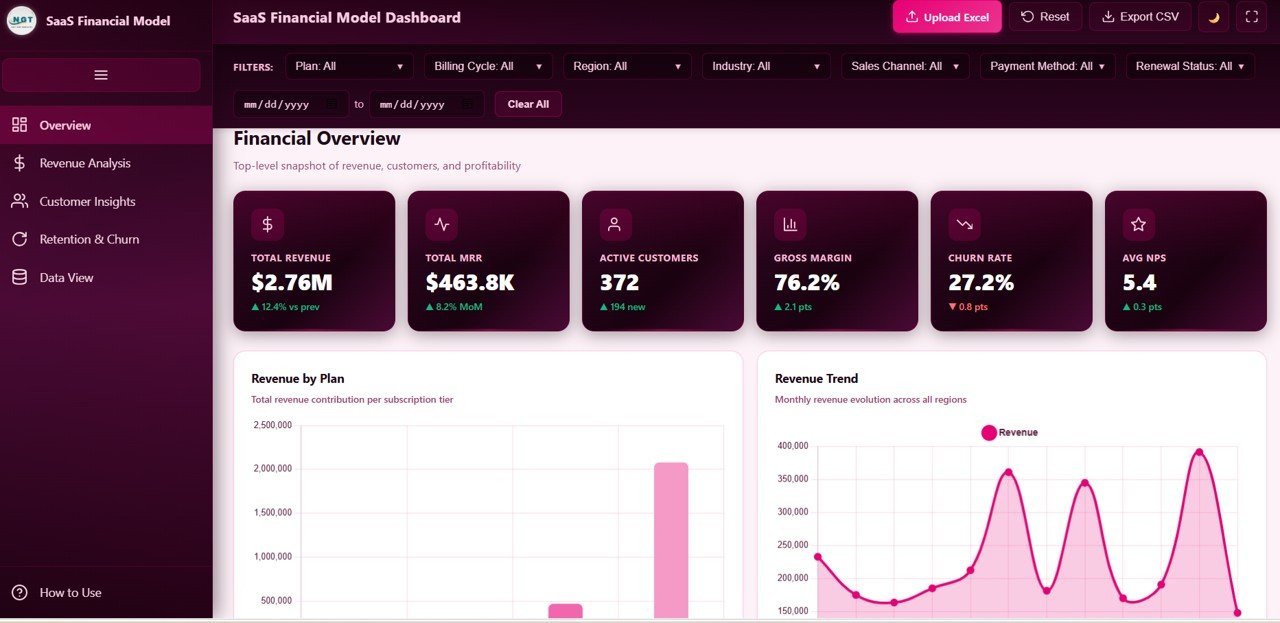
📊 Overview Page — Your command center with 6 KPI cards showing Total Revenue, Total MRR, Active Customers, Gross Margin, Churn Rate, and Average NPS. Four strategic charts display Revenue by Plan, Revenue by Month, Renewal Status Mix, and Revenue by Region. Multiple slicers let you filter the entire dashboard instantly.
 SaaS Financial Model Dashboard in HTML
📈 Revenue Analysis Page — Deep-dive into your revenue engine with MRR and ARR by Plan, Revenue by Billing Cycle, Gross Margin by Plan, and Expansion Revenue by Month charts. This page helps you understand which plans drive the most recurring revenue and where margin opportunities exist.
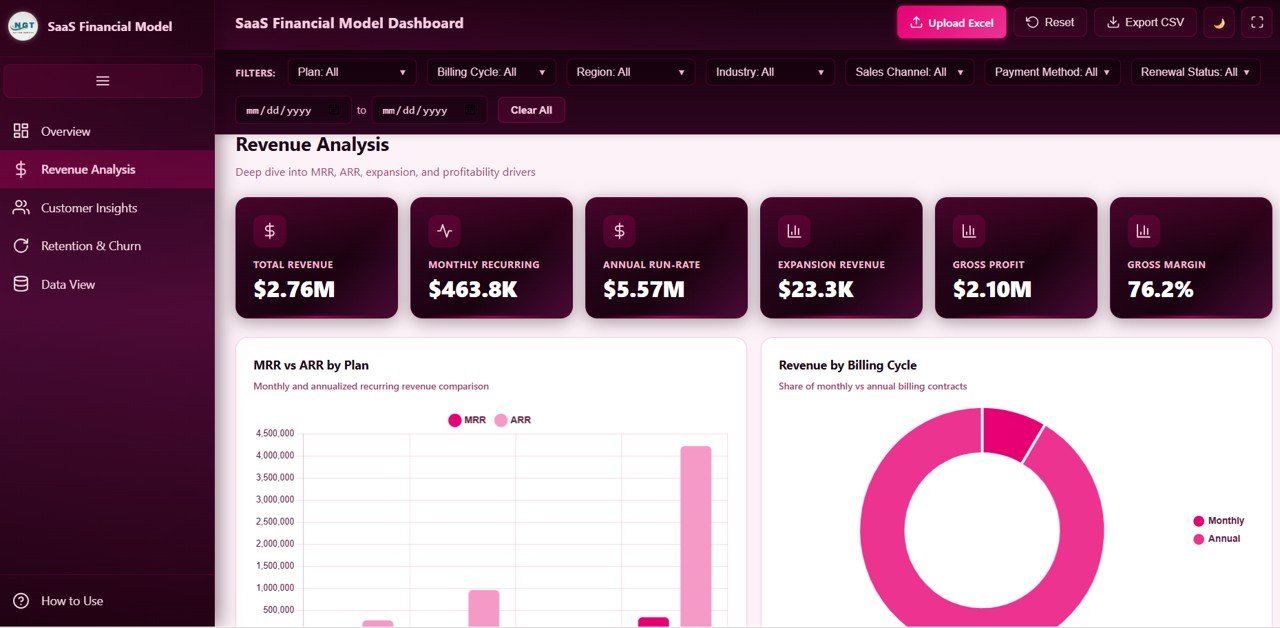 Revenue Analysis
👥 Customer Insights Page — Understand your customer base through Customers by Industry, New Customers by Sales Channel, NPS Score Distribution, and Average Seats by Plan visualizations. Perfect for identifying your strongest customer segments and acquisition channels.
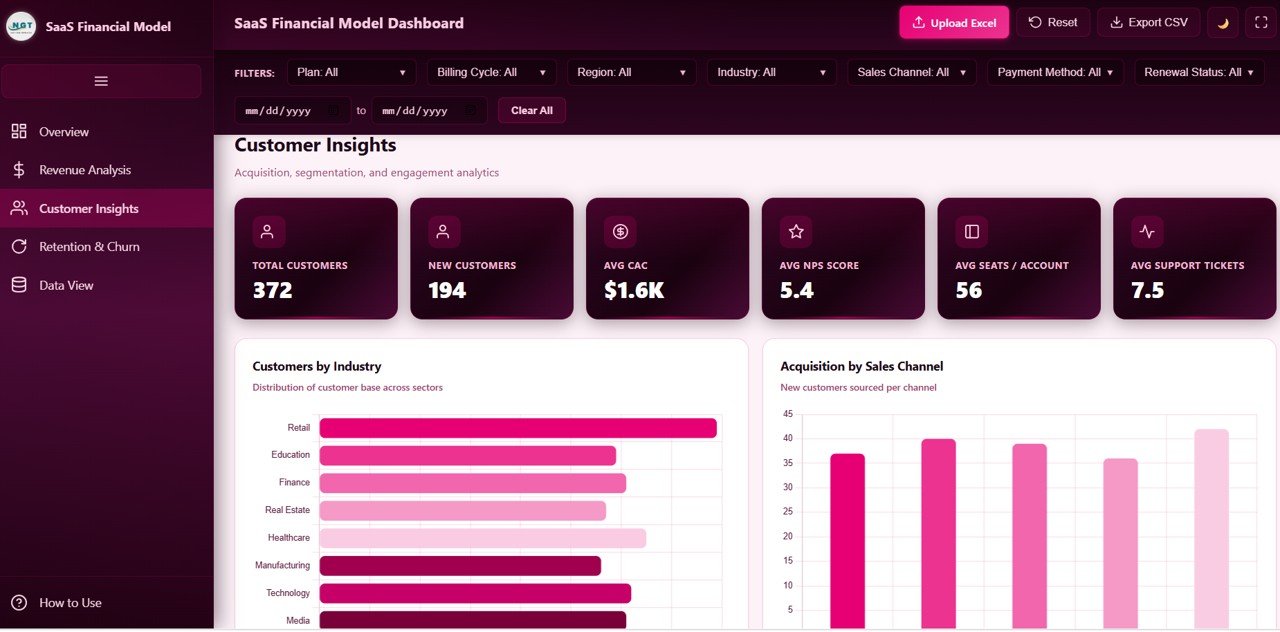 Customer Insights
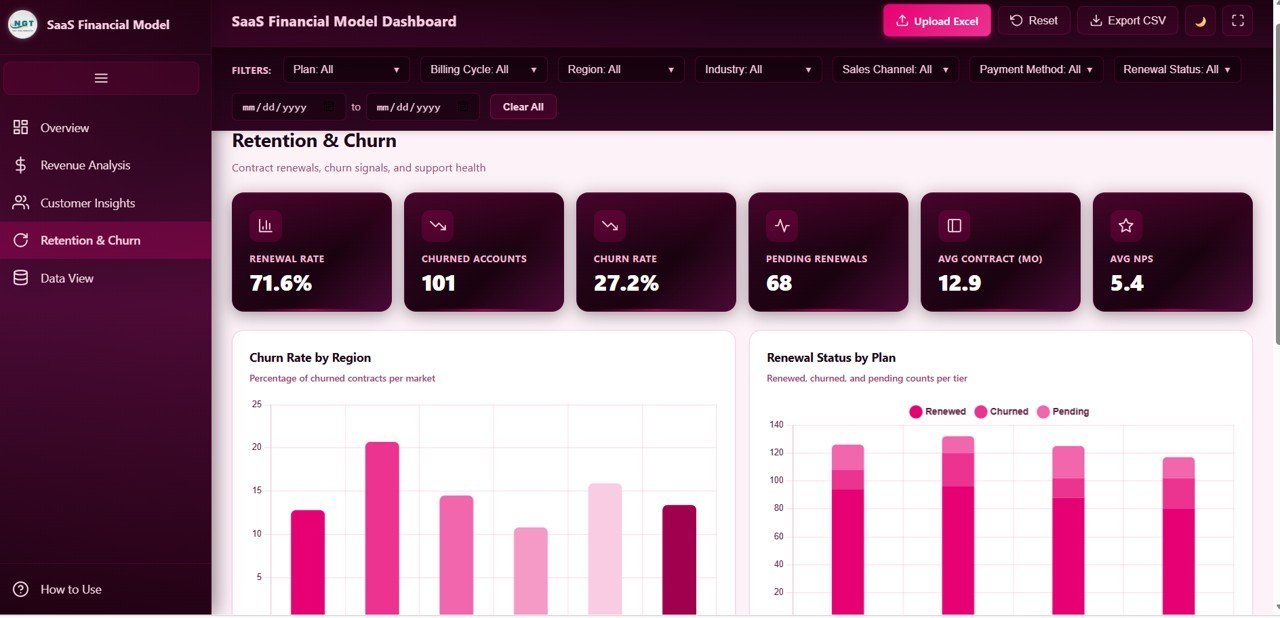
🔄 Retention and Churn Page — Track the health of your subscription base with Churn Rate by Region, Renewal Status by Plan, Average Support Tickets by Plan, and Contracts by Contract Length charts. This page is essential for reducing churn and improving customer lifetime value.
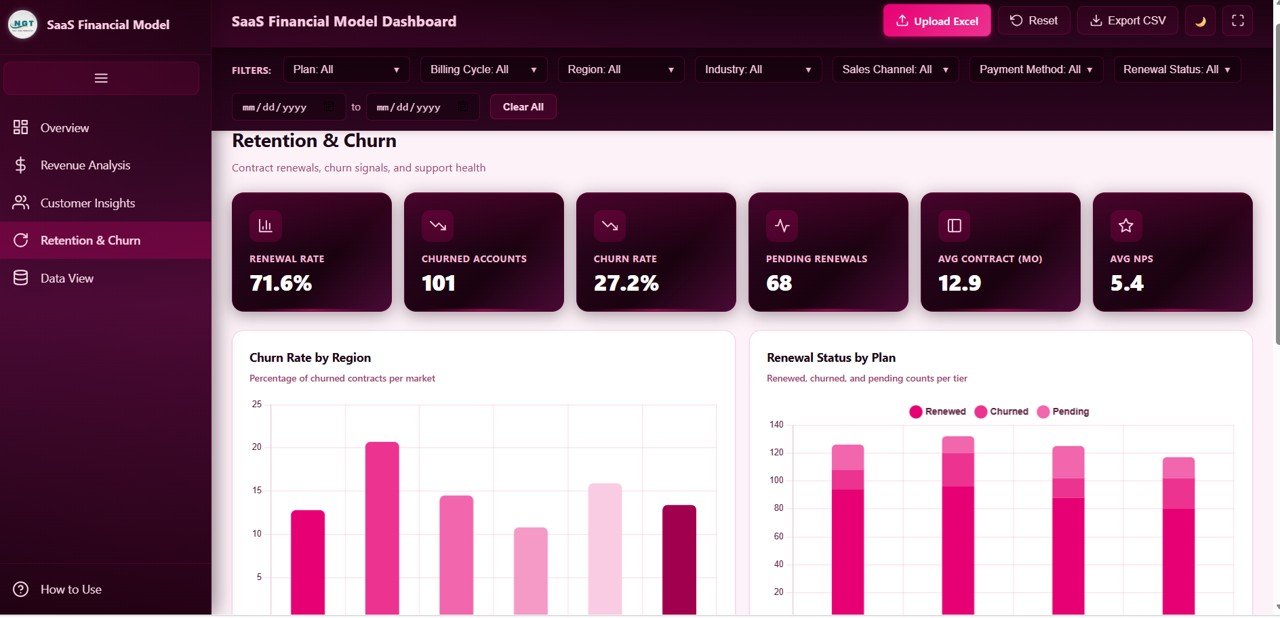 Retention and Churn
📋 Data View Page — A detailed data table with search, sort, pagination, and CSV export functionality. View all underlying records and export filtered data for further analysis.
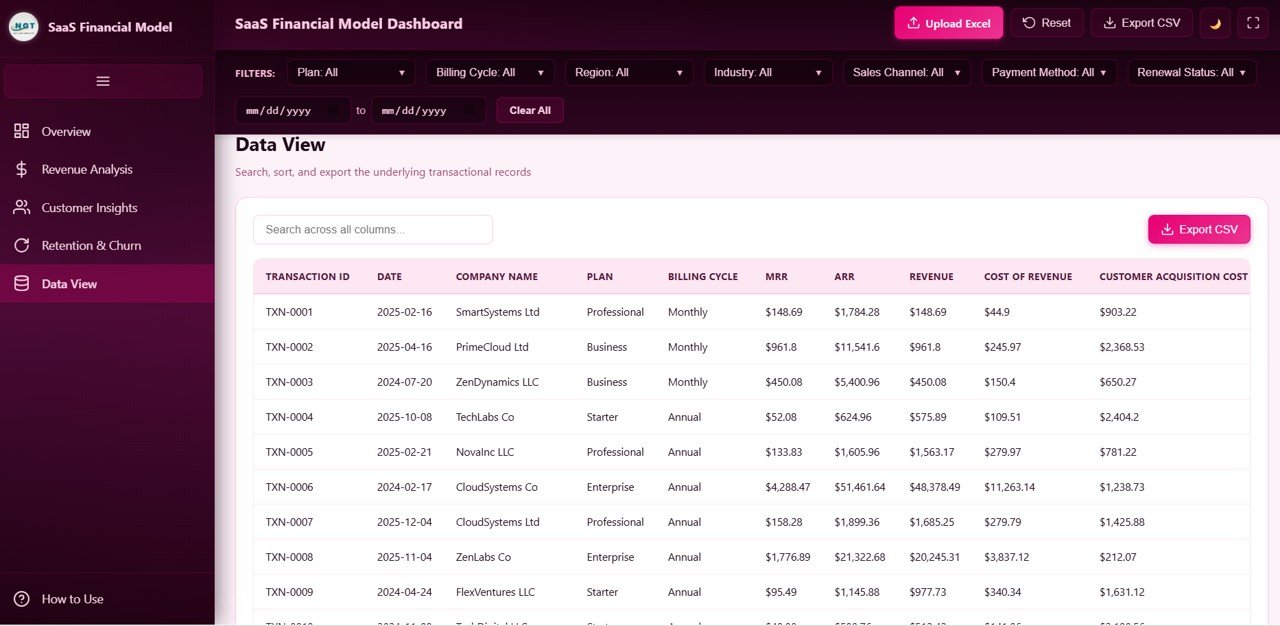 Data View
If you prefer a spreadsheet version, check out the SaaS Financial Model Dashboard in Excel or the SaaS Financial Model Dashboard in Power BI.
⚙️ How to Use the SaaS Financial Model Dashboard in HTML
1️⃣ Download and unzip the template file to your computer
2️⃣ Open the index.html file in any modern web browser (Chrome, Edge, Firefox, Safari)
3️⃣ Explore the 5 dashboard pages using the navigation tabs
4️⃣ Use the slicers and filters to drill down into specific plans, regions, or time periods
5️⃣ Replace the sample data in the data file with your own SaaS metrics
6️⃣ All charts and KPI cards update automatically once your data is connected
7️⃣ Export filtered data to CSV from the Data View tab for presentations or further analysis
👥 Who Can Benefit from This SaaS Financial Model Dashboard in HTML
📌 SaaS founders and CEOs tracking company-wide subscription metrics
📌 CFOs and finance teams preparing investor reports and board presentations
📌 Revenue operations managers monitoring MRR, ARR, and expansion revenue
📌 Customer success teams analyzing churn patterns and NPS trends
📌 Business analysts building financial models for SaaS businesses
📌 Startup consultants who need a ready-made SaaS analytics template
You might also find the Sales and Revenue Command Center Dashboard in HTML useful for broader revenue tracking, or browse our complete collection of Dashboard Templates.
❓ Frequently Asked Questions
What KPIs does the SaaS Financial Model Dashboard in HTML track?
This dashboard tracks 6 key performance indicators including Total Revenue, Monthly Recurring Revenue (MRR), Active Customers, Gross Margin, Churn Rate, and Average NPS. It also visualizes over 15 chart-based metrics across revenue, customer, and retention dimensions.
Do I need coding skills to use this HTML dashboard?
No. Simply unzip the downloaded file and open index.html in any web browser. The dashboard is completely self-contained and requires no coding, server setup, or software installation.
Can I replace the sample data with my own SaaS metrics?
Yes. The template includes a structured data file where you can paste your own subscription, revenue, and customer data. All charts and KPI cards update automatically once your data is in place.
What is the best HTML dashboard template for SaaS financial modeling?
The SaaS Financial Model Dashboard in HTML from NextGenTemplates is specifically designed for SaaS financial analysis with 5 interactive pages covering revenue, customers, retention, and churn — all running in your browser without any software dependencies.
How is this different from the Excel or Power BI version?
The HTML version runs instantly in any browser without needing Microsoft Excel or Power BI Desktop. It is ideal for quick sharing, embedding, or presenting SaaS metrics without software license requirements.
🔗 Explore Related Templates
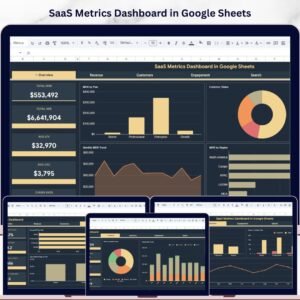
📌 SaaS Metrics Dashboard in Google Sheets — Track MRR, churn, and customer metrics in a collaborative Google Sheets format
📌 SaaS Financial Model Dashboard in Power BI — The same financial model powered by Power BI for advanced data connectivity
📌 SaaS Financial Model Dashboard in Excel — Excel-based version with pivot tables and formulas for offline analysis
📖 Click here to read the Detailed Blog Post
🎥 Visit our YouTube channel to learn step-by-step video tutorials
👉 YouTube.com/@NextGenTemplates
Watch the step-by-step video tutorial:
YouTube


Reviews
There are no reviews yet.