


Crypto Portfolio Dashboard in HTML is a professionally designed, browser-based cryptocurrency analytics template built for crypto investors, traders, portfolio managers, and finance professionals who want to monitor Total Investment, Current Portfolio Value, Total Gain/Loss, Total Transactions, Avg Transaction Fee, and Profitable Trades % from a single, powerful interactive dashboard. This HTML dashboard template includes 5 interactive pages covering Overview, Portfolio Analysis, Performance Tracking, Exchange & Risk Analysis, and a full Data View — opening directly in any modern web browser with zero software installation required.
Whether you manage a diversified crypto portfolio or track daily trading performance across multiple exchanges, this dashboard transforms raw transaction data into stunning, actionable visual insights. If you have been searching for a reliable, data-driven way to monitor portfolio performance, analyze exchange-level metrics, evaluate risk exposure, and track monthly gain/loss trends, the Crypto Portfolio Dashboard in HTML is the solution you need. Also explore our Crypto Portfolio Dashboard in Power BI for advanced Power BI analytics and our Crypto Portfolio Dashboard in Excel for pivot-table-powered analysis.
🔑 Key Features of Crypto Portfolio Dashboard in HTML
📌 5 Interactive Dashboard Pages – Overview, Portfolio Analysis, Performance Tracking, Exchange & Risk Analysis, and Data View pages give you a 360-degree view of your entire cryptocurrency portfolio directly in any web browser.
📌 6 High-Level KPI Cards – Track Total Investment, Current Portfolio Value, Total Gain/Loss, Total Transactions, Avg Transaction Fee, and Profitable Trades % at a glance from the Overview page for a quick executive summary of your crypto holdings.
📌 Dynamic Slicers and Filters – Apply multiple slicers to filter the entire dashboard by cryptocurrency, exchange, wallet type, risk level, transaction status, category, and more with a single click.
📌 Multi-Dimensional Analysis Charts – Over 15 interactive charts across 5 pages covering investment breakdowns, portfolio allocation, performance trends, exchange comparisons, and risk distribution.
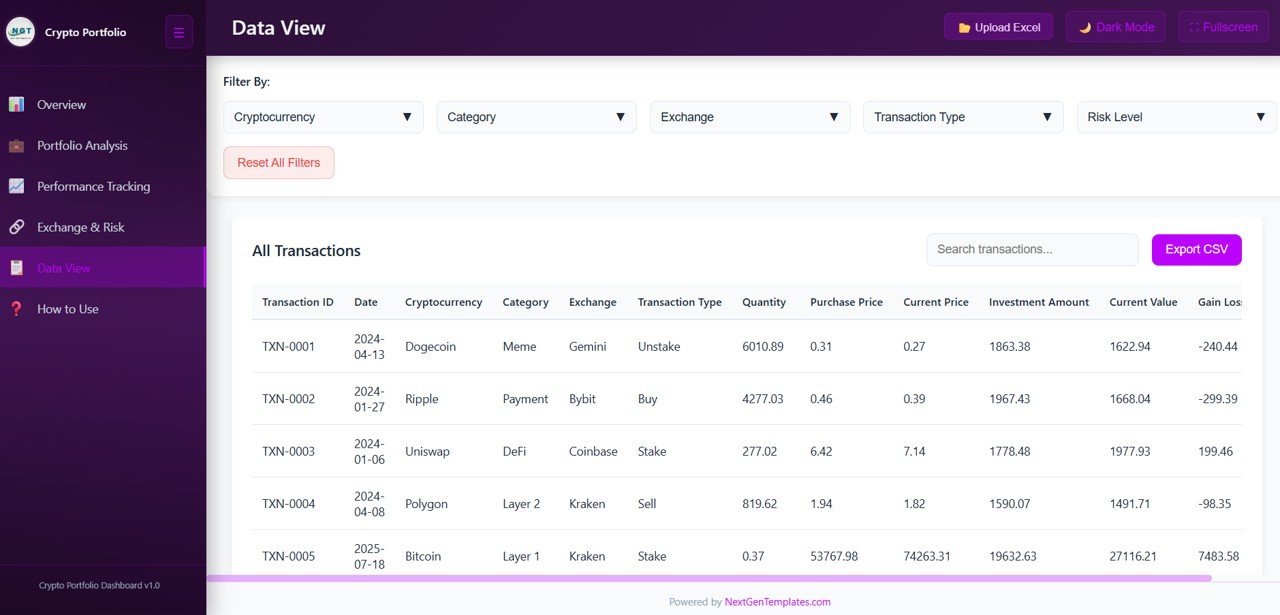
📌 Full Data Table with CSV Export – The Data View page lets you search, sort, paginate, and export all your crypto transaction records to CSV for further offline analysis.
📌 Zero Installation Required – Simply unzip the file and open index.html in Chrome, Edge, Firefox, or any modern browser. No software, plugins, or subscriptions needed.
📌 Easy Data Replacement – Replace the sample data in the data file with your own crypto transaction records and the entire dashboard updates automatically.
📌 Professional Modern Design – Clean, visually appealing layout with consistent color coding across all 5 dashboard pages for executive-level presentations and personal portfolio tracking.
📦 What’s Inside the Crypto Portfolio Dashboard in HTML
This HTML template delivers 5 purpose-built dashboard pages, each designed to give you unique analytical perspectives on your cryptocurrency investments.
📊 Overview Page — The command center of your crypto portfolio. At the top, 6 KPI cards display Total Investment, Current Portfolio Value, Total Gain/Loss, Total Transactions, Avg Transaction Fee, and Profitable Trades %. Below, interactive charts show Investment Amount by Cryptocurrency revealing how your capital is distributed across different coins, Current Value by Category showing portfolio allocation across crypto categories, Transaction Count by Exchange comparing trading activity across platforms, Gain/Loss by Month tracking monthly profitability trends, and Transaction Status Distribution showing the breakdown of completed, pending, and failed transactions. Multiple slicers let you filter and drill down instantly.
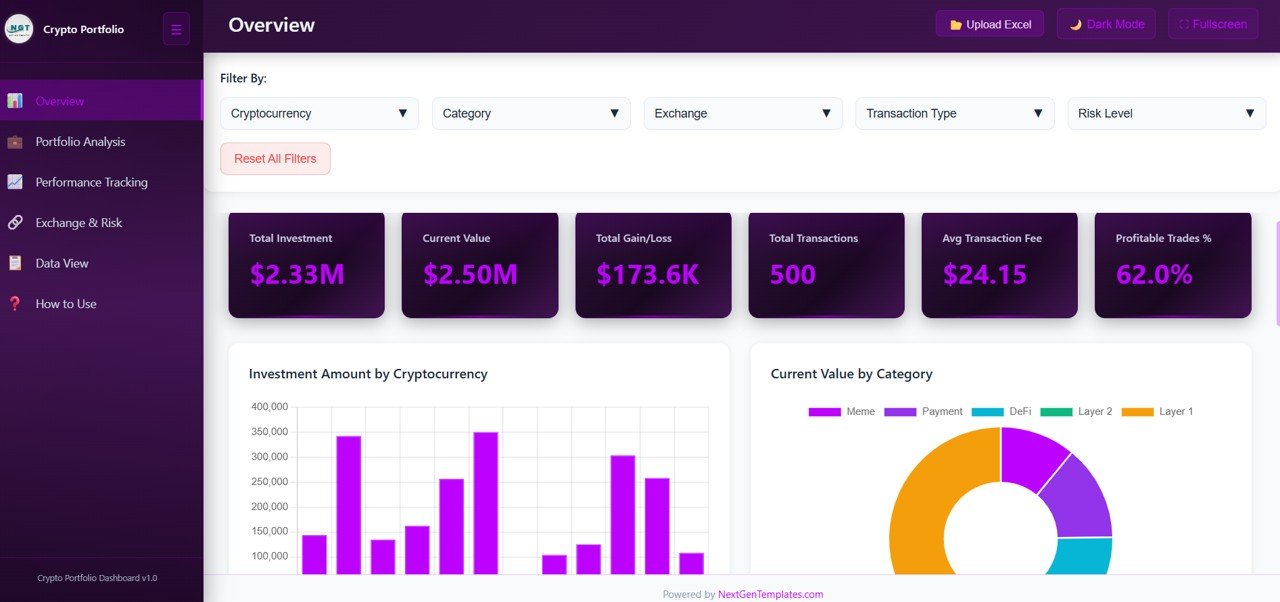
Crypto Portfolio Dashboard in HTML
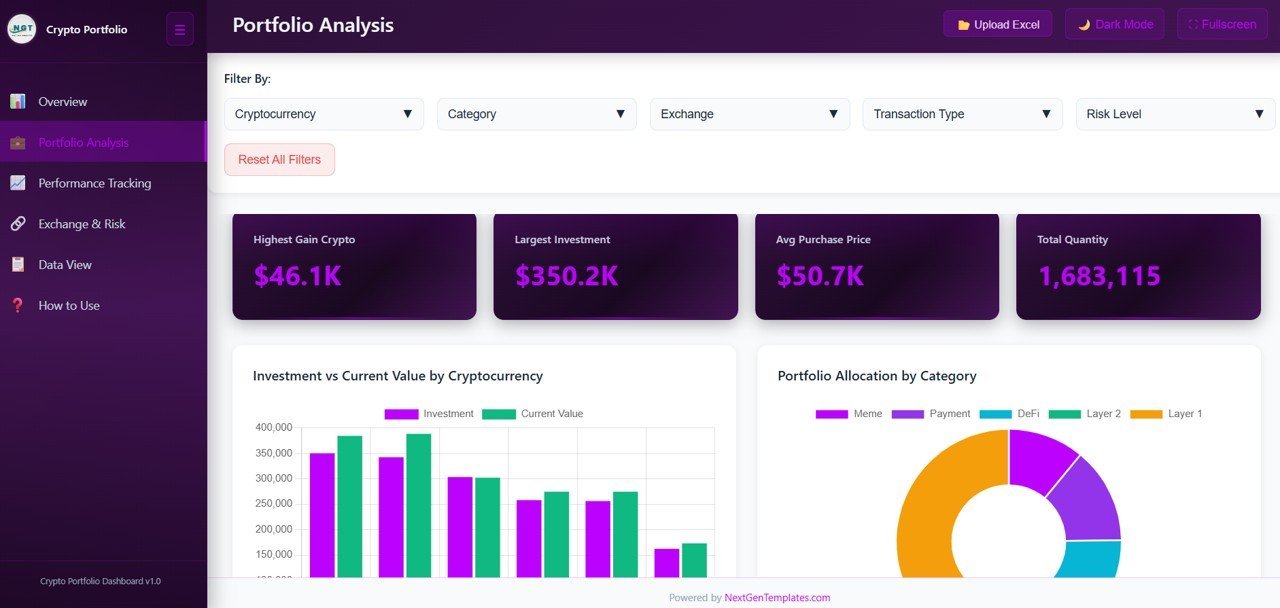
📊 Portfolio Analysis Page — Dive deeper into your holdings with Investment vs Current Value by Cryptocurrency comparing what you invested versus current worth for each coin, Portfolio Allocation by Category showing how your investments distribute across different crypto categories, Average Purchase Price vs Current Price by Top Cryptos helping identify undervalued or overvalued positions, and Investment Amount by Wallet Type revealing how your capital is spread across hot wallets, cold wallets, and exchange wallets. Explore similar analytics in our Blockchain & Cryptocurrency Dashboard in Power BI.

Portfolio Analysis
📊 Performance Tracking Page — Monitor cost efficiency and profitability trends with Monthly Gain/Loss Trend visualizing your portfolio performance over time, Profitable vs Unprofitable Trades by Cryptocurrency highlighting which coins deliver consistent returns, Cumulative Investment by Month showing how your total invested capital grows, and Gain/Loss by Transaction Type comparing buy, sell, and swap performance.
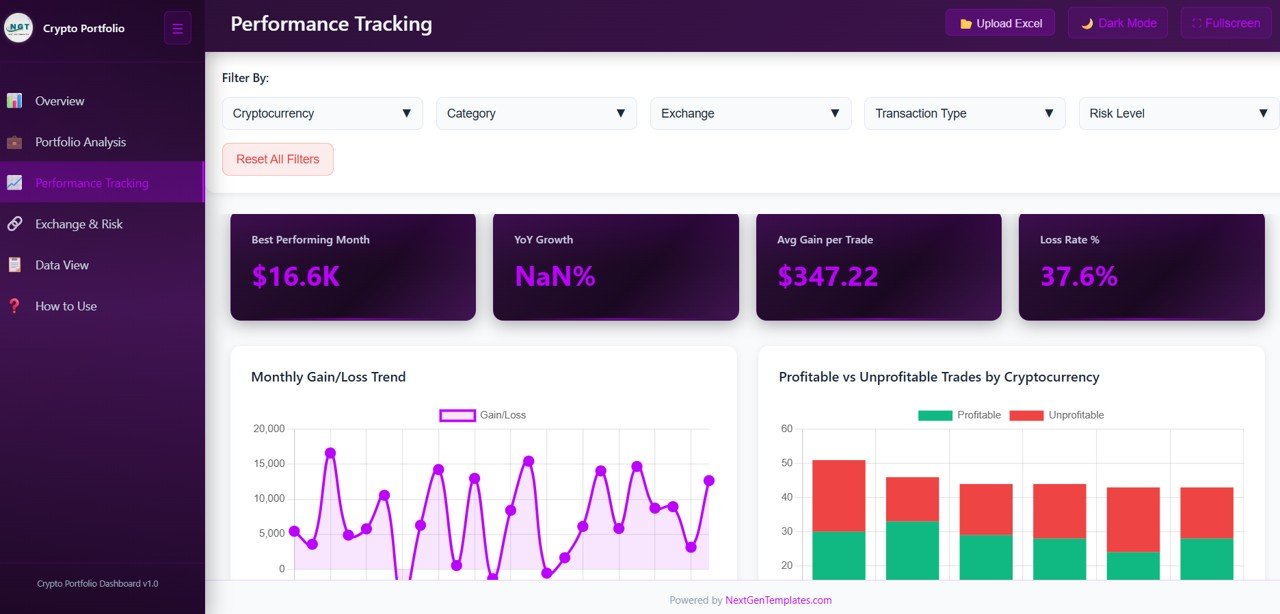
Performance Tracking
📊 Exchange & Risk Analysis Page — Compare exchange-level metrics and risk exposure with Investment by Exchange showing capital allocation across trading platforms, Risk Distribution by Cryptocurrency revealing the risk profile of each coin in your portfolio, Transaction Fee by Exchange helping identify the most cost-effective platforms, and Transaction Volume by Network tracking activity across different blockchain networks.
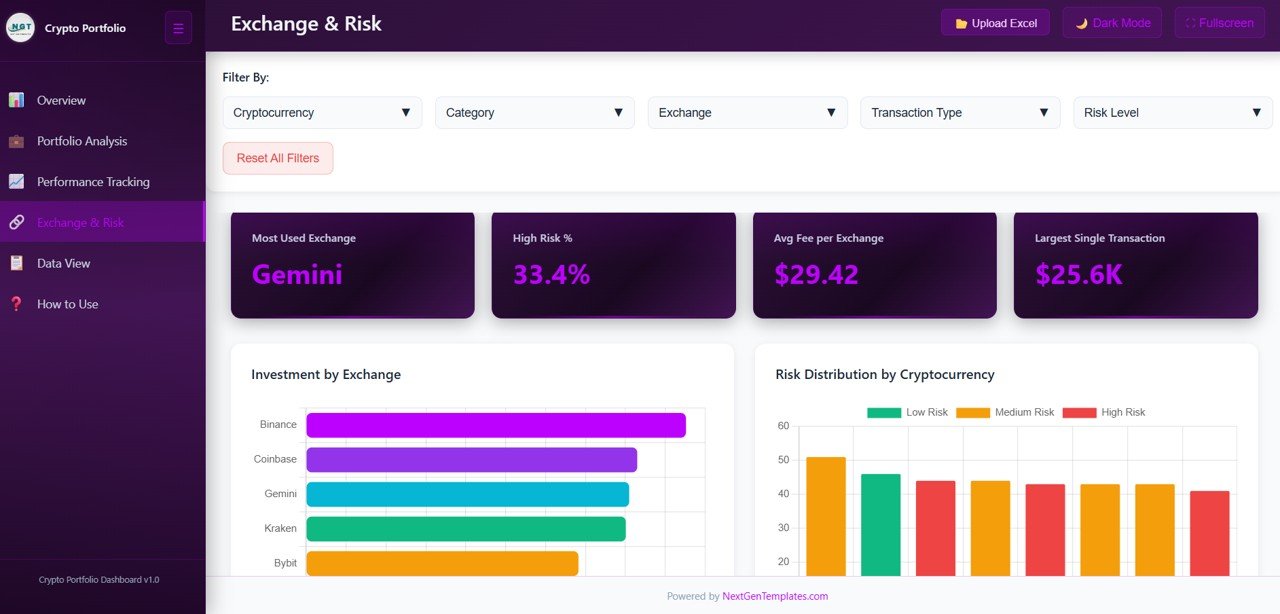
Exchange & Risk Analysis
📊 Data View Page — This is the detailed data table page. Here you can see all the crypto transaction records with powerful search, sort, and pagination features. You can also export the filtered data to CSV for further offline analysis and reporting.

Data View
⚙️ How to Use the Crypto Portfolio Dashboard in HTML
1️⃣ Download and unzip the file to your computer.
2️⃣ Open index.html in any modern browser (Chrome, Edge, Firefox).
3️⃣ Replace the sample data in the data file with your own cryptocurrency transaction records.
4️⃣ Use the interactive slicers and filters to analyze your portfolio by cryptocurrency, exchange, wallet type, risk level, or time period.
5️⃣ Navigate between the 5 pages using the tab navigation to explore different analytical perspectives.
6️⃣ Export data from the Data View page to CSV for sharing with financial advisors or for tax reporting.
👥 Who Can Benefit from This Crypto Portfolio Dashboard in HTML
🔹 Crypto Investors & Traders – Track portfolio performance, gain/loss, and profitable trade percentages across multiple exchanges and cryptocurrencies.
🔹 Portfolio Managers – Monitor client portfolios with professional-grade visuals and risk analysis dashboards.
🔹 Financial Analysts – Analyze exchange-level performance, fee structures, and investment allocation patterns.
🔹 Finance Students & Educators – Learn data visualization using real-world crypto market data and KPI tracking.
🔹 Fintech Startups – Use as a foundation for building client-facing crypto analytics reporting tools.
🔹 Anyone Managing Crypto Investments – Whether you hold 3 coins or 30, this dashboard gives you complete visibility into your portfolio health.
❓ Frequently Asked Questions
What KPIs does the Crypto Portfolio Dashboard in HTML track?
The Crypto Portfolio Dashboard in HTML tracks 6 key metrics: Total Investment, Current Portfolio Value, Total Gain/Loss, Total Transactions, Avg Transaction Fee, and Profitable Trades %. It also includes 15+ charts across 5 interactive pages covering investment breakdown, portfolio allocation, performance trends, exchange analysis, and risk distribution.
Do I need any special software to use this HTML crypto dashboard?
No. Simply unzip the downloaded file and open index.html in any modern web browser like Chrome, Edge, or Firefox. No installations, plugins, subscriptions, or coding skills are required.
Can I track multiple cryptocurrencies and exchanges in this template?
Yes. The dashboard supports tracking unlimited cryptocurrencies across multiple exchanges, wallet types, and risk levels. The Exchange & Risk Analysis page provides dedicated charts for comparing performance across different trading platforms and blockchain networks.
What is the best HTML dashboard for tracking a crypto portfolio?
The Crypto Portfolio Dashboard in HTML from NextGenTemplates is one of the most comprehensive browser-based crypto analytics solutions available. It includes 5 dedicated analysis pages covering overview, portfolio analysis, performance, exchange & risk analysis, and data export — all running directly in a web browser.
How do I replace the sample data with my own cryptocurrency data?
Open the data file included in the download, replace the sample records with your own crypto transaction data following the same column structure, save the file, and refresh the browser. All charts and KPIs update automatically.
🔗 Explore Related Templates
🔹 Crypto Portfolio Dashboard in Power BI — Advanced Power BI crypto analytics with interactive filtering and 5 dashboard pages.
🔹 Crypto Portfolio Dashboard in Excel — Pivot-table-powered crypto portfolio tracking in Microsoft Excel.
🔹 Blockchain Finance Dashboard in Power BI — Comprehensive blockchain financial analytics with risk assessment.
📖 Click here to read the Detailed Blog Post
🎥 Visit our YouTube channel to learn step-by-step video tutorials
👉 YouTube.com/@NextGenTemplates
Watch the step-by-step video tutorial:
YouTube


Reviews
There are no reviews yet.