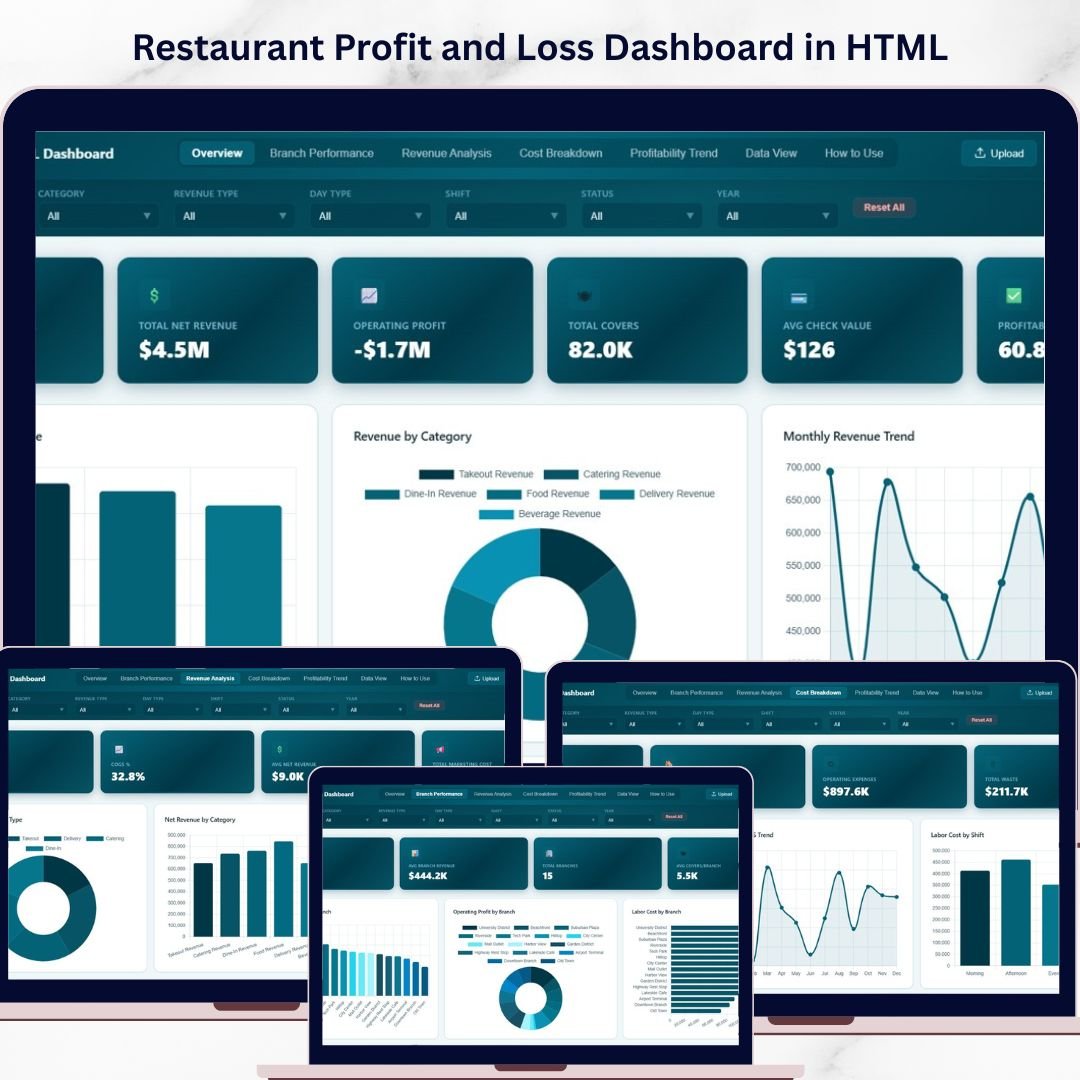

🔑 Key Features of Restaurant Profit and Loss Dashboard in HTML
Restaurant Profit and Loss Dashboard in HTML is a professionally designed, interactive, browser-based analytics template built specifically for restaurant owners, food service managers, finance teams, and hospitality consultants who need to track gross revenue, net revenue, operating profit, cost of goods sold, labor costs, and waste across multiple restaurant branches — all from a single dynamic dashboard that opens instantly in any web browser. This template includes 5 interactive dashboard pages covering Overview, Branch Performance, Revenue Analysis, Cost Breakdown, and Data View, making it one of the most comprehensive HTML Dashboard Templates available for the restaurant industry.
Whether you operate a single restaurant or manage a chain of branches, this dashboard transforms your raw financial data into beautiful, actionable visual insights. No installation, no plugins, no licenses — just unzip and open. If you have been looking for a modern, data-driven alternative to spreadsheets for monitoring restaurant profitability, the Restaurant Profit and Loss Dashboard in HTML is the perfect solution.
📦 What’s Inside the Restaurant Profit and Loss Dashboard in HTML
The Overview page displays 6 high-level KPI cards — Total Gross Revenue, Total Net Revenue, Operating Profit, Total Covers, Avg Check Value, and Profitability Rate — giving you an instant snapshot of your restaurant’s financial health. Below the cards, interactive charts visualize Gross Revenue by Restaurant, Revenue by Category, Monthly Revenue Trend, Status Distribution, and Revenue by Day Type. Multiple slicer filters let you drill down instantly by branch, category, or time period.
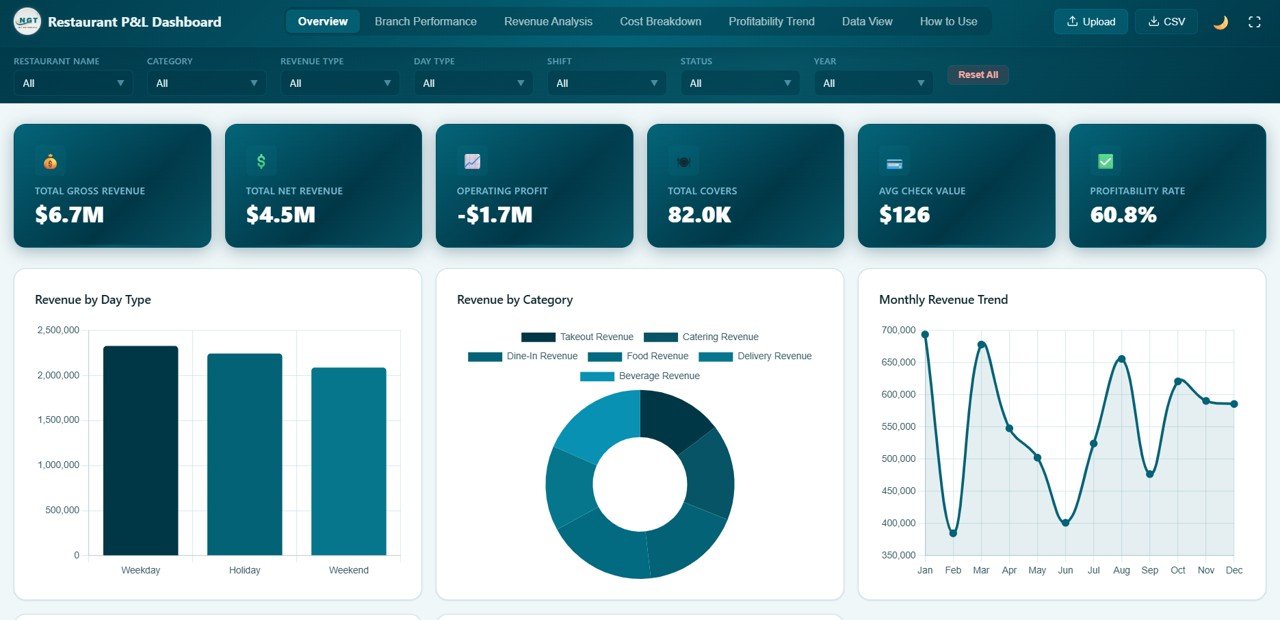
Overview Page
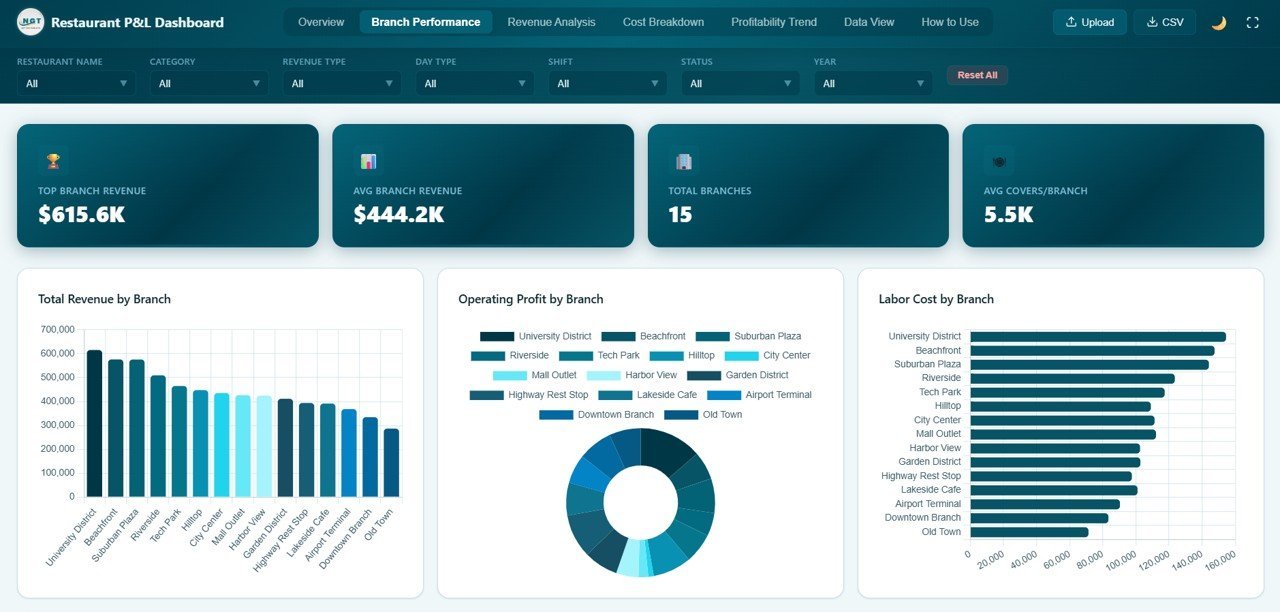
The Branch Performance page compares all your restaurant locations side by side with charts for Total Revenue by Branch, Operating Profit by Branch, Labor Cost by Branch, Waste Amount by Branch, and Covers by Branch. This page is essential for multi-location restaurant operators who need to identify top-performing and underperforming branches quickly.

Branch Performance
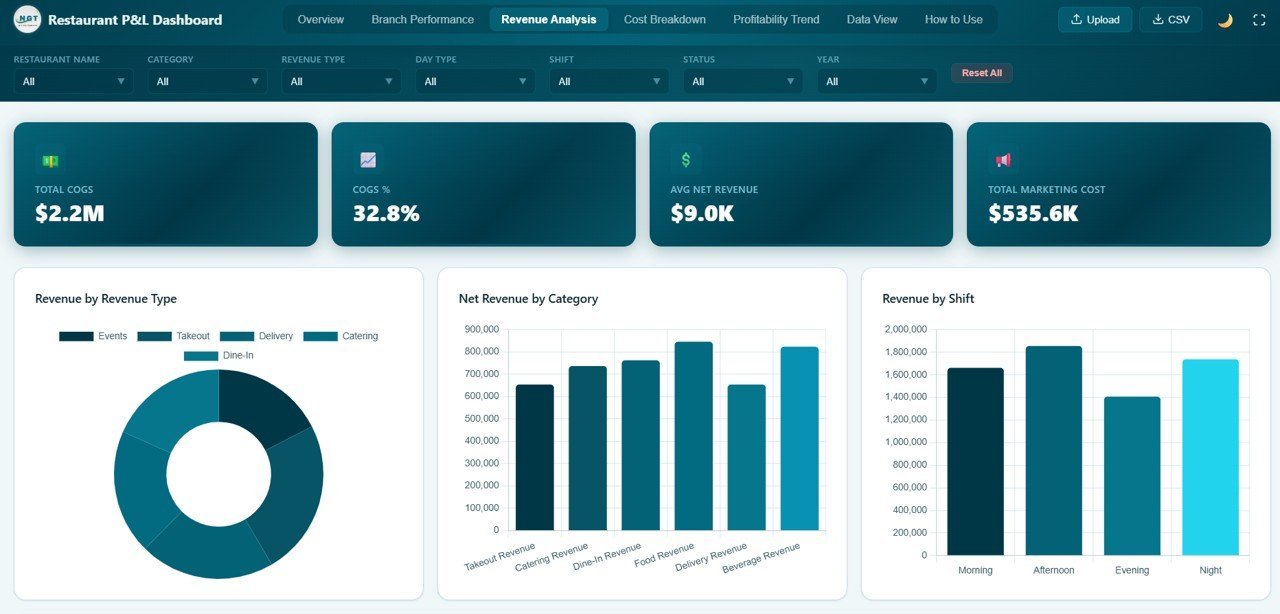
The Revenue Analysis page provides deep insights into revenue streams with Revenue by Revenue Type, Net Revenue by Category, Revenue by Shift, Gross vs Net Revenue by Month, and Revenue Type by Day Type. Understand exactly where your revenue comes from and how it fluctuates across shifts, day types, and categories.

Revenue Analysis
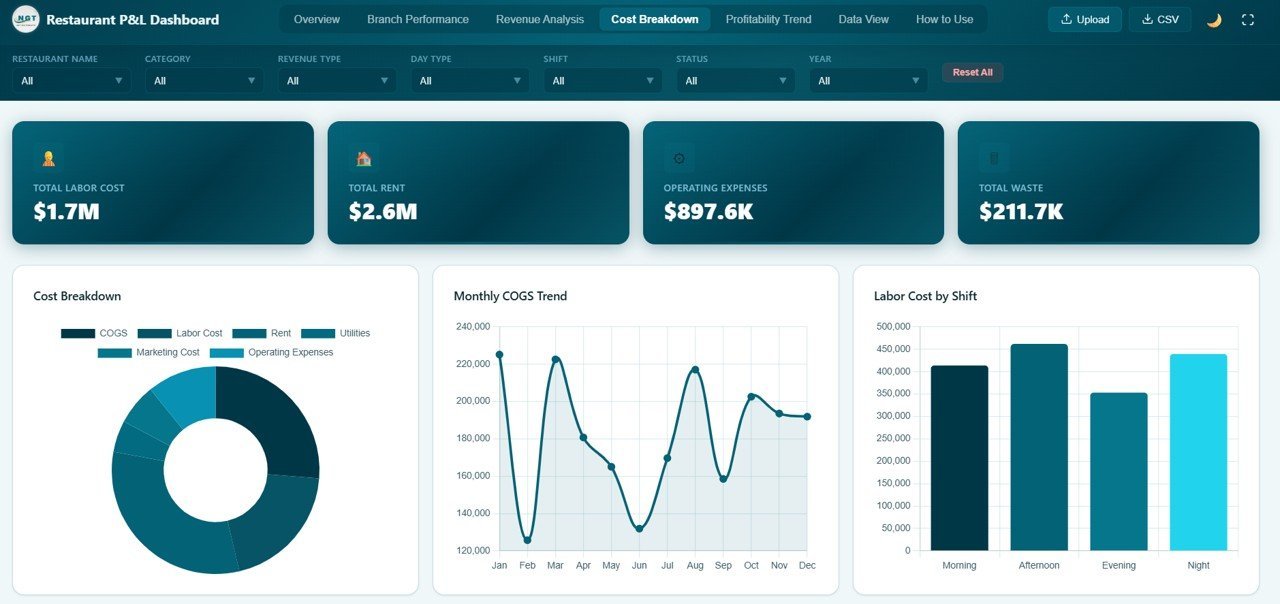
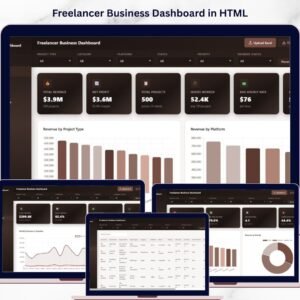
The Cost Breakdown page helps you control expenses with Cost Breakdown by Category, Monthly COGS Trend, Labor Cost by Shift, Waste by Category, and Cost by Restaurant. This is where you identify cost leaks and optimize your restaurant’s bottom line. Explore related templates like the Personal Finance Dashboard in HTML or the Freelancer Business Dashboard in HTML for other financial tracking needs.
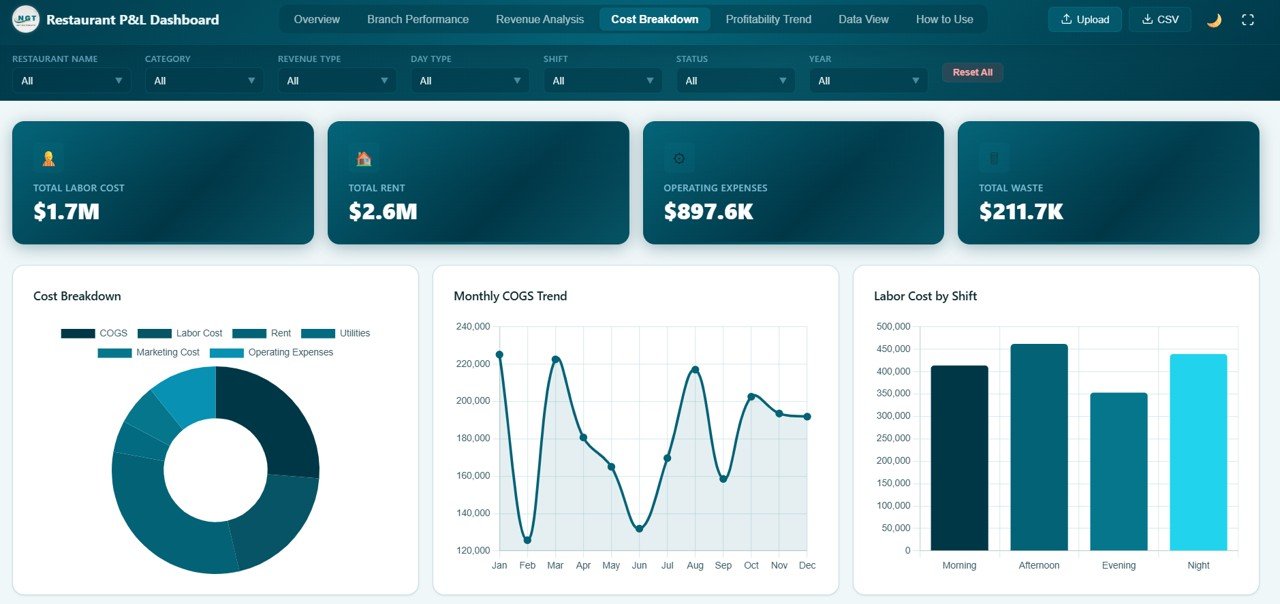
Cost Breakdown
The Data View page is a detailed data table with search, sort, pagination, and CSV export features so you can explore every record in your dataset.
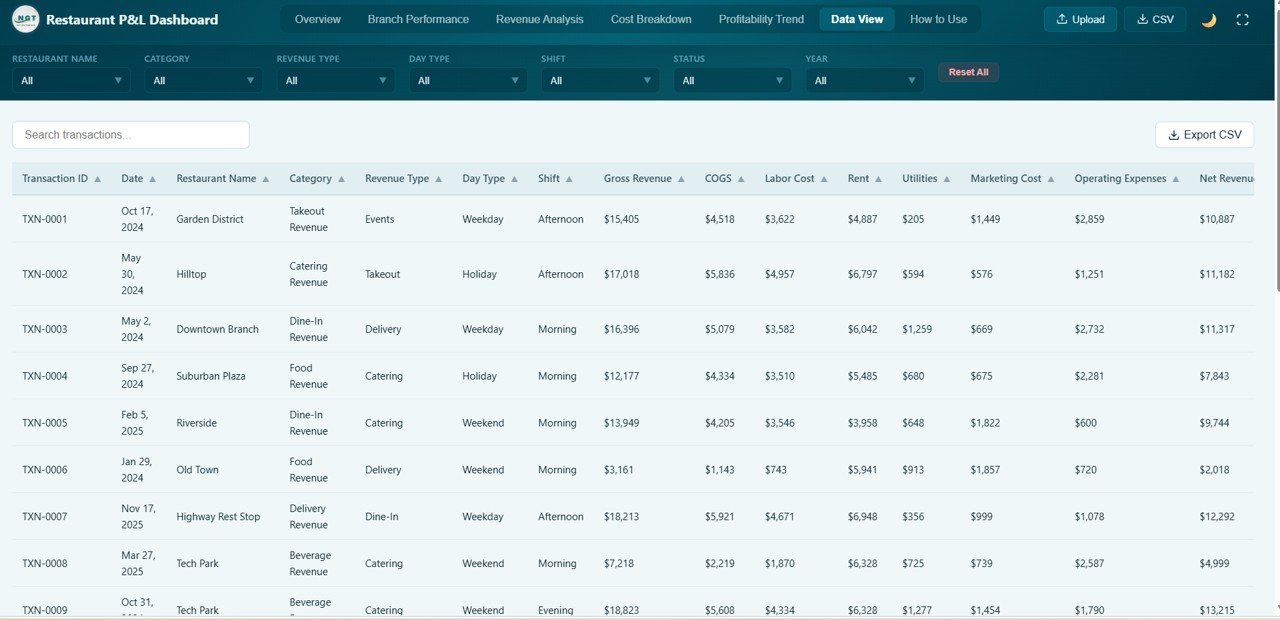
Data View
⚙️ How to Use the Restaurant Profit and Loss Dashboard in HTML
1️⃣ Download and unzip the file to your computer. 2️⃣ Open index.html in any modern browser like Chrome, Firefox, or Edge. 3️⃣ Replace the sample data in the data file with your own restaurant financial records. 4️⃣ All charts, KPI cards, and filters update automatically. 5️⃣ Use the slicer filters to drill down by branch, category, shift, or time period. 6️⃣ Export filtered data from the Data View tab for reporting or accounting purposes.
👥 Who Can Benefit from This Restaurant Profit and Loss Dashboard in HTML
🔹 Restaurant Owners and Operators tracking profitability across locations 🔹 Food Service Managers monitoring revenue, costs, and waste 🔹 Finance Teams analyzing COGS, labor, and operating margins 🔹 Hospitality Consultants providing data-driven insights to clients 🔹 Multi-Branch Chains comparing branch-level performance 🔹 Students learning restaurant financial analytics and data visualization
❓ Frequently Asked Questions
What KPIs does the Restaurant Profit and Loss Dashboard in HTML track?
This dashboard tracks 6 key performance indicators including Total Gross Revenue, Total Net Revenue, Operating Profit, Total Covers, Avg Check Value, and Profitability Rate. It also includes 20+ analytical charts across 5 pages covering branch performance, revenue analysis, cost breakdown, and a searchable data view.
Do I need any software to use this restaurant dashboard?
No. Simply unzip the downloaded file and open index.html in any modern web browser. No Excel, Power BI, or additional software installation is required.
Can I customize the data with my own restaurant records?
Yes. Replace the sample data file with your own restaurant financial records and all charts, KPIs, and filters update automatically.
Is this dashboard suitable for multi-branch restaurant chains?
Absolutely. The Branch Performance page is specifically designed to compare revenue, profit, labor costs, waste, and covers across multiple restaurant locations side by side.
What is the best HTML dashboard template for restaurant profit and loss tracking?
The Restaurant Profit and Loss Dashboard in HTML from NextGen Templates is the most comprehensive browser-based P&L analytics solution for restaurants. It includes 5 interactive pages, 6 KPI cards, branch comparison, revenue analysis, cost breakdown, and a data explorer with CSV export — all in a single HTML file.
🔗 Explore Related Templates
🔹 SaaS Metrics Dashboard in HTML — Track subscription revenue, customer health, and churn risk in a browser-based dashboard.
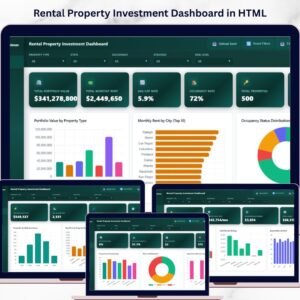
🔹 Rental Property Investment Dashboard in HTML — Monitor rental portfolio value, ROI, occupancy, and financing risk.
🔹 Personal Finance Dashboard in HTML — Track income, expenses, savings, and budgets in a browser-based dashboard.
📖 Click here to read the Detailed Blog Post
🎥 Visit our YouTube channel to learn step-by-step video tutorials
👉 YouTube.com/@NextGenTemplates
Watch the step-by-step video tutorial:
YouTube


Reviews
There are no reviews yet.