



The Vertical Timeline Chart Using Scatter Chart in Excel is a unique and visually striking tool designed to display events, milestones, or project timelines along a vertical axis. This type of chart is ideal for illustrating a sequence of events or activities over time, making it easier to track progress and visualize key moments in your project or historical data.
By using a scatter chart for the vertical timeline, this tool enables you to create a clean, engaging timeline that can be customized to suit any type of data, whether it’s tracking project milestones, historical events, or personal achievements. The Vertical Timeline Chart in Excel is simple to implement and doesn’t require complex coding or macros, making it accessible for users of all skill levels.

Key Features of the Vertical Timeline Chart Using Scatter Chart in Excel
📌 Vertical Event Representation
This chart uses a vertical axis to represent events or milestones in chronological order. Each event is displayed along the vertical line, providing a clear, structured view of the timeline.
🛠 Scatter Chart for Precise Event Placement
Using a scatter chart ensures that events are plotted with precision, allowing you to accurately represent the timing and sequencing of events along the timeline. You can easily adjust and customize each event’s position based on your data.
💡 Customizable Design
You can customize the chart to reflect your needs. Adjust colors, labels, and axis settings to represent the data in the way that best suits your project or presentation. This makes it an ideal tool for personal, business, or academic use.
🔢 Clear Data Presentation
The scatter chart layout ensures that your data is presented clearly and is easy to interpret. The vertical alignment makes it easy to see how events are ordered over time, helping you follow the progress of a project or a series of activities.
🚀 Real-Time Updates
As you add new data or modify existing entries, the vertical timeline chart automatically updates in real time. This feature allows you to keep your timeline current without having to manually adjust the chart every time new information is added.
📊 Interactive and Customizable
While macros are not required, the chart can still be made dynamic with Excel’s built-in features, such as dynamic labels, data markers, and formatting options. This interactivity makes it easier to engage with the data and highlight key moments.
⚙ Simple Setup and Customization
Setting up the Vertical Timeline Chart is easy and does not require advanced Excel skills. With clear, step-by-step instructions provided, you can have your timeline up and running in no time.
🚀 Why You’ll Love the Vertical Timeline Chart Using Scatter Chart in Excel
✅ Easy-to-Create – No need for complex coding or macros, just use a scatter chart in Excel. ✅ Customizable Design – Tailor the chart to your needs by adjusting labels, colors, and event markers. ✅ Clear Event Representation – Display events or milestones clearly along a vertical axis. ✅ Real-Time Updates – The chart automatically adjusts as you input new data. ✅ Interactive and Engaging – Make your timeline dynamic with customizable features.
📂 What’s Inside the Vertical Timeline Chart Using Scatter Chart in Excel?
- Vertical Timeline Chart: A scatter chart-based timeline to represent events along a vertical axis.
- Customizable Features: Adjust event markers, colors, and labels to fit your project needs.
- Real-Time Data Updates: The chart updates automatically as new data is added.
- Clear Setup Instructions: Simple, easy-to-follow steps for creating and customizing the timeline.
🔍 How to Use the Vertical Timeline Chart Using Scatter Chart in Excel
1️⃣ Download the Template – Instant access to the Excel file upon purchase. 2️⃣ Input Your Event Data – Enter your events or milestones along with their dates or time stamps. 3️⃣ Customize the Chart – Adjust labels, event markers, and colors to suit your needs. 4️⃣ Track and Monitor – Use the timeline to monitor the progress of your project or historical events. 5️⃣ Present and Share – Use the timeline in reports, presentations, or meetings to showcase your data.
🎯 Who Can Benefit from the Vertical Timeline Chart Using Scatter Chart in Excel? 🔹 Project Managers
🔹 Event Planners
🔹 Business Owners
🔹 Educators and Researchers
🔹 Anyone tracking milestones or events over time
🔹 Professionals presenting historical timelines or project timelines
Track and display events or milestones clearly with the Vertical Timeline Chart Using Scatter Chart in Excel. This tool provides a dynamic, real-time view of your timeline, making it easy to manage projects, visualize progress, and communicate key moments.
Click here to read the Detailed blog post
https://www.pk-anexcelexpert.com/vertical-timeline-chart-using-scatter-chart-in-excel/
Visit our YouTube channel to learn step-by-step video tutorials
Watch the step-by-step video tutorial:
Compatibility and Requirements
- Works in Microsoft Excel desktop (Excel 2016 or later, or Microsoft 365).
- It is built on a standard scatter chart, so no macros are needed.
- New to Excel charts? Microsoft explains the basics in Create a chart from start to finish.
Frequently Asked Questions
What does the chart show?
Events or milestones placed in date order along a vertical axis, drawn with a scatter chart.
Does it update when I add events?
Yes. Add or edit an event and the timeline redraws on its own.
Can I change the look?
Yes. You can change colors, labels, event markers and axis settings.
Is there a horizontal version?
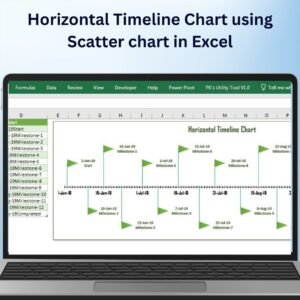
Yes. See the Horizontal Timeline Chart using Scatter chart in Excel.
Related Timeline and Chart Templates
- Horizontal Timeline Chart using Scatter chart in Excel: the same idea on a horizontal axis
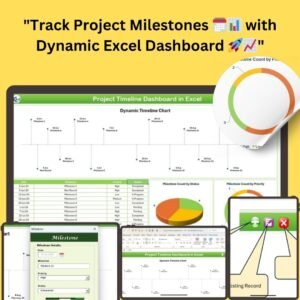
- Project Timeline Dashboard in Excel: a full dashboard for project schedules
- Construction Project Timeline in Google Sheets: a timeline for shared online use
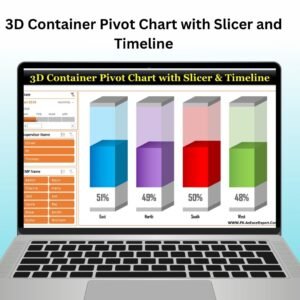
- 3D Container Pivot Chart with Slicer and Timeline: another chart technique for Excel
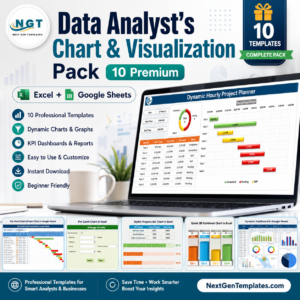
- Data Analyst’s Chart & Visualization Pack: ten chart templates in one download
Browse all Excel charts or the Excel project management templates.






Reviews
There are no reviews yet.