

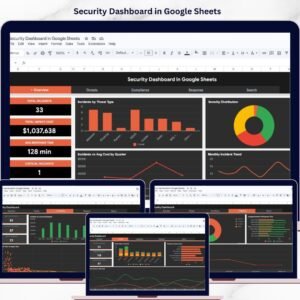
Security Dashboard in Google Sheets is a powerful, ready-to-use analytics template built for IT security managers, cybersecurity analysts, SOC teams, compliance officers, and CISOs who need to track security incidents, monitor threat types, analyze compliance frameworks, evaluate incident response times, and manage analyst performance from a single collaborative Google Sheets dashboard. This template includes 4 interactive dashboard pages, a Search Page, and a structured Data Sheet — giving you complete visibility into your organization’s cybersecurity posture at a glance.
If you are managing security incidents using scattered spreadsheets or manual reports, this Security Dashboard in Google Sheets transforms your workflow by delivering real-time visual insights through Google Sheets’ built-in charting and formula engine. The dashboard tracks 5 key metrics including Total Incidents, Total Impact Cost, Avg Response Time, Critical Incidents, and Resolution Rate — making it one of the most complete Google Sheets Dashboard templates for cybersecurity incident monitoring available today.
🔑 Key Features of Security Dashboard in Google Sheets
📊 4 Interactive Dashboard Pages + Search Page + Data Sheet — Overview, Threats, Compliance, and Response pages deliver 360-degree visibility into your security operations, threat landscape, compliance posture, and incident response effectiveness.
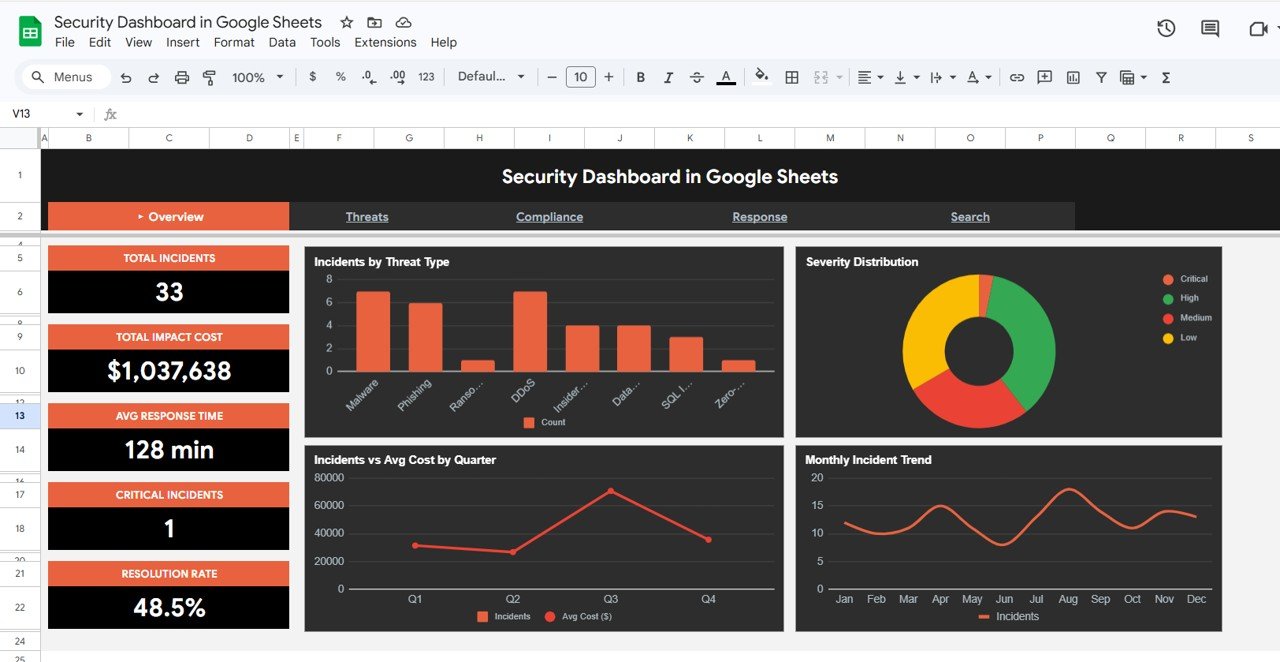
📈 5 High-Level KPI Cards on Overview Page — Total Incidents, Total Impact Cost, Avg Response Time, Critical Incidents, and Resolution Rate provide an executive-level summary of your cybersecurity health instantly.
🎛 Multiple Slicers for Quick Filtering — Apply dynamic filters across the entire dashboard to quickly drill down into specific threat types, severity levels, frameworks, regions, or time periods and see filtered results instantly.
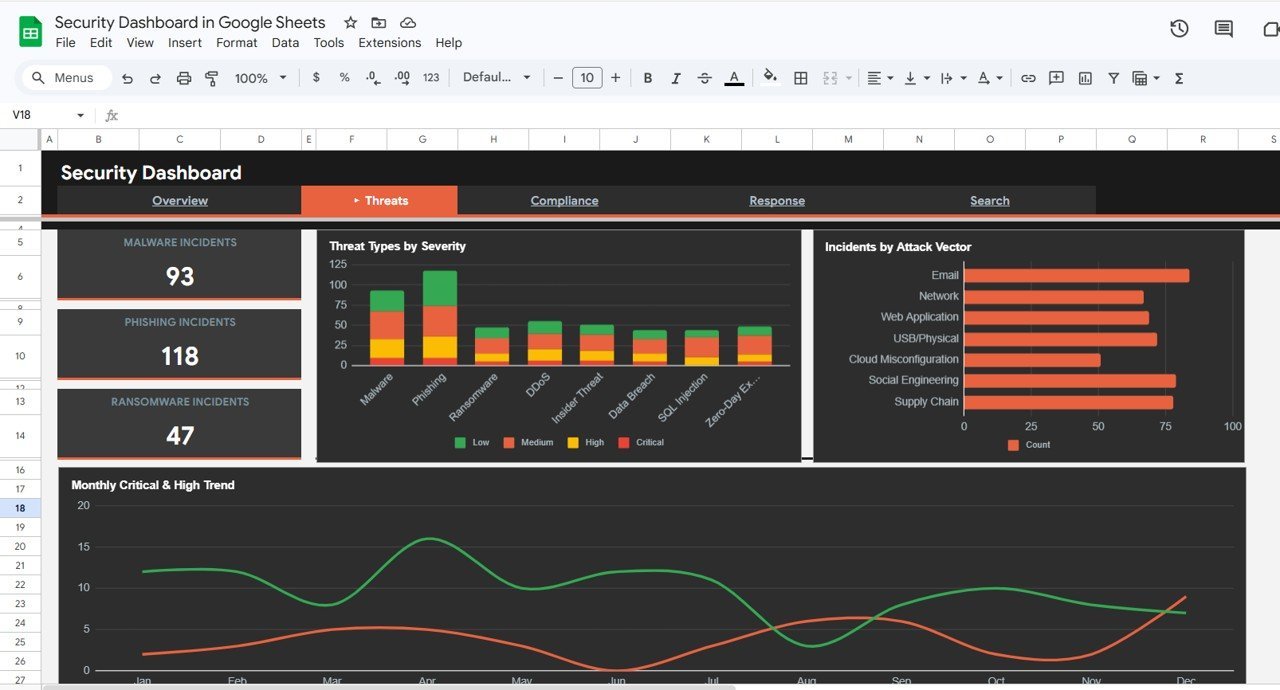
🔍 Threat Analysis Module — Dedicated Threats page tracks Malware Incidents, Phishing Incidents, Ransomware Incidents, Threat Types by Severity, Incidents by Attack Vector, and Monthly Critical and High Trend by Month for proactive threat intelligence.
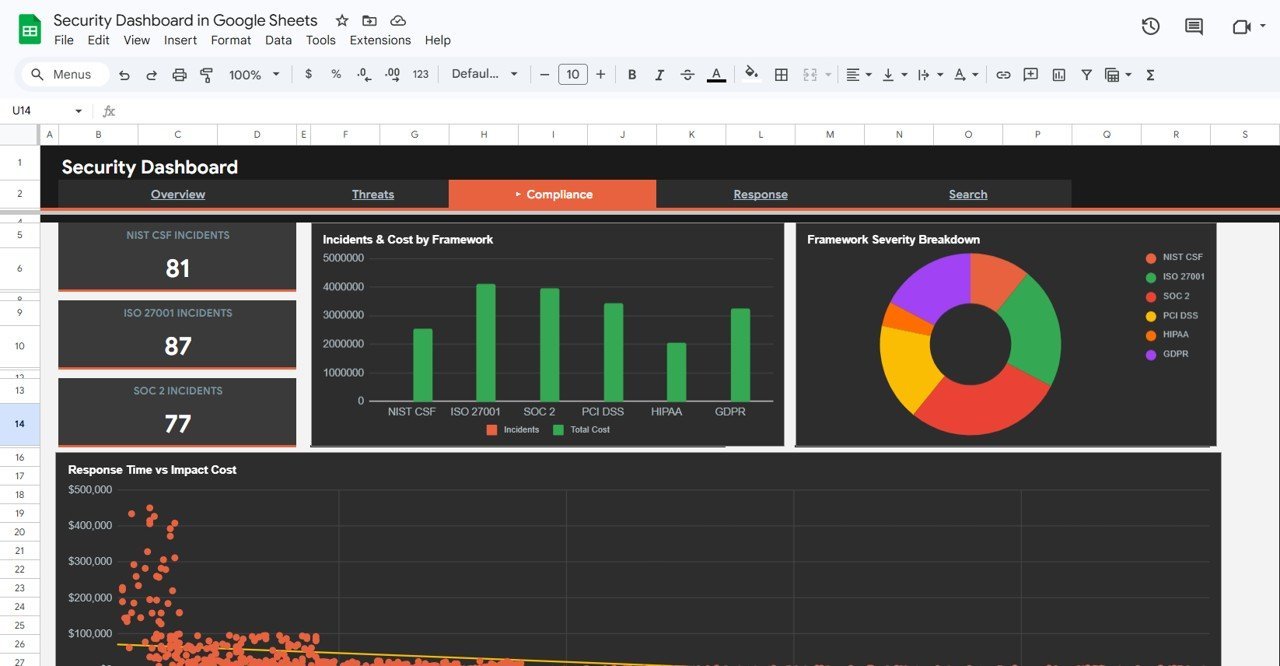
📋 Compliance Framework Tracking — Monitor NIST CSF Incidents, ISO 27001 Incidents, SOC 2 Incidents, Incidents and Cost by Framework, Framework Severity Breakdown by Framework, and Response Time vs Impact Cost for regulatory compliance visibility.
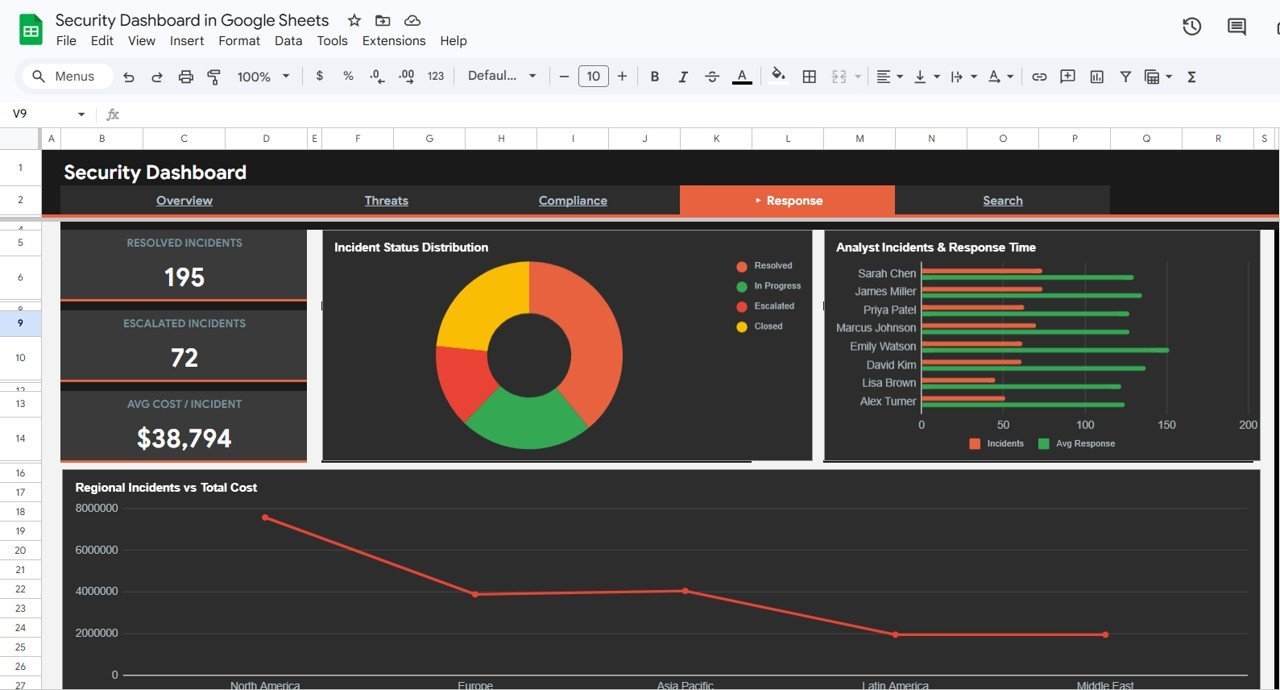
👨💻 Response Performance Analytics — Track Resolved Incidents, Escalated Incidents, Avg Cost per Incident, Incident Status Distribution by Status, Analyst Incidents and Response Time by Analyst, and Regional Incidents vs Total Cost by Region for workforce optimization.
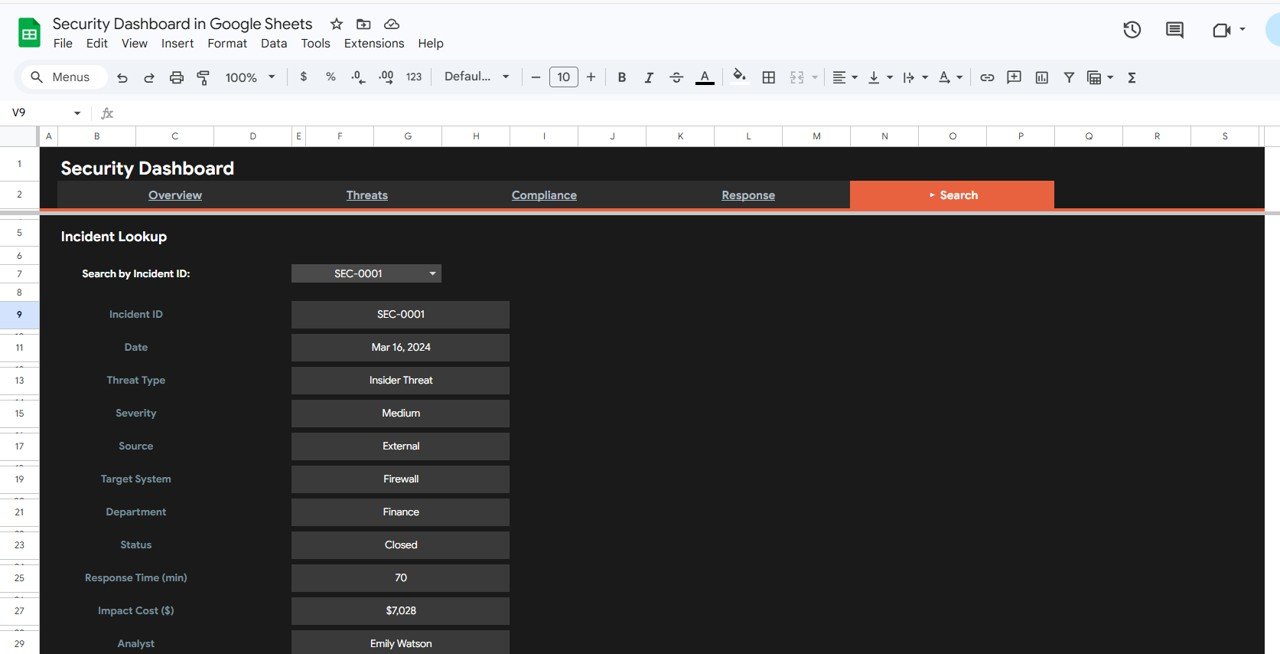
🔎 Incident Lookup Search Page — Search by Incident ID using the dropdown and instantly view all related details such as Date, Threat Type, Severity, Source, Target System, Department, Status, Response Time, Impact Cost, and Analyst.
🔄 Dynamic Charts Powered by Google Sheets Formulas — Every chart auto-updates when you replace the sample data with your own records. No macros, no scripts — pure Google Sheets formula-driven analytics.
☁️ Collaborative Google Sheets Platform — Share with your entire security team in real-time. Multiple users can view and analyze the dashboard simultaneously from any device with Google Drive access.
📦 What’s Inside the Security Dashboard in Google Sheets
This Google Sheets dashboard template includes 6 sheet tabs designed for comprehensive cybersecurity incident tracking and monitoring:
📊 1 — Overview Page — Displays 5 KPI cards (Total Incidents, Total Impact Cost, Avg Response Time, Critical Incidents, Resolution Rate) along with charts showing Incidents by Threat Type analyzing the distribution of incidents across different threat categories, Severity Distribution by Level showing the breakdown of incident severity levels, Incidents vs Avg Cost by Quarter comparing quarterly incident volumes against their average cost impact, and Monthly Incident Trend by Month revealing seasonal patterns and spikes in security events. Multiple slicers allow instant filtering across all dimensions for quick drill-down analysis.
 Security Dashboard in Google Sheets
🛡 2 — Threats Page — Deep-dive into threat intelligence with dedicated KPI cards showing Malware Incidents, Phishing Incidents, and Ransomware Incidents. Charts include Threat Types by Severity breaking down each threat category by severity level, Incidents by Attack Vector identifying the most common attack vectors used by threat actors, and Monthly Critical and High Trend by Month tracking the escalation patterns of high-priority threats over time.
 Threats Page
📋 3 — Compliance Page — Regulatory compliance analysis with KPI cards showing NIST CSF Incidents, ISO 27001 Incidents, and SOC 2 Incidents. Charts include Incidents and Cost by Framework comparing incident volumes and their financial impact across compliance frameworks, Framework Severity Breakdown by Framework showing severity distributions within each regulatory framework, and Response Time vs Impact Cost revealing the correlation between how quickly incidents are resolved and their total cost impact.
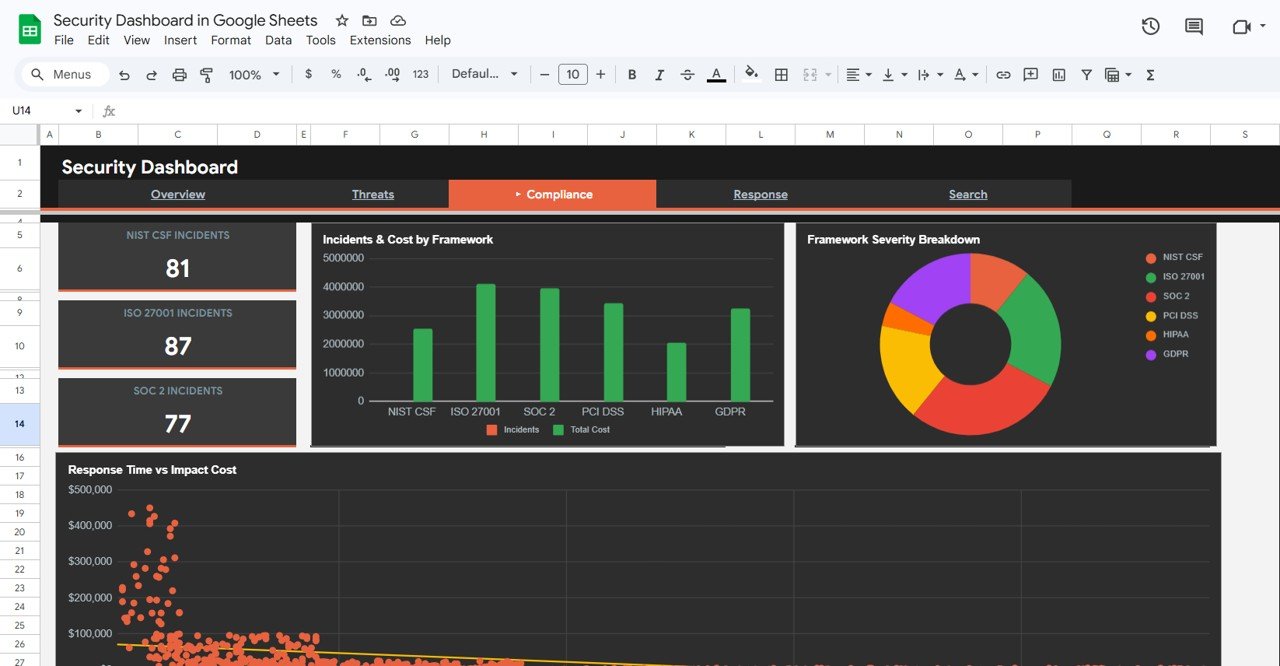 Compliance Page
⚡ 4 — Response Page — Incident response performance analysis with KPI cards showing Resolved Incidents, Escalated Incidents, and Avg Cost per Incident. Charts include Incident Status Distribution by Status showing the current status breakdown of all incidents, Analyst Incidents and Response Time by Analyst evaluating individual analyst workload and response efficiency, and Regional Incidents vs Total Cost by Region identifying which regions have the highest incident volumes and associated costs.
 Response Page
🔎 5 — Search Page — The Incident Lookup feature allows you to search by Incident ID using the dropdown and instantly view all related details such as Date, Threat Type, Severity, Source, Target System, Department, Status, Response Time, Impact Cost, and Analyst. Perfect for quick incident lookups and audit trail reviews.
 Search Sheet Tab
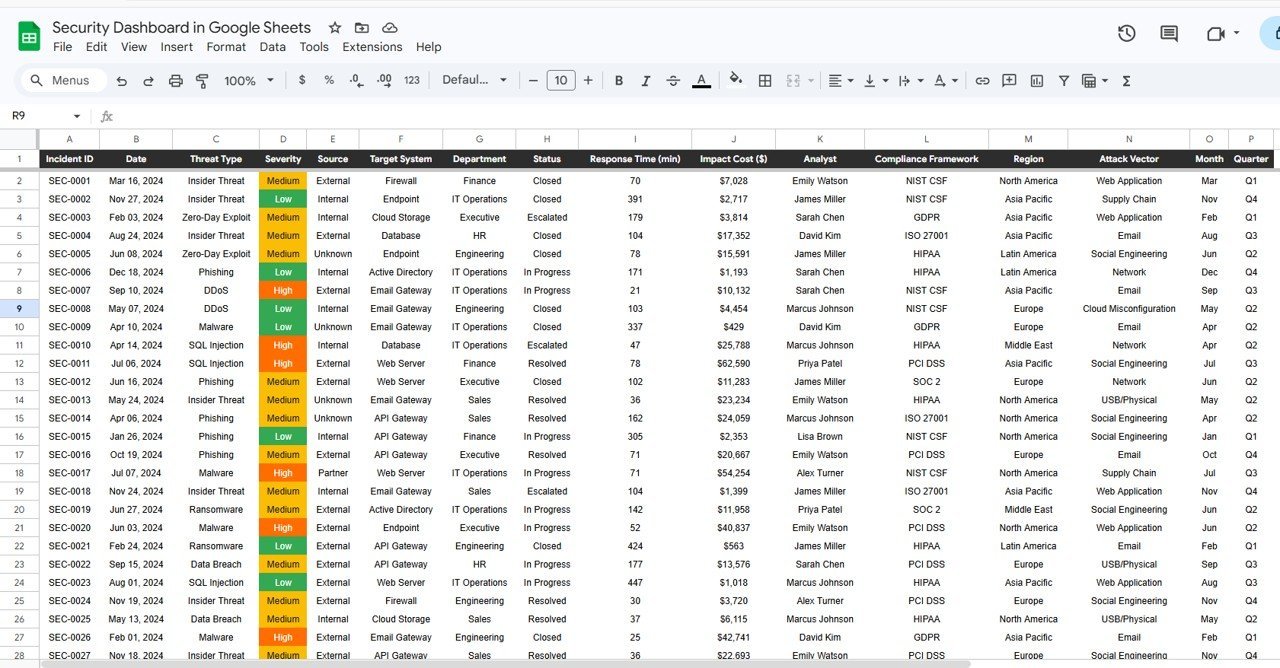
📝 6 — Data Sheet Tab — This is the Data Sheet where you add your security incident data in the same format. Replace the sample data with your own records and the entire dashboard updates automatically.
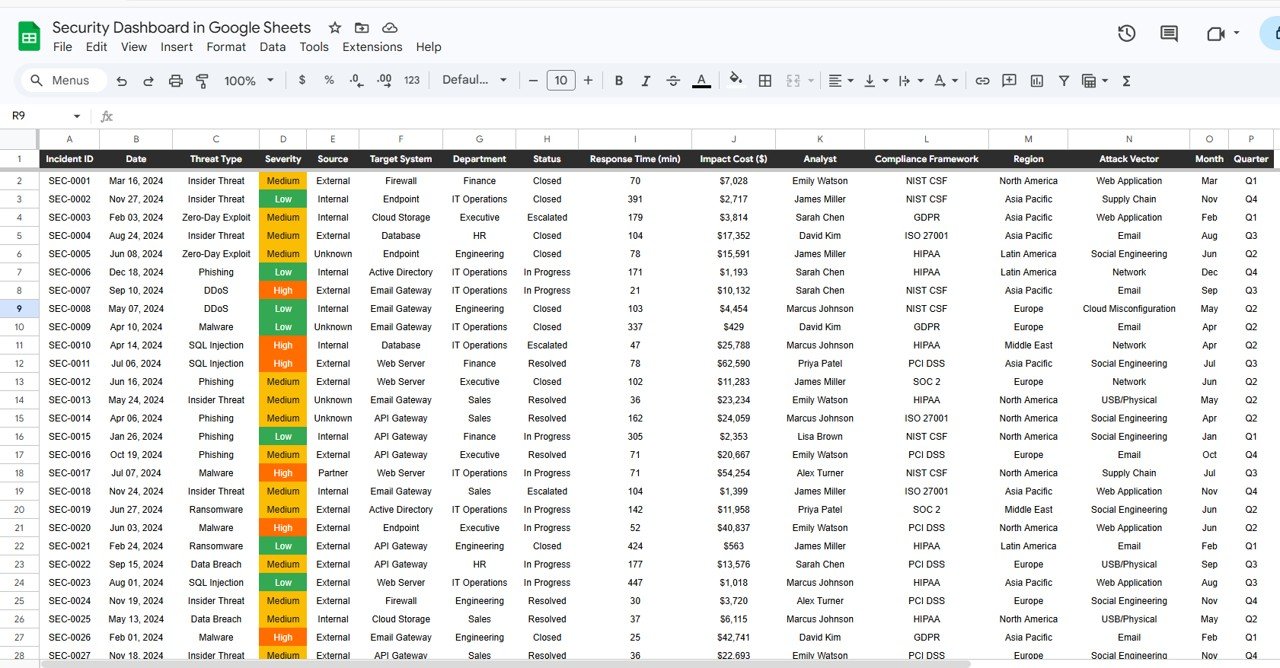 Data Sheet Tab
⚙️ How to Use the Security Dashboard in Google Sheets
1️⃣ Get Your Copy — After purchase, open the PDF guide and click the Google Sheets copy link to create your own editable version in Google Drive.
2️⃣ Navigate to the Data Sheet — Review the sample data structure and column headers to understand the required format.
3️⃣ Replace Sample Data — Clear the sample rows and paste your own security incident records in the same column format.
4️⃣ Explore Dashboard Pages — Navigate through Overview, Threats, Compliance, and Response pages to analyze your data.
5️⃣ Apply Slicer Filters — Use the slicers on the Overview page to filter the dashboard by threat type, severity, framework, or any other dimension.
6️⃣ Use the Search Page — Look up any specific incident by ID using the dropdown for instant detail retrieval.
7️⃣ Share with Your Team — Share the Google Sheet with your security team members for real-time collaborative analytics.
👥 Who Can Benefit from This Security Dashboard in Google Sheets
🔒 IT Security Managers — Monitor incident volumes, severity trends, and compliance posture across the entire organization.
🛡 Cybersecurity Analysts & SOC Teams — Track threat types, attack vectors, and response times for operational security monitoring.
📋 Compliance Officers — Evaluate NIST CSF, ISO 27001, and SOC 2 compliance metrics with dedicated framework analysis.
👨💼 CISOs & IT Directors — Get executive-level insights into cybersecurity health and incident response effectiveness.
📊 Risk Management Teams — Analyze impact costs, regional incident distribution, and response efficiency for risk mitigation planning.
Whether you manage internal IT security, a managed security service, or enterprise SOC operations, this IT Dashboard in Google Sheets provides the visibility you need to detect, respond to, and recover from security incidents faster.
❓ Frequently Asked Questions
What KPIs does the Security Dashboard in Google Sheets track?
The Security Dashboard in Google Sheets tracks 5 key performance indicators on the overview page: Total Incidents, Total Impact Cost, Avg Response Time, Critical Incidents, and Resolution Rate. Additional metrics across 4 analysis pages include threat type distribution, severity breakdown, compliance framework incidents, analyst performance, and regional cost analysis.
Do I need advanced Google Sheets skills to use this dashboard?
No. Simply make a copy of the Google Sheet using the link provided in the PDF guide, replace the sample data with your own security incident records, and all charts and KPI cards update automatically. No scripts, macros, or advanced formulas to configure.
Can multiple team members access this dashboard simultaneously?
Yes. Since this dashboard runs on Google Sheets, you can share it with your entire security team via Google Drive. Multiple users can view and analyze the dashboard simultaneously from any device with internet access.
Which compliance frameworks does this dashboard support?
The Compliance page tracks incidents mapped to NIST CSF, ISO 27001, and SOC 2 frameworks out of the box. You can customize the data sheet to add additional compliance frameworks relevant to your organization.
What is the best Google Sheets template for tracking cybersecurity incidents?
The Security Dashboard in Google Sheets from NextGenTemplates is one of the best options available. It includes 4 interactive dashboard pages, 5 KPI cards, threat analysis, compliance tracking, response analytics, an incident lookup search page, and a structured data sheet — all in a single collaborative Google Sheets workbook.
🔗 Explore Related Templates
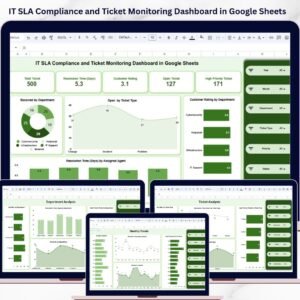
📊 IT SLA Compliance and Ticket Monitoring Dashboard in Google Sheets — Track IT ticket SLA compliance, response times, and agent performance with interactive Google Sheets analytics.
📊 IT Services Dashboard in HTML — Monitor IT service requests, SLA compliance, team performance, and service trends with interactive browser-based analytics.
📊 Cloud Migration Services Dashboard in Power BI — Track cloud migration projects across platforms and industries with interactive Power BI visuals.
Browse all Google Sheets Dashboard Templates on NextGenTemplates.
📖 Click here to read the Detailed Blog Post
Watch the step-by-step video tutorial:


Reviews
There are no reviews yet.