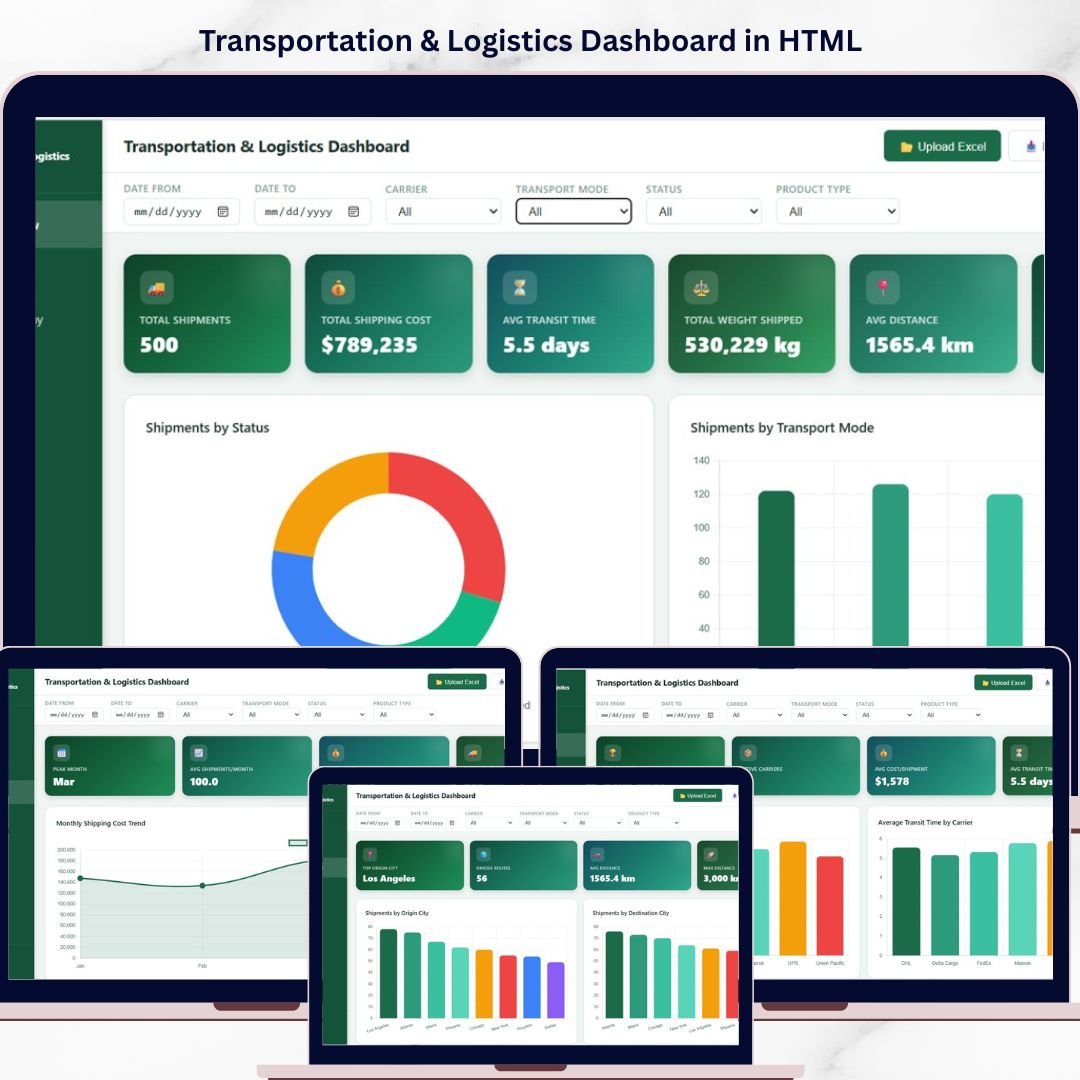
Transportation and Logistics Dashboard in HTML is a powerful, ready-to-use interactive dashboard designed to help you monitor, analyze, and optimize your entire logistics and shipping operations from a single screen 🚀. Whether you manage a fleet of trucks, handle warehouse operations, or coordinate international shipments, this dashboard provides the clarity and insight you need to stay ahead of every delivery.
In today’s competitive supply chain environment, relying on scattered spreadsheets and manual tracking is no longer sustainable. This HTML-based dashboard brings all your critical data together into one beautiful, browser-friendly interface with real-time visuals, interactive slicers, and comprehensive analytics. As a result, you can make faster, smarter, and more profitable decisions every single day.
🔑 Key Features of Transportation and Logistics Dashboard in HTML
📊 Interactive Multi-Page Dashboard – Navigate across 5 powerful analysis pages for a complete view of your logistics operations
📦 Real-Time KPI Cards – Track Total Shipments, Total Shipping Cost, Avg Transit Time, Total Weight Shipped, Avg Distance, and Delivery Rate at a glance
🚚 Carrier Performance Analysis – Evaluate carrier costs, transit times, and delivery success rates to choose the best partners
🗺️ Route and Geography Insights – Analyze shipments by origin city, destination city, and identify the busiest routes
📈 Monthly Trend Tracking – Monitor shipping costs, transit times, and weight trends over time for strategic planning
🔍 Advanced Data Explorer – Search, sort, and filter shipment records with CSV export functionality
🎯 Dynamic Slicers – Apply filters across all pages to drill down into specific data segments
⚡ Browser-Based Interface – No software installation needed. Open in any modern web browser and start analyzing instantly
🧩 Fully Responsive Design – Works perfectly on desktops, laptops, and tablets
📦 What’s Inside the Transportation and Logistics Dashboard in HTML
This dashboard includes 5 interactive pages plus a data explorer:
🏠 Overview Page – Your central command center with KPI cards showing Total Shipments, Total Shipping Cost, Avg Transit Time, Total Weight Shipped, Avg Distance, and Delivery Rate. It also features visual analysis including Shipments by Status, Shipments by Transport Mode, Top Carriers by Shipment Volume, Cost Distribution by Product Type, and Monthly Shipment Trend.
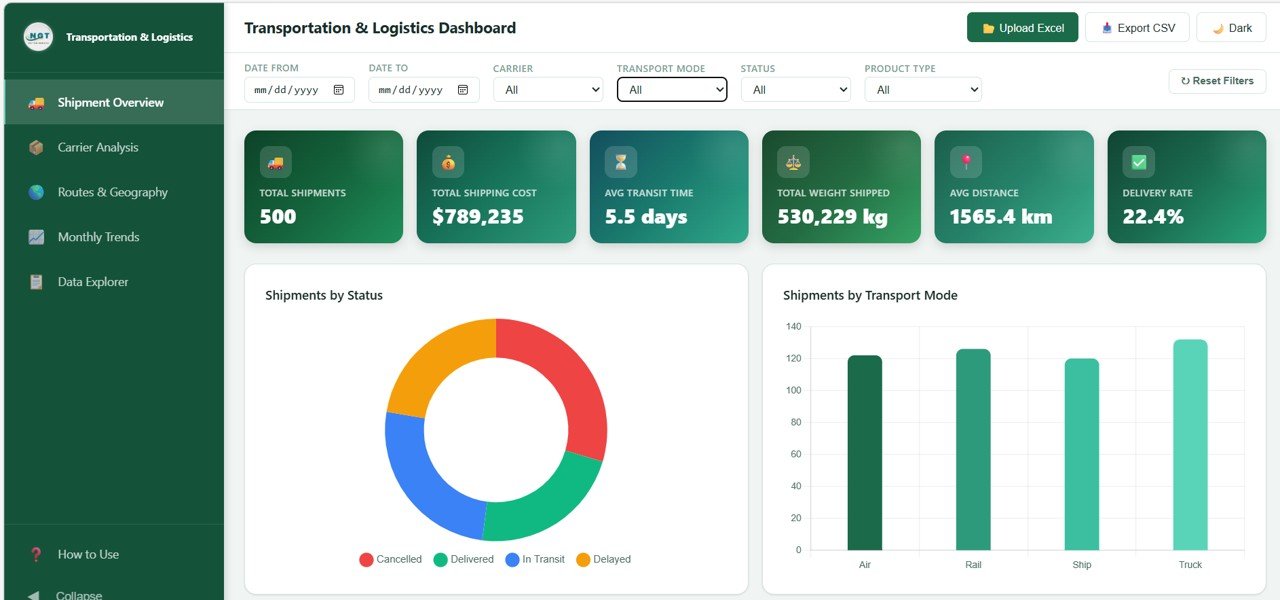 Transportation and Logistics Dashboard
📊 Carrier Analysis Page – Deep dive into carrier performance with Average Cost per Carrier, Average Transit Time by Carrier, Carrier Performance by Status, and Carrier Revenue Share.
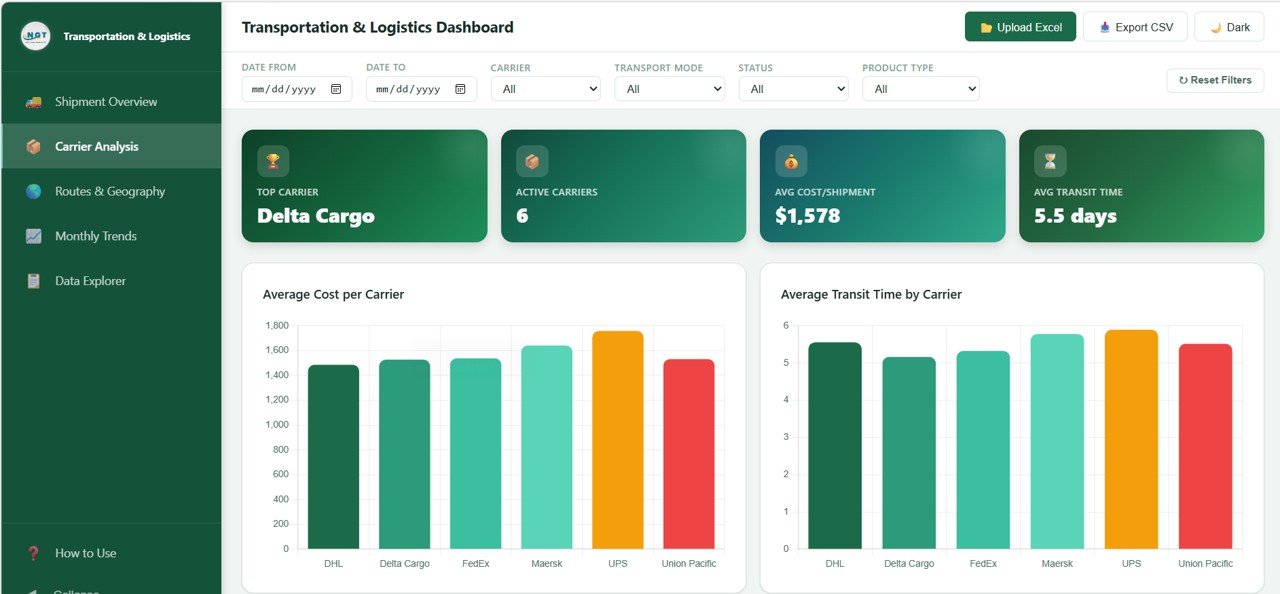 Carrier Analysis
🗺️ Routes and Geography Page – Understand geographic distribution with Shipments by Origin City, Shipments by Destination City, Average Distance by Transport Mode, and Top 10 Routes by Volume.
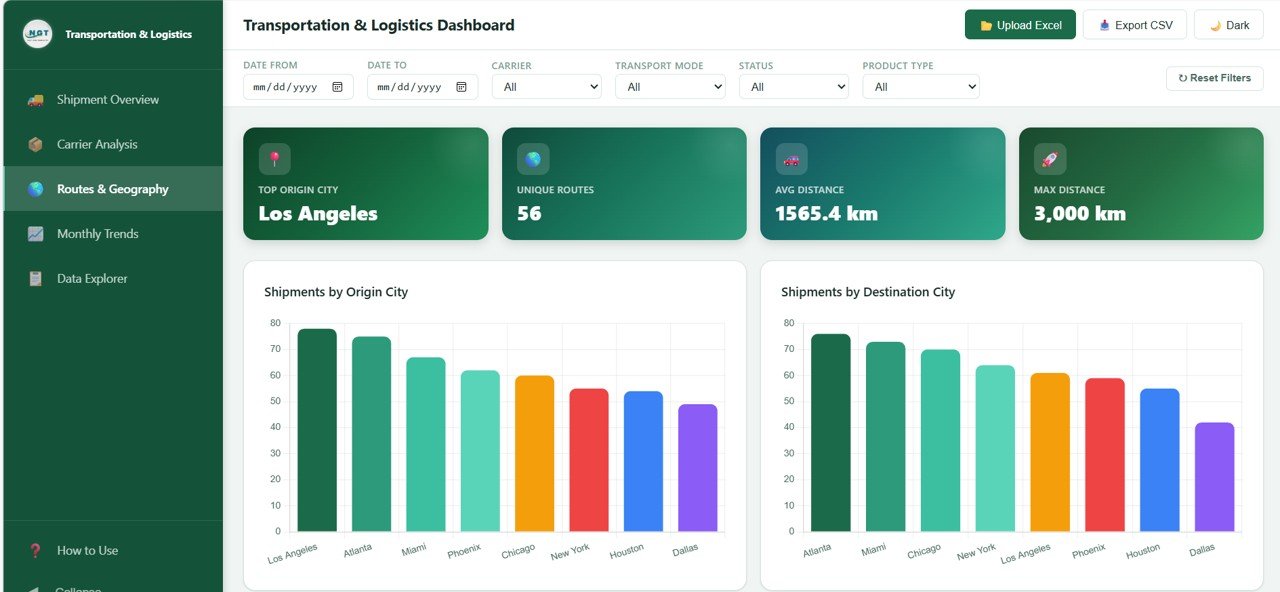 Routes and Geography
📅 Monthly Trends Page – Track performance over time with Monthly Shipping Cost Trend, Monthly Avg Transit Time, Monthly Weight Shipped, and Status Distribution by Month.
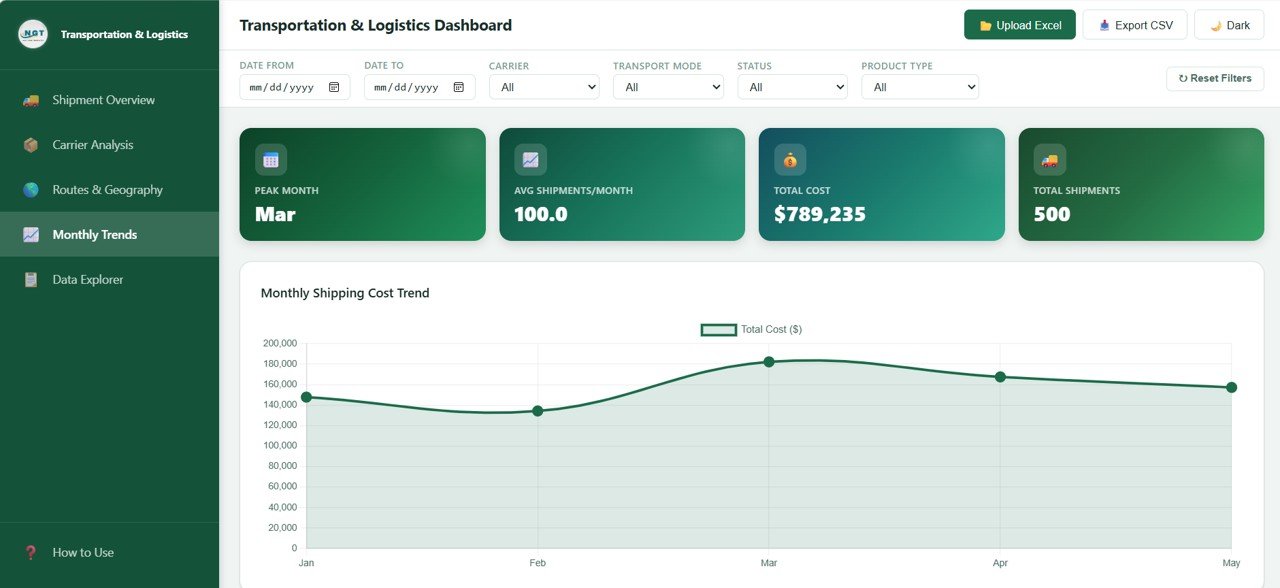 Monthly Trends
🔍 Data Explorer Page – Access all your shipment records with a searchable data table, export to CSV functionality, and column sorting and filtering for quick lookups.
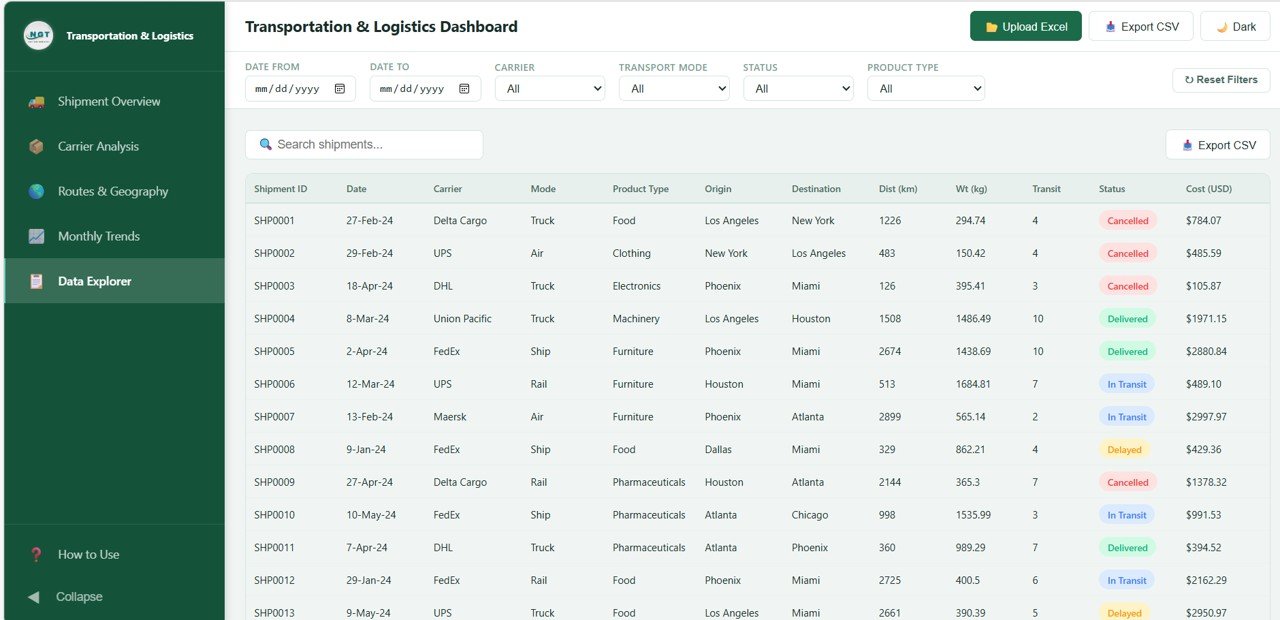 Data Explorer
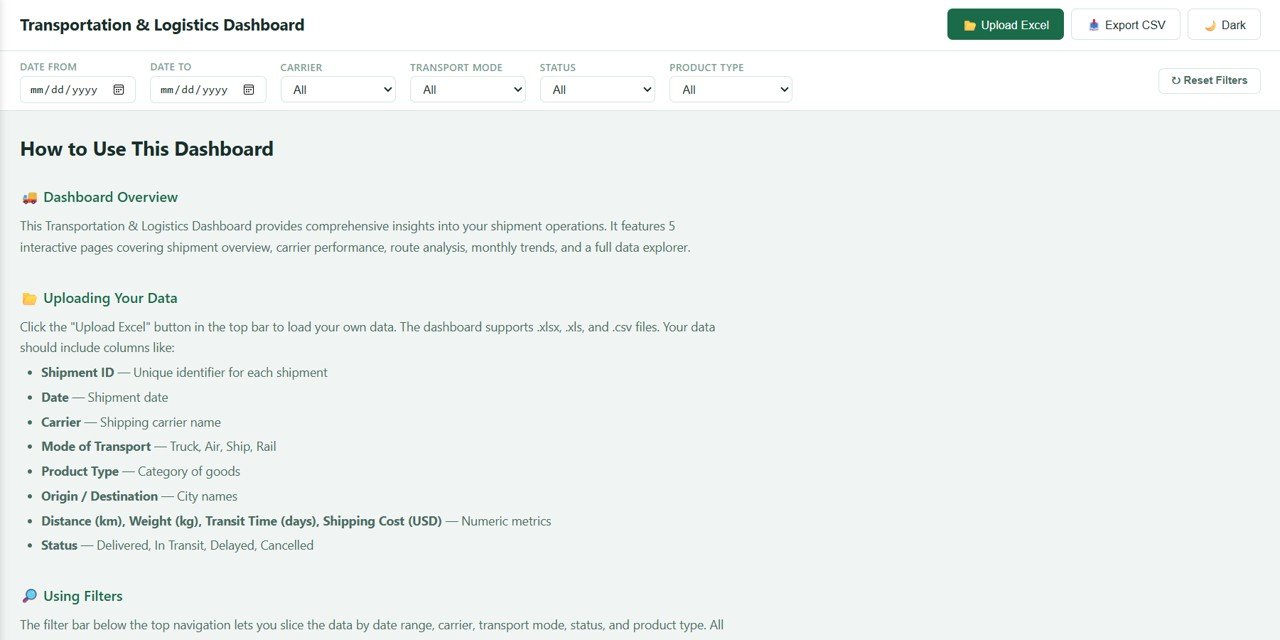
⚙️ How to Use the Transportation and Logistics Dashboard in HTML
1️⃣ Download the Template – Get the ZIP file and extract it to your computer
2️⃣ Open in Browser – Launch the HTML file in Chrome, Edge, Firefox, or Safari
3️⃣ Explore Dashboard Pages – Navigate across Overview, Carrier Analysis, Routes, Monthly Trends, and Data Explorer
4️⃣ Apply Filters – Use slicers to narrow down your analysis by status, transport mode, carrier, or time period
5️⃣ Export Data – Use the Data Explorer to search records and export them to CSV for further analysis
👉 Within minutes, you can transform your raw shipment data into powerful logistics insights 🚀
👥 Who Can Benefit from This Transportation and Logistics Dashboard in HTML
🚚 Logistics Managers – Monitor shipments, costs, and delivery performance
📦 Supply Chain Professionals – Optimize routes and carrier partnerships
🏭 Warehouse Managers – Track incoming and outgoing shipment volumes
📊 Operations Analysts – Generate insights and identify bottlenecks
🏢 Business Owners – Gain full visibility into logistics costs and efficiency
🌍 Freight Forwarders – Evaluate carrier performance and transit times
👉 Anyone involved in transportation, shipping, and supply chain management will find this tool indispensable.
Explore more logistics and supply chain templates on our website including the Port Logistics Dashboard in Power BI and the Supply Chain Delivery Calendar in Excel.
📖 Click here to read the Detailed Blog Post
🎥 Visit our YouTube channel to learn step-by-step video tutorials
👉 YouTube.com/@NextGenTemplates


Reviews
There are no reviews yet.